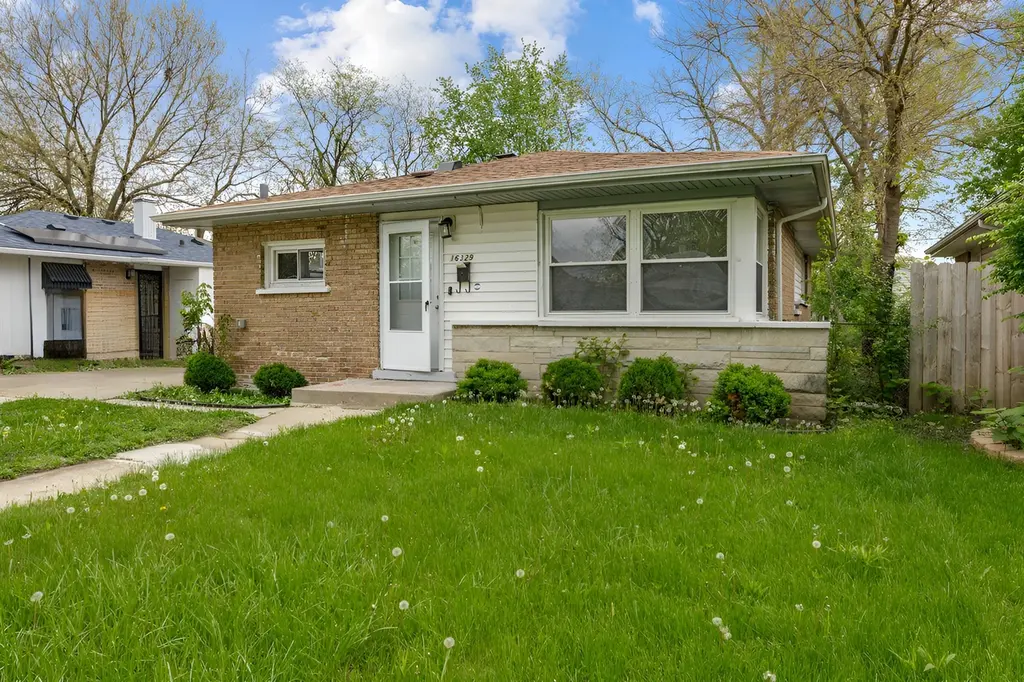
16329 Hermitage Ave · Markham, IL
Flood risk 1/10 · Minimal
- FEMA flood zone
- X (shaded)
- Chance of flooding over 30 yrs
- 0.0%
- Est. flood insurance / yr
- $473 – $860
Fire risk 1/10 · Minimal
- Est. fire insurance / yr
- $804 – $1,492
Heat risk 3/10 · Minor
- Hot days now (above 102°F)
- 7 days/yr
- Hot days in 30 yrs
- 15 days/yr
Wind risk 2/10 · Minimal
- Chance of severe wind over 30 yrs
- —
Air-quality risk 3/10 · Minor
- Unhealthy air days now
- 4 days/yr
- Unhealthy air days in 30 yrs
- 4 days/yr
Risk factors via First Street. Map © Google.
Why this score? — see what drove the C+ grade
The composite is a weighted blend of 9 inputs, each scored 0–100. Each bar is that input's sub-score; the figure is the points it added to the 100-point composite (weight × sub-score).
- Cash flow +27.2/30.0
- Appreciation +10.0/10.0
- DSCR +9.5/10.0
- 1% rule +8.7/10.0
- Livability +3.8/5.0
- Rent growth +2.5/5.0
- Condition / age +2.5/5.0
- Schools +0.7/10.0
- ARV discount +0.0/15.0
$164,900
🖨 Deal sheet (PDF) 📄 Offer letter ✓ Due diligence
Listing remarks
Welcome home to this beautiful brick ranch featuring 3 bedrooms and 1 bathroom with a bright, functional layout. This move-in-ready home offers an updated kitchen, spacious living area, central air, and a detached 2-car garage with a side driveway for extra parking. Located on a quiet residential street close to schools, parks, shopping, and expressways, this property is perfect for homeowners or investors alike. A great opportunity in a convenient Markham location! Sold as is. Seller does not provide survey. Buyer to take subject to municipal requirements, if any. * Property not for rent - beware of rental scams. *
Key facts
- Side driveway
- Spacious living area
- Updated kitchen
Tags
Property features AI
Finance
- Other: Ownership: Fee simple; Possession at closing
- HOA & community: No master association fee required
Exterior
- Parking: Detached garage with 2 garage spaces (2 total parking spaces)
- Utilities: Public water; Public sewer
- Home design: Detached single-family home; One-story
- Construction: Brick construction; Built more than 60 years ago (built before 1978)
- Exterior features: Lot under 0.25 acre; Lot dimensions: 5,940
Interior
- Kitchen: Kitchen on the main level
- Bedrooms: Three bedrooms (all on the main level); Master bedroom on the main level
- Bathrooms: One full bathroom
- Heating & cooling: Natural gas forced air heating; Central air conditioning
- Interior features: Five total rooms
- Laundry & utility: Laundry room; Gas dryer hookup
Neighborhood map
What this means for you Summary
Snapshot
- This is a 2-bed/1.0-bath single-family listed at $165k.
Deal economics
- At list price, monthly cash flow is $473 ($6k/yr) — positive.
- The deal already cash-flows at list — no discount required.
- Meets the 1% rule at list price ($2k rent vs $165k).
- Recommended offer: $160k (3.0% below list) — sets the bar for market timing.
Location & tenants
- Location reads 76/100 on livability (#186 in IL, #3,539 nationally) — a middle-class / working-renter tenant base. Strengths: commute A+, cost of living A+, housing A+; Watch: crime D, amenities D, employment D.
- Thornton Twp Hsd 205 (suburban): math 7% / reading 8% proficiency, ranked #594 of 620 in IL (top 96%) — low school quality limits family demand, transient renter base, plan for 1-2y turnover.
- Market conditions: 65 active listings in the ZIP; 7 comparable units currently listed for rent nearby; rentals leasing fast (median 0d on market — plan ~1-2 weeks tenant-placement turnaround); 6,272 units permitted in Cook County in 2024 (4,658 in 5+ unit buildings).
Forward outlook
- In year one you build about $18k of equity ($1k loan paydown + $16k appreciation (10.0% local appreciation)).
- At projected returns (10.0% appreciation + 3.0% rent growth), your $46k cash investment doubles in ~2 years — after that, you're playing with house money.
- By year 3, paydown + projected appreciation supports a ~$45k cash-out refi (75% LTV) — recoverable capital for the next deal without selling this one.
Negotiation context
- It's been on market 40 days — a 3% lower offer ($160k) is reasonable based on typical stale-listing flexibility.
- 2 sale attempts with the ask held roughly flat each time — persistent listings suggest the price (not the market) is what's stuck; bring a comps-based counter.
- Current owner paid $78k; list at $165k implies a 110% gain — meaningful room to come down on a strong offer.
Risks & watch-outs
- Watch-outs: property tax is 2.7% of price; built in 1957 — expect roof / HVAC / electrical / plumbing capex.
Questions for the listing agent
- It's been on market 40 days. Have you received any prior offers? Is the seller open to a 3% concession, seller financing, or rate buy-down credit?
- Built in 1957 — when were the roof, HVAC, electrical panel, plumbing, and water heater last replaced?
- Property tax is high relative to price — has the assessment been appealed recently, and will the sale trigger a re-assessment?
- Is there a deadline driving the sale (1031 exchange, divorce, estate, relocation)? That informs how much negotiation room exists.
- Schools are F-rated, which usually means shorter tenancies and higher turnover. Who's the typical renter profile here, and what's been the actual vacancy rate?
- Crime grade is D in this area — have there been break-ins, vandalism, or insurance claims at this property in the last 3 years? What carrier currently insures it and at what premium?
- What's the average days-on-market for RENTAL listings here right now (not sales)? A rising rental-DOM trend means longer vacancies and softer asking-rent achievability than the comps imply.
- What's the recent tenant-quality profile in this submarket — average credit score on applications, eviction rate, late-payment / NSF rate, and stable-employment percentage? A property-management company in the area should have these aggregated.
- How much new for-sale + rental construction is in the pipeline within 1–3 miles? Heavy new supply typically softens prices + rents 12–24 months out; constrained supply supports both.
Investment metrics
- 1% rule
- 1.37% ✓
- Cap rate
- 9.73%
- Cash-on-cash
- 12.28%
- DSCR
- 1.55
- GRM
- 6.1
CMA / ARV
- ARV (on-the-fly)
- $139,896
- Comps found
- 12
Show comp detail 12 sales within ~0.75 mi
| Address | Dist | Beds/Ba | Sqft | Sold | Price | $/sf | Match |
|---|---|---|---|---|---|---|---|
| 16221 Hermitage Ave | 0.14mi | 3/1.5 (+1) | 1,044 (0%) | 1mo | $192,000 | $184 | 86 |
| 16300 Winchester Ave | 0.28mi | 3/1.0 (+1) | 1,012 (-3%) | 2mo | $97,500 | $96 | 75 |
| 16444 Wolcott Ave | 0.27mi | 3/1.5 (+1) | 1,080 (+3%) | 3mo | $112,500 | $104 | 72 |
| 16607 Winchester Ave | 0.42mi | 3/2.0 (+1) | 1,053 (+1%) | 5mo | $226,000 | $215 | 66 |
| 16628 Winchester Ave | 0.47mi | 2/1.0 | 1,134 (+9%) | 1mo | $84,000 | $74 | 63 |
| 16019 Myrtle Ave | 0.53mi | 3/1.0 (+1) | 1,008 (-3%) | 3mo | $70,000 | $69 | 62 |
| 16807 Wood St | 0.58mi | 3/1.0 (+1) | 985 (-6%) | 0mo | $90,000 | $91 | 58 |
| 16735 Dixie Hwy | 0.62mi | 2/1.0 | 965 (-8%) | 1mo | $153,000 | $159 | 58 |
| 1924 169th St | 0.73mi | 2/1.0 | 1,086 (+4%) | 3mo | $189,900 | $175 | 56 |
| 1945 W 163rd St | 0.29mi | 3/1.0 (+1) | 1,188 (+14%) | 4mo | $159,500 | $134 | 56 |
| 16768 Bulger Ave | 0.72mi | 2/1.0 | 954 (-9%) | 4mo | $125,000 | $131 | 49 |
| 16727 Head Ave | 0.75mi | 3/1.5 (+1) | 1,150 (+10%) | 1mo | $157,000 | $137 | 40 |
Match score weights: distance 35% · size 25% · config 20% · recency 20%. Top-matched comps best support the ARV.
Projected returns pro-forma
10.0% appreciation · 3.0% rent growth · sell at horizon
- IRR
- 33.3%
- Equity multiple
- 3.60×
- Total profit
- $120,047
- Equity at exit
- $148,555
- IRR
- 28.8%
- Equity multiple
- 8.15×
- Total profit
- $330,125
- Equity at exit
- $320,364
Cash invested: $46,172 (down + closing). Projections, not guarantees.
Landlord ↔ Tenant lean methodology
- Overall (STATE)
- 43 Moderately Tenant-Leaning
- State Illinois
- 43 Moderately Tenant-Leaning · D+7
- County
- — inherits STATE
- City
- — inherits STATE
ZIP-level market 60428
- Home prices YoY
- 8.5%
- Active inventory
- 65
- Price-to-rent
- 6.1×
Monthly cashflow live
- Estimated rent
- $2,256 high interval (Pro) →
- Mortgage (P&I)
- −$865
- Tax from tax record
- −$376 /mo · $4,518/yr
- Insurance
- −$69
- HOA
- −$0
- Vacancy / Maint / Mgmt
- −$474
- Net cashflow
- $473
Break-even live
Sensitivity live
| Price | -10% $566 | -5% $519 | +0% $473 | +5% $426 | +10% $379 |
|---|---|---|---|---|---|
| Rent | -10% $294 | -5% $383 | +0% $473 | +5% $562 | +10% $651 |
| Rate | -1.0pp $556 | -0.5pp $515 | base $473 | +0.5pp $430 | +1.0pp $386 |
UW: 25.0% down · 7.5% · 30yr · 1.5% tax · 5.0% vac · 8.0% maint · 8.0% mgmt
Financing live
Cash to close
- Down payment
- $41,225
- Closing costs
- $4,947
- Reserves months
- —
- Total cash needed
- —
Loan-product check · same deal, 3 products live
Conventional
25% down · 7.5% · 30yr
- Down + closing
- —
- Monthly P&I
- —
- Monthly cashflow
- —
- DSCR
- —
- Eligible?
- —
Personal DTI + credit; lowest rate.
DSCR
20% down · 8.5% · 30yr
- Down + closing
- —
- Monthly P&I
- —
- Monthly cashflow
- —
- DSCR
- —
- Eligible?
- —
No personal income docs; deal must DSCR.
Hard money
10% down · 12.0% · 12mo
- Down + closing
- —
- Monthly P&I
- —
- Monthly cashflow
- —
- DSCR
- —
- Eligible?
- —
Short-term bridge; refi at stabilization.
Rent comps 7 comps
| Address | Beds | Baths | Sqft | Rent | $/sqft | DOM | Units | Dist |
|---|---|---|---|---|---|---|---|---|
| 16125 Marshfield Ave Markham, IL | 3.0 | 1.0 | 1043 | $2,400 | $2.30 | 0d | 1 | 0.27mi |
| 16751 Crane Ave Hazel Crest, IL | 3.0 | 1.0 | 1200 | $1,800 | $1.50 | 0d | 1 | 0.84mi |
| 16752 Artesian Ave Hazel Crest, IL | 3.0 | 1.0 | 867 | $2,500 | $2.88 | 0d | 1 | 1.05mi |
| 2107 171st St Unit 2107 Hazel Crest, IL | 3.0 | 1.5 | 1158 | $2,300 | $1.99 | 0d | 1 | 1.09mi |
| 2308 170th St Hazel Crest, IL | 3.0 | 2.0 | 1020 | $2,400 | $2.35 | 0d | 1 | 1.10mi |
| 2173 171st St Hazel Crest, IL | 3.0 | 1.5 | 1159 | $2,350 | $2.03 | 0d | 1 | 1.14mi |
| 16048 Halsted St Unit 2 Harvey, IL | 3.0 | 1.0 | 1091 | $1,650 | $1.51 | 25d | 1 | 1.19mi |
Listing history 19 events
-
2026-06-21days on market $164,900 Active 40 DOM
-
2026-06-18days on market $164,900 Active 37 DOM
-
2026-06-17days on market $164,900 Active 36 DOM
-
2026-06-16days on market $164,900 Active 35 DOM
-
2026-06-15days on market $164,900 Active 34 DOM
-
2026-06-13days on market $164,900 Active 32 DOM
-
2026-06-13days on market $164,900 Active 31 DOM
-
2026-06-09days on market $164,900 Active 28 DOM
-
2026-06-08days on market $164,900 Active 27 DOM
-
2026-06-07days on market $164,900 Active 26 DOM
-
2026-06-04days on market $164,900 Active 23 DOM
-
2026-06-03days on market $164,900 Active 22 DOM
-
2026-06-02days on market $164,900 Active 21 DOM
-
2026-06-01days on market $164,900 Active 20 DOM
-
2026-05-31days on market $164,900 Active 19 DOM
-
2026-05-12$164,900 Active
-
2025-12-31historical
-
2025-02-26Active
-
2006-05-03soldstatus $78,500
ⓘ Source: listings_history table (triggers on properties + properties_extension) + one-shot
backfill from property_details.listing_events for pre-trigger history.
Tax reassessment forecast IL · Partial reset (capped growth)
- Current annual tax
- $4,518 · $376/mo
- Projected year-2 tax
- $4,518 · $376/mo
- Expected delta
- $0/yr ($0/mo · 0.0%)
ⓘ Screening estimate from a state-policy table — verify with the county assessor before closing.
Climate risk First Street
- Flood 1/10 Low FEMA zone X (shaded) · 0% chance over 30 yrs
- Wildfire 1/10 Low
- Heat 3/10 Moderate 7 d/yr ≥102°F today · 15 d/yr by 30 yrs out
- Wind 2/10 Low
- Air quality 3/10 Moderate 4 unhealthy d/yr today · 4 by 30 yrs out
Nearby sold comps map
Loading sold comps map…
Walkable amenities ~0.75 mi
Loading nearby amenities…
Taxation est. · year 1
- Rental income
- $27,076
- − Mortgage interest
- −$9,237
- − Property taxes
- −$4,518
- − Insurance
- −$824
- − Repairs & maintenance
- −$2,166
- − Management
- −$2,166
- − Depreciation
- −$4,797
- Taxable income
- $3,368
- Est. tax owed @ 24.0%
- −$808
- After-tax cash flow
- $4,863/yr
For passive investors: Depreciation is non-cash, so a rental often shows a tax loss while cash-flowing — sheltering income. Rental losses are passive: they offset passive income freely, and up to $25,000/yr can offset ordinary (W-2) income if you actively participate and your MAGI is under $100k (phasing out to $0 by $150k); unused losses carry forward. On sale, claimed depreciation is recaptured at up to 25%, and gains may owe capital-gains tax (a 1031 exchange can defer both). Figures are a year-1 estimate at your 24.0% rate — not tax advice; consult a CPA.
Schools (NCES district)
- District
- Thornton Twp Hsd 205
- NCES district ID
- 1738970
- Math proficiency
- 7% ▬ 0.00%
- Reading proficiency
- 8% ▼ -2.00%
- Median HH income
- $43,392
- Composite
- 6.92/100
- National rank
- #9976
- State rank
- #594 of 620 in IL
Livability — Markham
- Score
- 76/100
- State rank
- #186
- US rank
- #3539
Category grades
Schools grade is shown separately in the Schools card above.
Census & demographics
- Census place
- Markham, IL
- City population
- 10,980
- Population (ZIP)
- 10,980
Population outlook (Cook County) Hauer SSP2
- Today (2025)
- 5,347,519 people
- By 2030
- 5,357,703 · +0.2%
- By 2040
- 5,324,924 · -0.4%
- By 2050
- 5,230,762 · -2.2%
- By 2075
- 4,785,735 · -10.5%
- By 2100
- 4,188,836 · -21.7%
Race, ethnicity, and origin ACS 2023
- Neighborhood character
- Predominantly Black (69%)
- Race & ethnicity
- Black 69% Hispanic / Latino 17% White 11% Two or more races 4%
- Hispanic origin (detail)
- Mexican 16%
- Common ancestry
- Romanian 1% Lithuanian 1% Iranian 1%
- Foreign-born
- 8% · Canada
- Languages at home
- 86% English-only · Spanish 14%
Political lean MEDSL · Cook
- 2024 margin
- Solid D (+42.0) · D 70.4% · R 28.4% · Other 1.2%
- 2008→2024 swing
- -11.4pp toward R · 2008: 53.4pp · 2024: 42.0pp
- All cycles
- 2024: D+42.0 2020: D+50.3 2016: D+53.0 2012: D+49.4 2008: D+53.4
Not yet ingested
- Civics
- —
Market trends
- HPI YoY
- ▲ 23.63%
- Current HPI
- 302.333
- Rent YoY
- —
- Metro
- —
- State GDP YoY
- ▲ 1.59%
- F500 in state
- 60
Industry mix (Fortune 500 HQ in IL)
| Industry | F500 HQs | Revenue |
|---|---|---|
| Insurance | 4 | $201B |
|
||
| Consumer Goods | 4 | $87B |
|
||
| Industrial Machinery | 3 | $64B |
|
||
| Healthcare | 2 | $55B |
|
||
| Retail / Pharmacy | 1 | $148B |
|
||
| Agriculture / Food | 1 | $86B |
|
||
Price history
+110.1% since first listed4 events — show timeline
- 2026-05-12 Listed $164,900 MRED as Distributed by MLS Grid
- 2025-12-31 Listing Removed — MRED as Distributed by MLS Grid
- 2025-02-26 Listed — MRED as Distributed by MLS Grid
- 2006-05-03 Sold (Public Records) $78,500 Public Records
Property tax history
+2.0%/yrLatest (2023): $4,518 · +7.5% YoY. Source: county tax records.
Cash-flow waterfall
monthlySold comps — $/sqft
last 12 mo · ≤1 miLoading sold comps…