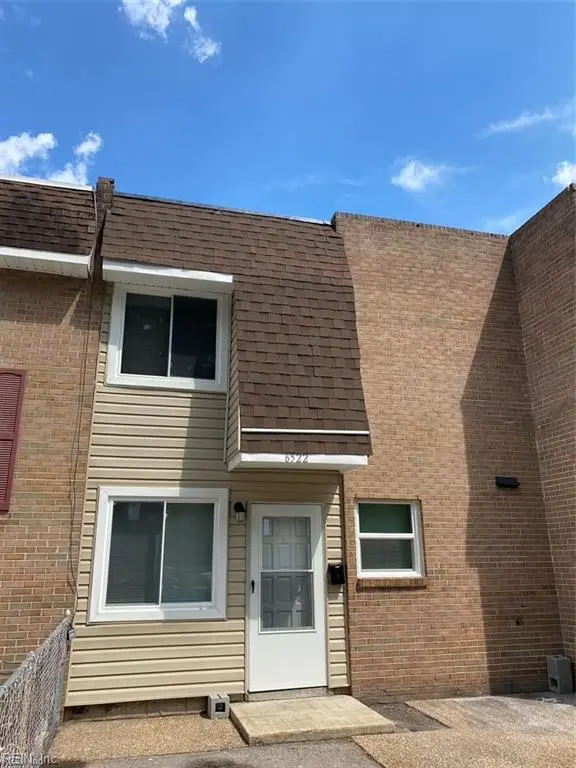
6522 Pasteur Ct · Norfolk, VA
Flood risk 1/10 · Minimal
- FEMA flood zone
- X (unshaded)
- Chance of flooding over 30 yrs
- 0.0%
- Est. flood insurance / yr
- $507 – $1,088
Fire risk 1/10 · Minimal
- Est. fire insurance / yr
- $666 – $1,236
Heat risk 9/10 · Severe
- Hot days now (above 105°F)
- 7 days/yr
- Hot days in 30 yrs
- 16 days/yr
Wind risk 8/10 · Major
- Chance of severe wind over 30 yrs
- 80.0%
Air-quality risk 3/10 · Minor
- Unhealthy air days now
- 2 days/yr
- Unhealthy air days in 30 yrs
- 3 days/yr
Risk factors via First Street. Map © Google.
Why this score? — see what drove the D grade
The composite is a weighted blend of 9 inputs, each scored 0–100. Each bar is that input's sub-score; the figure is the points it added to the 100-point composite (weight × sub-score).
- Cash flow +14.0/30.0
- ARV discount +7.1/15.0
- DSCR +4.3/10.0
- Livability +4.2/5.0
- 1% rule +3.7/10.0
- Schools +3.5/10.0
- Rent growth +3.4/5.0
- Condition / age +2.5/5.0
- Appreciation +0.0/10.0
$194,900
🖨 Deal sheet (PDF) 📄 Offer letter ✓ Due diligence
Listing remarks
Move in ready, modern and bright! Great for first time homeowners or add to your investment portfolio. New laminate flooring and fresh paint. Windows, roof, and HVAC replaced 2022. Kitchen with granite countertop and stainless-steel appliances. It also has two sheds in the backyard nice for extra storage or workshop. The home is near military bases, schools and shopping.
Key facts
- Fresh paint
- Granite countertop
- Two sheds
Tags
Property features AI
Finance
- HOA & community: Has HOA (Wellington Oaks) with $35 monthly POA fee; Trash pickup included
Exterior
- Parking: Driveway parking; Street parking
- Utilities: City/County water; City/County sewer; Gas water heater
- Home design: Detached townhouse; 2 stories; Slab foundation; Simple ownership
- Construction: Brick siding; Poly Skin roof; Built on slab foundation
- Exterior features: Deck; Patio; Back yard with chain link fence; Storage shed
Interior
- Kitchen: Dishwasher; Disposal; Gas range; Refrigerator
- Bedrooms: No bedroom with an en-suite
- Flooring: Carpet; Vinyl
- Bathrooms: 1 full bathroom
- Heating & cooling: Forced hot air heating; Central air conditioning
- Interior features: Cable hookup; Ceiling fan; Breakfast area; Foyer; Pantry; Utility closet
- Laundry & utility: Washer hookup; Dryer hookup
Neighborhood map
What this means for you Summary
Snapshot
- This is a 3-bed/1.0-bath townhouse listed at $195k.
Deal economics
- At list price, monthly cash flow is $26 ($309/yr) — positive.
- The deal already cash-flows at list — no discount required.
- To meet the 1% rule (rent ≥ 1% of price), the offer needs to be $170k (13.0% below list).
- Recommended offer: $170k (13.0% below list) — sets the bar for 1% rule.
- Cap rate 6.5% vs local median 4.0% in Norfolk — top-decile yield for the area; either an underpriced asset or a hidden risk that comps aren't pricing in. Stress-test before assuming the spread holds.
Location & tenants
- Location reads 83/100 on livability (#43 in VA, #1,026 nationally) — a professional / high-income tenant draw. Strengths: amenities A+, commute A+, health & safety A+; Watch: employment C-, crime F.
- Norfolk City Public School District (urban): math 27% / reading 56% proficiency, ranked #118 of 131 in VA (top 90%) — families likely to look elsewhere, expect single-tenant / working-renter base with shorter leases.
- Zoned schools: Tanners Creek Elementary (math 15% / reading 38%, grade F, #1,041 of 1,108 statewide, top 94%, 530 students, 98% FRL); Norview Middle (math 19% / reading 54%, grade F, #320 of 342 statewide, top 95%, 1,259 students, 89% FRL); Norview High (math 33% / reading 85%, grade C+, #256 of 319 statewide, top 81%, 1,915 students, 97% FRL) — zoned schools average 95% FRL vs 59% district-wide (36 pts higher); higher-poverty schools than district average — tighter screening recommended.
- Market conditions: Rents rising (+3.4%/yr); 135 active listings in the ZIP; 40 comparable units currently listed for rent nearby; rentals at typical pace (median 23d on market — plan ~3-4 weeks tenant-placement turnaround); 438 units permitted in Norfolk city in 2024 (273 in 5+ unit buildings).
Forward outlook
- Local home prices are declining (-3.0%/yr); year-one equity from $1k of loan paydown is wiped out by about $6k of value loss. Plan a longer hold.
Negotiation context
- Only 9 days on market — expect competitive offers; lowballing is unlikely to land.
- 4 sale attempts since 4y ago with the ask held roughly flat each time — persistent listings suggest the price (not the market) is what's stuck; bring a comps-based counter.
- Current owner paid $160k; 22% above their basis — modest negotiation headroom, anchor on the comps not their cost.
Risks & watch-outs
- Climate carrying-cost: severe wind risk, 80% chance of damaging wind over 30y; extreme-heat days projected 7→16/yr by 2055 (HVAC capex compounding) — expect insurance premiums to compound above CPI over the hold.
Questions for the listing agent
- Built in 1974 — when were the roof, HVAC, electrical panel, plumbing, and water heater last replaced?
- What does the HOA fee cover, when was the last increase, and are there any pending special assessments or reserve-fund shortfalls?
- Is there a deadline driving the sale (1031 exchange, divorce, estate, relocation)? That informs how much negotiation room exists.
- Schools are A-rated — typically a magnet for longer-tenancy family renters. What's the average tenant stay here, and is there a school-zone premium baked into asking?
- Crime grade is F in this area — have there been break-ins, vandalism, or insurance claims at this property in the last 3 years? What carrier currently insures it and at what premium?
- The area grade is low — what's the realistic commute time and amenity access for the typical tenant pool here? Any planned neighborhood developments (good or bad) we should know about?
- What's the average days-on-market for RENTAL listings here right now (not sales)? A rising rental-DOM trend means longer vacancies and softer asking-rent achievability than the comps imply.
- What's the recent tenant-quality profile in this submarket — average credit score on applications, eviction rate, late-payment / NSF rate, and stable-employment percentage? A property-management company in the area should have these aggregated.
- How much new for-sale + rental construction is in the pipeline within 1–3 miles? Heavy new supply typically softens prices + rents 12–24 months out; constrained supply supports both.
Investment metrics
- 1% rule
- 0.87% ✗
- Cap rate
- 6.45%
- Cash-on-cash
- 0.57%
- DSCR
- 1.03
- GRM
- 9.6
CMA / ARV
- ARV (on-the-fly)
- $193,386
- Comps found
- 12
Show comp detail 12 sales within ~0.75 mi
| Address | Dist | Beds/Ba | Sqft | Sold | Price | $/sf | Match |
|---|---|---|---|---|---|---|---|
| 6442 Wellington St | 0.11mi | 3/1.0 | 1,158 (0%) | 0mo | $189,000 | $163 | 94 |
| 6447 Wellington St | 0.09mi | 3/1.0 | 1,158 (0%) | 2mo | $190,000 | $164 | 94 |
| 6519 Sorby Ct | 0.11mi | 3/1.0 | 1,158 (0%) | 8mo | $169,000 | $146 | 88 |
| 6423 Faraday Ct | 0.14mi | 3/1.0 | 1,158 (0%) | 8mo | $140,000 | $121 | 86 |
| 1442 E Tanners Creek Dr | 0.29mi | 3/1.5 | 1,248 (+8%) | 1mo | $126,500 | $101 | 71 |
| 6417 Edward St | 0.25mi | 3/2.0 | 1,248 (+8%) | 3mo | $217,000 | $174 | 69 |
| 6441 Edward St | 0.23mi | 3/2.0 | 1,248 (+8%) | 4mo | $235,000 | $188 | 68 |
| 6914 Bonnot Dr | 0.48mi | 3/1.5 | 1,188 (+3%) | 8mo | $220,000 | $185 | 65 |
| 1393 E Tanners Creek Dr | 0.30mi | 3/2.0 | 1,248 (+8%) | 7mo | $190,500 | $153 | 64 |
| 6981 E Tanners Creek Dr | 0.57mi | 3/1.5 | 1,188 (+3%) | 4mo | $225,000 | $189 | 63 |
| 1439 E Tanners Creek Dr | 0.35mi | 3/2.0 | 1,248 (+8%) | 8mo | $215,000 | $172 | 60 |
| 6433 Faraday Ct | 0.12mi | 4/1.5 (+1) | 1,320 (+14%) | 7mo | $220,500 | $167 | 59 |
Match score weights: distance 35% · size 25% · config 20% · recency 20%. Top-matched comps best support the ARV.
Projected returns pro-forma
-3.0% appreciation · 3.42% rent growth · sell at horizon
- IRR
- -14.9%
- Equity multiple
- 0.46×
- Total profit
- $-29,216
- Equity at exit
- $29,060
- IRR
- -5.6%
- Equity multiple
- 0.63×
- Total profit
- $-20,325
- Equity at exit
- $16,851
Cash invested: $54,572 (down + closing). Projections, not guarantees.
Landlord ↔ Tenant lean methodology
- Overall (STATE)
- 55 Moderately Landlord-Leaning
- State Virginia
- 55 Moderately Landlord-Leaning · D+2
- County
- — inherits STATE
- City
- — inherits STATE
ZIP-level market 23513
- Home prices YoY
- -9.3%
- Rents YoY
- 3.4%
- Active inventory
- 135
- Price-to-rent
- 9.6×
Monthly cashflow live
- Estimated rent
- $1,697 high interval (Pro) →
- Mortgage (P&I)
- −$1,022
- Tax from tax record
- −$176 /mo · $2,114/yr
- Insurance
- −$81
- HOA
- −$35
- Vacancy / Maint / Mgmt
- −$356
- Net cashflow
- $26
Break-even live
Sensitivity live
| Price | -10% $136 | -5% $81 | +0% $26 | +5% $-29 | +10% $-85 |
|---|---|---|---|---|---|
| Rent | -10% $-108 | -5% $-41 | +0% $26 | +5% $93 | +10% $160 |
| Rate | -1.0pp $124 | -0.5pp $75 | base $26 | +0.5pp $-25 | +1.0pp $-76 |
UW: 25.0% down · 7.5% · 30yr · 1.5% tax · 5.0% vac · 8.0% maint · 8.0% mgmt
Financing live
Cash to close
- Down payment
- $48,725
- Closing costs
- $5,847
- Reserves months
- —
- Total cash needed
- —
Loan-product check · same deal, 3 products live
Conventional
25% down · 7.5% · 30yr
- Down + closing
- —
- Monthly P&I
- —
- Monthly cashflow
- —
- DSCR
- —
- Eligible?
- —
Personal DTI + credit; lowest rate.
DSCR
20% down · 8.5% · 30yr
- Down + closing
- —
- Monthly P&I
- —
- Monthly cashflow
- —
- DSCR
- —
- Eligible?
- —
No personal income docs; deal must DSCR.
Hard money
10% down · 12.0% · 12mo
- Down + closing
- —
- Monthly P&I
- —
- Monthly cashflow
- —
- DSCR
- —
- Eligible?
- —
Short-term bridge; refi at stabilization.
Rent comps 40 comps
| Address | Beds | Baths | Sqft | Rent | $/sqft | DOM | Units | Dist |
|---|---|---|---|---|---|---|---|---|
| 6430 Faraday Ct Norfolk, VA | 4.0 | 1.5 | 1319 | $1,995 | $1.51 | 45d | 1 | 0.11mi |
| 6451 Edward St Norfolk, VA | 3.0 | 2.5 | 1400 | $2,000 | $1.43 | 9d | 1 | 0.23mi |
| 6343 Chesapeake Blvd Apt communities Norfolk, VA | 2.0 | 1.0 | 750 | $1,099 | $1.47 | 23d | 1 | 0.26mi |
| 6340 Sewells Point Rd Apt communities Norfolk, VA | 2.0 | 1.0 | 750 | $1,099 | $1.47 | 23d | 1 | 0.27mi |
| 6234 Chesapeake Blvd Norfolk, VA | 2.0 | 1.0 | 986 | $925 | $0.94 | 19d | 1 | 0.40mi |
| 6249 Alexander St Unit F Norfolk, VA | 2.0 | 1.0 | 817 | $1,195 | $1.46 | 6d | 1 | 0.40mi |
| 6249 Alexander St Unit C Norfolk, VA | 2.0 | 1.0 | 817 | $1,195 | $1.46 | 25d | 1 | 0.40mi |
| 6249 Alexander St Unit C Norfolk, VA | 2.0 | 1.0 | 817 | $1,195 | $1.46 | 19d | 1 | 0.40mi |
| 6228 Chesapeake Blvd Unit G Norfolk, VA | 2.0 | 1.0 | 885 | $925 | $1.05 | 45d | 1 | 0.42mi |
| 6241 Alexander St Unit F Norfolk, VA | 2.0 | 1.0 | 704 | $895 | $1.27 | 14d | 1 | 0.42mi |
| 6225 Alexander St Unit F Norfolk, VA | 2.0 | 1.0 | 750 | $1,499 | $2.00 | 22d | 1 | 0.45mi |
| 6225 Alexander St Norfolk, VA | 2.0 | 1.0 | 750 | $1,299 | $1.73 | 45d | 1 | 0.45mi |
| 6201 Geneva Way Unit B Norfolk, VA | 2.0 | 1.5 | 1200 | $1,500 | $1.25 | 45d | 1 | 0.49mi |
| 6450 Crescent Way Norfolk, VA | 1.0–3.0 | 1.0–2.0 | 1128 | $2,369 | $2.10 | 4d | 23 | 0.50mi |
| 1232 Norview Ave Unit NOR1232R-EA Norfolk, VA | 3.0 | 2.0 | 1106 | $1,600 | $1.45 | 45d | 1 | 0.56mi |
| 6975 Bonnot Dr Norfolk, VA | 3.0 | 1.5 | 1188 | $1,700 | $1.43 | 45d | 1 | 0.57mi |
| 7108 Gregory Dr Norfolk, VA | 2.0 | 1.0 | 720 | $1,400 | $1.94 | 45d | 1 | 0.73mi |
| 3820 Essex Cir Unit B 1 Norfolk, VA | 2.0 | 1.0 | 900 | $1,700 | $1.89 | 23d | 1 | 0.75mi |
| 3820 Essex Cir #1 Norfolk, VA | 2.0 | 1.0 | 1000 | $2,250 | $2.25 | 19d | 1 | 0.75mi |
| 3820 Essex Cir Unit A Norfolk, VA | 2.0 | 1.0 | 1000 | $2,200 | $2.20 | 23d | 1 | 0.75mi |
| 7128 Gregory Dr Norfolk, VA | 2.0 | 1.0 | 720 | $1,800 | $2.50 | 45d | 1 | 0.79mi |
| 3819 Pamlico Cir Norfolk, VA | 3.0 | 1.0 | 1250 | $2,000 | $1.60 | 14d | 1 | 0.80mi |
| 4802 Norvella Ave Unit 1 Norfolk, VA | 2.0 | 1.0 | 800 | $1,050 | $1.31 | 9d | 1 | 0.84mi |
| 6419 Grimes Ave Norfolk, VA | 3.0 | 2.0 | 1225 | $2,150 | $1.76 | 45d | 1 | 0.89mi |
| 837 Tifton St Norfolk, VA | 3.0 | 2.0 | 1072 | $2,300 | $2.15 | 25d | 1 | 0.95mi |
| 4566 Hampshire Ave Unit A Norfolk, VA | 2.0 | 1.0 | 870 | $1,350 | $1.55 | 45d | 1 | 1.00mi |
| 3872 Wake Cir Unit A Norfolk, VA | 2.0 | 1.0 | 750 | $1,395 | $1.86 | 5d | 1 | 1.02mi |
| 3872 Wake Cir Unit A Norfolk, VA | 2.0 | 1.0 | 750 | $1,395 | $1.86 | 45d | 1 | 1.02mi |
| 3801 Chatham Cir Unit 2 Norfolk, VA | 2.0 | 1.0 | 1100 | $1,350 | $1.23 | 9d | 1 | 1.06mi |
| 3305 Herbert St Norfolk, VA | 2.0 | 1.0 | 1215 | $1,750 | $1.44 | 14d | 1 | 1.10mi |
| 7427 Tyndale Ct Unit 1 Norfolk, VA | 2.0 | 1.0 | 786 | $995 | $1.27 | 45d | 1 | 1.17mi |
| 739 Waukesha Ave Norfolk, VA | 2.0 | 1.0 | 860 | $1,800 | $2.09 | 25d | 1 | 1.20mi |
| 715 Easy St Unit 2 Norfolk, VA | 2.0 | 1.0 | 750 | $1,200 | $1.60 | 16d | 1 | 1.22mi |
| 7433 Fenner St Norfolk, VA | 1.0–2.0 | 1.0 | 715 | $1,399 | $1.96 | 16d | 7 | 1.23mi |
| 7465 Fenner St Unit 7468-2-A8 Norfolk, VA | 2.0 | 1.0 | 900 | $1,399 | $1.55 | 22d | 1 | 1.25mi |
| 3461 Gamage Dr Norfolk, VA | 3.0 | 2.0 | 1300 | $2,300 | $1.77 | 45d | 1 | 1.27mi |
| 6115 Tidewater Dr Norfolk, VA | 1.0–2.0 | 1.0–2.0 | 956 | $2,274 | $2.38 | 4d | 8 | 1.27mi |
| 5404 Douglas St Norfolk, VA | 3.0 | 1.0 | 981 | $1,950 | $1.99 | 45d | 1 | 1.33mi |
| 609 Summers Dr Norfolk, VA | 3.0 | 1.0 | 998 | $1,995 | $2.00 | 6d | 1 | 1.35mi |
| 869 Bancker Rd Norfolk, VA | 2.0 | 1.0–1.5 | 910 | $1,142 | $1.26 | 45d | 1 | 1.36mi |
HOA detail
- Monthly dues
- $35 · $420/yr
Listing history 18 events
-
2026-06-07statusdays on market $194,900 Under Contract 9 DOM
-
2026-06-03days on market $194,900 Active 7 DOM
-
2026-06-02days on market $194,900 Active 6 DOM
-
2026-06-01days on market $194,900 Active 5 DOM
-
2026-05-31days on market $194,900 Active 4 DOM
-
2026-05-27$194,900 Active
-
2022-09-29soldstatus $160,000
-
2022-09-01status Under Contract
-
2022-09-01historical
-
2022-08-29historical Active Under Contract
-
2022-08-26$154,900 Active
-
2022-03-07historical
-
2022-02-23$104,900 Active
-
2022-02-17soldstatus $76,000
-
2022-02-08status Under Contract
-
2022-01-31historical Active Under Contract
-
2022-01-26$75,000 Active
-
1990-10-05soldstatus $39,400
ⓘ Source: listings_history table (triggers on properties + properties_extension) + one-shot
backfill from property_details.listing_events for pre-trigger history.
Tax reassessment forecast VA · Resets to sale price
- Current annual tax
- $2,114 · $176/mo
- Projected year-2 tax
- $2,114 · $176/mo
- Expected delta
- $0/yr ($0/mo · 0.0%)
ⓘ Screening estimate from a state-policy table — verify with the county assessor before closing.
Climate risk First Street
- Flood 1/10 Low FEMA zone X (unshaded) · 0% chance over 30 yrs
- Wildfire 1/10 Low
- Heat 9/10 Extreme 7 d/yr ≥105°F today · 16 d/yr by 30 yrs out
- Wind 8/10 Severe 80% chance of damaging wind over 30 yrs
- Air quality 3/10 Moderate 2 unhealthy d/yr today · 3 by 30 yrs out
Nearby sold comps map
Loading sold comps map…
Walkable amenities ~0.75 mi
Loading nearby amenities…
Taxation est. · year 1
- Rental income
- $20,358
- − Mortgage interest
- −$10,917
- − Property taxes
- −$2,114
- − Insurance
- −$974
- − Repairs & maintenance
- −$1,629
- − Management
- −$1,629
- − HOA
- −$420
- − Depreciation
- −$5,670
- Taxable loss
- −$2,995
- Est. tax savings @ 24.0%
- +$719
- After-tax cash flow
- $1,028/yr
For passive investors: Depreciation is non-cash, so a rental often shows a tax loss while cash-flowing — sheltering income. Rental losses are passive: they offset passive income freely, and up to $25,000/yr can offset ordinary (W-2) income if you actively participate and your MAGI is under $100k (phasing out to $0 by $150k); unused losses carry forward. On sale, claimed depreciation is recaptured at up to 25%, and gains may owe capital-gains tax (a 1031 exchange can defer both). Figures are a year-1 estimate at your 24.0% rate — not tax advice; consult a CPA.
Schools (NCES district)
- District
- Norfolk City Public School District
- NCES district ID
- 5102670
- Math proficiency
- 27% ▼ -44.00%
- Reading proficiency
- 56% ▼ -10.00%
- Median HH income
- $44,358
- Composite
- 35.08/100
- National rank
- #5026
- State rank
- #118 of 131 in VA
Livability — Norfolk
- Score
- 83/100
- State rank
- #43
- US rank
- #1026
Category grades
Schools grade is shown separately in the Schools card above.
Census & demographics
- Census place
- Norfolk, VA
- County
- Norfolk City · 214,042 people
- City population
- 214,042
- Metro
- Virginia Beach-Norfolk-Newport News, VA-NC
- Population (ZIP)
- 28,628
- Household income
- $68,380
- Rent vs Own
- Severe rent burden
- 1342.0
Population outlook (Norfolk County) Hauer SSP2
- Today (2025)
- 249,032 people
- By 2030
- 252,347 · +1.3%
- By 2040
- 253,644 · +1.9%
- By 2050
- 251,913 · +1.2%
- By 2075
- 245,281 · -1.5%
- By 2100
- 219,548 · -11.8%
Race, ethnicity, and origin ACS 2023
- Neighborhood character
- Diverse neighborhood (Simpson 0.63)
- Race & ethnicity
- Black 55% White 23% Hispanic / Latino 11% Two or more races 7% Asian 5%
- Hispanic origin (detail)
- Mexican 4% Puerto Rican 3%
- Common ancestry
- Romanian 1% Slovak 1% Lithuanian 0%
- Foreign-born
- 10% · Canada
- Languages at home
- 87% English-only · Spanish 6% Tagalog/Filipino 4% French/Haitian/Cajun 1%
Political lean MEDSL · Norfolk
- 2024 margin
- Solid D (+41.5) · D 70.0% · R 28.5% · Other 1.6%
- 2008→2024 swing
- -1.4pp toward R · 2008: 43.0pp · 2024: 41.5pp
- All cycles
- 2024: D+41.5 2020: D+45.6 2016: D+42.0 2012: D+44.0 2008: D+43.0
Not yet ingested
- Civics
- —
Market trends
- HPI YoY
- ▼ -33.67%
- Current HPI
- 329.2241
- Rent YoY
- ▲ 3.42%
- Metro
- Virginia Beach-Norfolk-Newport News, VA-NC
- State GDP YoY
- ▲ 2.40%
- F500 in state
- 50
Industry mix (Fortune 500 HQ in VA)
| Industry | F500 HQs | Revenue |
|---|---|---|
| Aerospace / Defense | 4 | $236B |
|
||
| Technology / Defense | 3 | $32B |
|
||
| Financial Services | 2 | $176B |
|
||
| Utilities | 2 | $27B |
|
||
| Insurance | 2 | $25B |
|
||
| Technology | 2 | $15B |
|
||
Price history
+394.7% since first listed13 events — show timeline
- 2026-05-27 Listed $194,900 REINMLS
- 2022-09-29 Sold (Public Records) $160,000 Public Records
- 2022-09-01 Pending — REINMLS
- 2022-09-01 Listing Removed — REINMLS
- 2022-08-29 Contingent — REINMLS
- 2022-08-26 Listed $154,900 REINMLS
- 2022-03-07 Listing Removed — REINMLS
- 2022-02-23 Listed $104,900 REINMLS
- 2022-02-17 Sold (Public Records) $76,000 Public Records
- 2022-02-08 Pending — REINMLS
- 2022-01-31 Contingent — REINMLS
- 2022-01-26 Listed $75,000 REINMLS
- 1990-10-05 Sold (Public Records) $39,400 Public Records
Property tax history
+6.4%/yrLatest (2025): $2,114 · +8.2% YoY. Source: county tax records.
Cash-flow waterfall
monthlySold comps — $/sqft
last 12 mo · ≤1 miLoading sold comps…