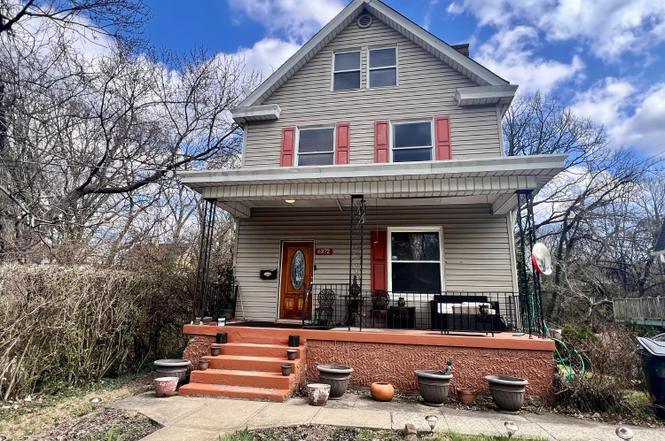
6372 Savannah · Cincinnati, OH
Flood risk 5/10 · Moderate
- FEMA flood zone
- X (unshaded)
- Chance of flooding over 30 yrs
- 0.66%
- Est. flood insurance / yr
- $473 – $860
Fire risk 1/10 · Minimal
- Est. fire insurance / yr
- $713 – $1,323
Heat risk 4/10 · Minor
- Hot days now (above 103°F)
- 7 days/yr
- Hot days in 30 yrs
- 19 days/yr
Wind risk 2/10 · Minimal
- Chance of severe wind over 30 yrs
- 1.0%
Air-quality risk 2/10 · Minimal
- Unhealthy air days now
- 1 days/yr
- Unhealthy air days in 30 yrs
- 1 days/yr
Risk factors via First Street. Map © Google.
Why this score? — see what drove the C+ grade
The composite is a weighted blend of 9 inputs, each scored 0–100. Each bar is that input's sub-score; the figure is the points it added to the 100-point composite (weight × sub-score).
- Cash flow +20.9/30.0
- ARV discount +15.0/15.0
- DSCR +6.7/10.0
- 1% rule +6.0/10.0
- Livability +4.0/5.0
- Rent growth +3.0/5.0
- Schools +2.5/10.0
- Condition / age +2.5/5.0
- Appreciation +0.0/10.0
$145,000
🖨 Deal sheet (PDF) 📄 Offer letter ✓ Due diligence
Listing remarks MLS
Fixer upper, good potential, need cash type buyer or investor loan for as is sale. Utilities will not be activated for inspections. Buyers must use seller title co & get free title policy unless previously approved by seller on contract.
Key facts
- Breakfast nook
- Large front porch
- Cathedral ceilings
Tags
Property features AI
Finance
- HOA & community: No HOA
Exterior
- Parking: Off-street parking
- Utilities: Public water; Public sewer; Natural gas
- Home design: Victorian-style single family home; Three or more levels; Poured foundation
- Construction: Aluminum siding; Shingle roof
- Exterior features: Walkout basement; Concrete basement floor; Unfinished basement; Glass block windows in basement; Other exterior features
Interior
- Kitchen: Pantry; Vinyl flooring; Wood cabinets; Microwave; Oven/Range; Refrigerator
- Bedrooms: 3 bedrooms total; Primary bedroom on level 2, approximately 12 x 11; Second bedroom on level 2, approximately 12 x 11; Third bedroom on level 2, approximately 11 x 10
- Flooring: Wood flooring in living room; Vinyl flooring in kitchen
- Bathrooms: One full bathroom (level 2); One half/partial bathroom (basement)
- Heating & cooling: Gas heating with hot water system; Window cooling unit(s); Gas water heater
- Interior features: 9 total rooms; 9-foot (or taller) ceilings; Attic storage
- Laundry & utility: Laundry room in basement, approximately 10 x 10
Neighborhood map
What this means for you Summary
Snapshot
- This is a 3-bed/2.0-bath single-family listed at $145k.
Deal economics
- At list price, monthly cash flow is $203 ($2k/yr) — positive.
- The deal already cash-flows at list — no discount required.
- Meets the 1% rule at list price ($2k rent vs $145k).
- Recommended offer: $132k (9.0% below list) — sets the bar for market timing.
- Cap rate 8.0% vs local median 3.9% in Cincinnati — top-decile yield for the area; either an underpriced asset or a hidden risk that comps aren't pricing in. Stress-test before assuming the spread holds.
Location & tenants
- Location reads 80/100 on livability (#130 in OH, #1,856 nationally) — a professional / high-income tenant draw. Strengths: amenities A+, commute A+, cost of living A+; Watch: employment D, crime F.
- Cincinnati Public Schools (urban): math 25% / reading 36% proficiency, ranked #581 of 656 in OH (top 89%) — families likely to look elsewhere, expect single-tenant / working-renter base with shorter leases; 70% free/reduced lunch — lower-income household profile, screen leases tightly.
- Market conditions: Rents rising (+1.8%/yr); 49 active listings in the ZIP; 20 comparable units currently listed for rent nearby; rentals at typical pace (median 17d on market — plan ~3-4 weeks tenant-placement turnaround); 801 units permitted in Hamilton County in 2024 (190 in 5+ unit buildings).
- This rent runs 34% of the median local income ($56k/yr) — at the standard rent-burdened threshold; future hikes will face affordability resistance.
Forward outlook
- Local home prices are declining (-3.0%/yr); year-one equity from $1k of loan paydown is wiped out by about $4k of value loss. Plan a longer hold.
Negotiation context
- It's been on market 100 days — a 9% lower offer ($132k) is reasonable based on typical stale-listing flexibility.
- 4 sale attempts since 21y ago; this cycle's ask has dropped $50k (26%) from the opening price — seller is motivated, your offer sets the floor, not the list.
- Current owner paid $80k; list at $145k implies a 81% gain — meaningful room to come down on a strong offer.
Risks & watch-outs
- Watch-outs: built in 1910 — expect roof / HVAC / electrical / plumbing capex.
- Climate carrying-cost: moderate flood risk — expect insurance premiums to compound above CPI over the hold.
Questions for the listing agent
- It's been on market 100 days. Have you received any prior offers? Is the seller open to a 9% concession, seller financing, or rate buy-down credit?
- Built in 1910 — when were the roof, HVAC, electrical panel, plumbing, and water heater last replaced?
- Why hasn't it sold? Are there any deal-killer items the seller is aware of (foundation, flood, title, zoning, code violations)?
- Is there a deadline driving the sale (1031 exchange, divorce, estate, relocation)? That informs how much negotiation room exists.
- Schools are B-rated — typically a magnet for longer-tenancy family renters. What's the average tenant stay here, and is there a school-zone premium baked into asking?
- Crime grade is F in this area — have there been break-ins, vandalism, or insurance claims at this property in the last 3 years? What carrier currently insures it and at what premium?
- What's the average days-on-market for RENTAL listings here right now (not sales)? A rising rental-DOM trend means longer vacancies and softer asking-rent achievability than the comps imply.
- What's the recent tenant-quality profile in this submarket — average credit score on applications, eviction rate, late-payment / NSF rate, and stable-employment percentage? A property-management company in the area should have these aggregated.
- How much new for-sale + rental construction is in the pipeline within 1–3 miles? Heavy new supply typically softens prices + rents 12–24 months out; constrained supply supports both.
Investment metrics
- 1% rule
- 1.10% ✓
- Cap rate
- 7.97%
- Cash-on-cash
- 5.99%
- DSCR
- 1.27
- GRM
- 7.6
CMA / ARV
- ARV (on-the-fly)
- $236,052
- Comps found
- 12
Show comp detail 12 sales within ~0.75 mi
| Address | Dist | Beds/Ba | Sqft | Sold | Price | $/sf | Match |
|---|---|---|---|---|---|---|---|
| 6537 Meis Ave | 0.34mi | 2/1.5 (-1) | 1,469 (+3%) | 0mo | $205,000 | $140 | 71 |
| 1708 De Armand Ave | 0.46mi | 2/1.0 (-1) | 1,415 (-0%) | 2mo | $222,500 | $157 | 67 |
| 1565 Reid Ave | 0.47mi | 2/1.5 (-1) | 1,369 (-4%) | 3mo | $269,000 | $196 | 62 |
| 1472 Larrywood Ln | 0.68mi | 4/1.5 (+1) | 1,426 (+0%) | 0mo | $220,000 | $154 | 61 |
| 1387 Teakwood Ave | 0.72mi | 4/2.0 (+1) | 1,405 (-1%) | 2mo | $270,000 | $192 | 58 |
| 2268 Deblin Dr | 0.71mi | 4/2.0 (+1) | 1,443 (+2%) | 3mo | $240,000 | $166 | 57 |
| 6623 Betts Ave | 0.39mi | 3/1.0 | 1,242 (-13%) | 0mo | $140,000 | $113 | 56 |
| 1568 Wittekind Ter | 0.43mi | 3/2.5 | 1,600 (+12%) | 2mo | $415,000 | $259 | 56 |
| 1961 Connecticut Ave | 0.64mi | 4/2.0 (+1) | 1,332 (-6%) | 3mo | $250,000 | $188 | 52 |
| 6078 Oakwood Ave | 0.43mi | 2/1.5 (-1) | 1,266 (-11%) | 3mo | $275,000 | $217 | 52 |
| 6916 Noble Ave | 0.73mi | 2/2.5 (-1) | 1,366 (-4%) | 2mo | $180,000 | $132 | 51 |
| 2037 Carpenter | 0.74mi | 4/2.0 (+1) | 1,544 (+9%) | 2mo | $230,000 | $149 | 44 |
Match score weights: distance 35% · size 25% · config 20% · recency 20%. Top-matched comps best support the ARV.
Projected returns pro-forma
-3.0% appreciation · 1.82% rent growth · sell at horizon
- IRR
- -8.4%
- Equity multiple
- 0.69×
- Total profit
- $-12,399
- Equity at exit
- $21,620
- IRR
- -0.5%
- Equity multiple
- 0.96×
- Total profit
- $-1,431
- Equity at exit
- $12,537
Cash invested: $40,600 (down + closing). Projections, not guarantees.
Landlord ↔ Tenant lean methodology
- Overall (STATE)
- 73 Landlord-Friendly
- State Ohio
- 73 Landlord-Friendly · R+6
- County
- — inherits STATE
- City
- — inherits STATE
ZIP-level market 45224
- Rents YoY
- 1.8%
- Active inventory
- 49
- Price-to-rent
- 7.6×
Monthly cashflow live
- Estimated rent
- $1,592 high interval (Pro) →
- Mortgage (P&I)
- −$760
- Tax from tax record
- −$234 /mo · $2,810/yr
- Insurance
- −$60
- HOA
- −$0
- Vacancy / Maint / Mgmt
- −$334
- Net cashflow
- $203
Break-even live
Sensitivity live
| Price | -10% $285 | -5% $244 | +0% $203 | +5% $162 | +10% $121 |
|---|---|---|---|---|---|
| Rent | -10% $77 | -5% $140 | +0% $203 | +5% $266 | +10% $328 |
| Rate | -1.0pp $276 | -0.5pp $240 | base $203 | +0.5pp $165 | +1.0pp $127 |
UW: 25.0% down · 7.5% · 30yr · 1.5% tax · 5.0% vac · 8.0% maint · 8.0% mgmt
Financing live
Cash to close
- Down payment
- $36,250
- Closing costs
- $4,350
- Reserves months
- —
- Total cash needed
- —
Loan-product check · same deal, 3 products live
Conventional
25% down · 7.5% · 30yr
- Down + closing
- —
- Monthly P&I
- —
- Monthly cashflow
- —
- DSCR
- —
- Eligible?
- —
Personal DTI + credit; lowest rate.
DSCR
20% down · 8.5% · 30yr
- Down + closing
- —
- Monthly P&I
- —
- Monthly cashflow
- —
- DSCR
- —
- Eligible?
- —
No personal income docs; deal must DSCR.
Hard money
10% down · 12.0% · 12mo
- Down + closing
- —
- Monthly P&I
- —
- Monthly cashflow
- —
- DSCR
- —
- Eligible?
- —
Short-term bridge; refi at stabilization.
Rent comps 20 comps
| Address | Beds | Baths | Sqft | Rent | $/sqft | DOM | Units | Dist |
|---|---|---|---|---|---|---|---|---|
| 1804 Waltham Ave Cincinnati, OH | 2.0 | 1.0 | 1186 | $1,425 | $1.20 | 8d | 1 | 0.24mi |
| 1834 Emerson Ave Cincinnati, OH | 2.0 | 1.0 | 1187 | $1,500 | $1.26 | 24d | 1 | 0.24mi |
| 1720 W North Bend Rd Cincinnati, OH | 3.0 | 1.0 | 900 | $1,400 | $1.56 | 24d | 1 | 0.41mi |
| 6211 Hamilton Ave Cincinnati, OH | 2.0 | 1.0–2.0 | 842 | $1,968 | $2.34 | 2d | 17 | 0.50mi |
| 6834 Betts Ave Cincinnati, OH | 4.0 | 1.5 | 1426 | $1,695 | $1.19 | 24d | 1 | 0.59mi |
| 1837 W Galbraith Rd Cincinnati, OH | 2.0 | 2.0 | 1087 | $1,500 | $1.38 | 24d | 1 | 0.64mi |
| 1604 W Galbraith Rd Unit F North College Hill, OH | 2.0 | 1.0 | 1250 | $1,150 | $0.92 | 15d | 1 | 0.66mi |
| 5928 Belmont Ave Unit Washer Dryer Hookup Cincinnati, OH | 3.0 | 1.0 | 1120 | $1,395 | $1.25 | 17d | 1 | 0.67mi |
| 5910 Belmont Ave Unit 3 Cincinnati, OH | 2.0 | 1.0 | 900 | $995 | $1.11 | 5d | 1 | 0.70mi |
| 1740 Bising Ave North College Hill, OH | 3.0 | 2.0 | 1235 | $1,697 | $1.37 | 2d | 6 | 0.83mi |
| 7032 La Boiteaux Ave Cincinnati, OH | 4.0 | 1.0 | 1200 | $1,800 | $1.50 | 24d | 1 | 0.90mi |
| 1409 Cedar Ave Cincinnati, OH | 3.0 | 1.0 | 1248 | $1,525 | $1.22 | 5d | 1 | 0.97mi |
| 1628 Linden Dr Unit 937 Cincinnati, OH | 2.0 | 1.0 | 950 | $1,163 | $1.22 | 24d | 1 | 0.97mi |
| 2512 Rack Ct Unit 3 Cincinnati, OH | 2.0 | 1.0 | 900 | $1,125 | $1.25 | 24d | 1 | 1.19mi |
| 1667 Lakenoll Dr Mt Healthy, OH | 1.0–2.0 | 1.0–1.5 | 817 | $1,385 | $1.69 | 4d | 7 | 1.27mi |
| 5843 Monfort Hills Ave Cincinnati, OH | 2.0 | 1.0 | 1820 | $1,200 | $0.66 | 24d | 1 | 1.28mi |
| 1104 Archland Dr Cincinnati, OH | 3.0 | 2.0 | 1533 | $2,036 | $1.33 | 8d | 1 | 1.29mi |
| 5406 Scarletoak Dr Cincinnati, OH | 2.0 | 2.0 | 1508 | $2,400 | $1.59 | 4d | 1 | 1.30mi |
| 5824 Shadymist Ln Unit 3 Cincinnati, OH | 2.0 | 1.0 | 875 | $1,100 | $1.26 | 24d | 1 | 1.39mi |
| 1017 W North Bend Rd Cincinnati, OH | 4.0 | 2.0 | 1450 | $1,951 | $1.35 | 13d | 1 | 1.46mi |
Listing history 28 events
-
2026-06-21days on market $145,000 Active 100 DOM
-
2026-06-18days on market $145,000 Active 97 DOM
-
2026-06-17days on market $145,000 Active 96 DOM
-
2026-06-16days on market $145,000 Active 95 DOM
-
2026-06-15days on market $145,000 Active 94 DOM
-
2026-06-13days on market $145,000 Active 92 DOM
-
2026-06-13days on market $145,000 Active 91 DOM
-
2026-06-09pricedays on market $145,000 Active 88 DOM
-
2026-06-08days on market $160,000 Active 87 DOM
-
2026-06-07days on market $160,000 Active 86 DOM
-
2026-06-03days on market $160,000 Active 82 DOM
-
2026-06-02days on market $160,000 Active 81 DOM
-
2026-06-01days on market $160,000 Active 80 DOM
-
2026-05-31days on market $160,000 Active 79 DOM
-
2026-05-22price $160,000
-
2026-05-09status Active
-
2026-05-04historical Contingency Pending
-
2026-03-13price $175,000
-
2026-03-13$195,000 Active
-
2008-09-08soldstatus $80,000
-
2006-10-10soldstatus $38,900
-
2006-09-13soldstatus $38,000 241-char remark
Show marketing remark (241 chars)
Fixer upper, good potential, need cash type buyer or investor loan for as is sale. Utilities will not be activated for inspections. Buyers must use seller title co & get free title policy unless previously approved by seller on contract.
-
2006-08-01$41,900 241-char remark
Show marketing remark (241 chars)
Fixer upper, good potential, need cash type buyer or investor loan for as is sale. Utilities will not be activated for inspections. Buyers must use seller title co & get free title policy unless previously approved by seller on contract.
-
2006-04-13historical
-
2005-07-08$56,900
-
1995-12-26soldstatus $78,200
-
1993-08-17soldstatus $74,500
-
1985-04-01soldstatus $39,900
ⓘ Source: listings_history table (triggers on properties + properties_extension) + one-shot
backfill from property_details.listing_events for pre-trigger history.
Tax reassessment forecast OH · Partial reset (capped growth)
- Current annual tax
- $2,810 · $234/mo
- Projected year-2 tax
- $2,810 · $234/mo
- Expected delta
- $0/yr ($0/mo · 0.0%)
ⓘ Screening estimate from a state-policy table — verify with the county assessor before closing.
Climate risk First Street
- Flood 5/10 Major FEMA zone X (unshaded) · 66% chance over 30 yrs
- Wildfire 1/10 Low
- Heat 4/10 Moderate 7 d/yr ≥103°F today · 19 d/yr by 30 yrs out
- Wind 2/10 Low 100% chance of damaging wind over 30 yrs
- Air quality 2/10 Low 1 unhealthy d/yr today · 1 by 30 yrs out
Nearby sold comps map
Loading sold comps map…
Walkable amenities ~0.75 mi
Loading nearby amenities…
Taxation est. · year 1
- Rental income
- $19,104
- − Mortgage interest
- −$8,122
- − Property taxes
- −$2,810
- − Insurance
- −$725
- − Repairs & maintenance
- −$1,528
- − Management
- −$1,528
- − Depreciation
- −$4,218
- Taxable income
- $172
- Est. tax owed @ 24.0%
- −$41
- After-tax cash flow
- $2,391/yr
For passive investors: Depreciation is non-cash, so a rental often shows a tax loss while cash-flowing — sheltering income. Rental losses are passive: they offset passive income freely, and up to $25,000/yr can offset ordinary (W-2) income if you actively participate and your MAGI is under $100k (phasing out to $0 by $150k); unused losses carry forward. On sale, claimed depreciation is recaptured at up to 25%, and gains may owe capital-gains tax (a 1031 exchange can defer both). Figures are a year-1 estimate at your 24.0% rate — not tax advice; consult a CPA.
Schools (NCES district)
- District
- Cincinnati Public Schools
- NCES district ID
- 3904375
- Math proficiency
- 25% ▼ -19.00%
- Reading proficiency
- 36% ▼ -14.00%
- Median HH income
- $35,743
- Composite
- 25.21/100
- National rank
- #7508
- State rank
- #581 of 656 in OH
Livability — Cincinnati
- Score
- 80/100
- State rank
- #130
- US rank
- #1856
Category grades
Schools grade is shown separately in the Schools card above.
Census & demographics
- Census place
- Cincinnati, OH
- County
- Hamilton County · 701,295 people
- City population
- 505,555
- Metro
- Cincinnati, OH-KY-IN
- Population (ZIP)
- 21,900
- Household income
- $56,471
- Rent vs Own
- Severe rent burden
- 1382.0
Population outlook (Hamilton County) Hauer SSP2
- Today (2025)
- 826,054 people
- By 2030
- 830,947 · +0.6%
- By 2040
- 832,319 · +0.8%
- By 2050
- 822,428 · -0.4%
- By 2075
- 788,688 · -4.5%
- By 2100
- 710,674 · -14.0%
Race, ethnicity, and origin ACS 2023
- Neighborhood character
- Diverse neighborhood (Simpson 0.60)
- Race & ethnicity
- Black 51% White 37% Two or more races 6% Hispanic / Latino 5%
- Common ancestry
- Lithuanian 2% Italian 2% Slovak 1%
- Foreign-born
- 5% · Canada
- Languages at home
- 95% English-only · Spanish 3%
Political lean MEDSL · Hamilton
- 2024 margin
- D (+14.9) · D 57.0% · R 42.1%
- 2008→2024 swing
- +7.9pp toward D · 2008: 7.0pp · 2024: 14.9pp
- All cycles
- 2024: D+14.9 2020: D+15.9 2016: D+9.5 2012: D+4.9 2008: D+7.0
Not yet ingested
- Civics
- —
Market trends
- HPI YoY
- ▼ -148.06%
- Current HPI
- 224.1379
- Rent YoY
- ▲ 1.82%
- Metro
- Cincinnati, OH-KY-IN
- State GDP YoY
- ▲ 1.98%
- F500 in state
- 48
Industry mix (Fortune 500 HQ in OH)
| Industry | F500 HQs | Revenue |
|---|---|---|
| Insurance | 3 | $145B |
|
||
| Industrial Machinery | 3 | $49B |
|
||
| Financial Services | 3 | $24B |
|
||
| Consumer Goods | 2 | $93B |
|
||
| Aerospace / Defense | 2 | $47B |
|
||
| Utilities | 2 | $33B |
|
||
Price history
+301.0% since first listed14 events — show timeline
- 2026-05-22 Price Changed $160,000 Cincy MLS
- 2026-05-09 Relisted — Cincy MLS
- 2026-05-04 Contingent — Cincy MLS
- 2026-03-13 Price Changed $175,000 Cincy MLS
- 2026-03-13 Listed $195,000 Cincy MLS
- 2008-09-08 Sold (Public Records) $80,000 Public Records
- 2006-10-10 Sold (Public Records) $38,900 Public Records
- 2006-09-13 Sold (MLS) $38,000 Cincy MLS
- 2006-08-01 Listed $41,900 Cincy MLS
- 2006-04-13 Listing Removed — Cincy MLS
- 2005-07-08 Listed $56,900 Cincy MLS
- 1995-12-26 Sold (Public Records) $78,200 Public Records
- 1993-08-17 Sold (Public Records) $74,500 Public Records
- 1985-04-01 Sold (Public Records) $39,900 Public Records
Property tax history
+5.1%/yrLatest (2025): $2,810 · +3.1% YoY. Source: county tax records.
Cash-flow waterfall
monthlySold comps — $/sqft
last 12 mo · ≤1 miLoading sold comps…