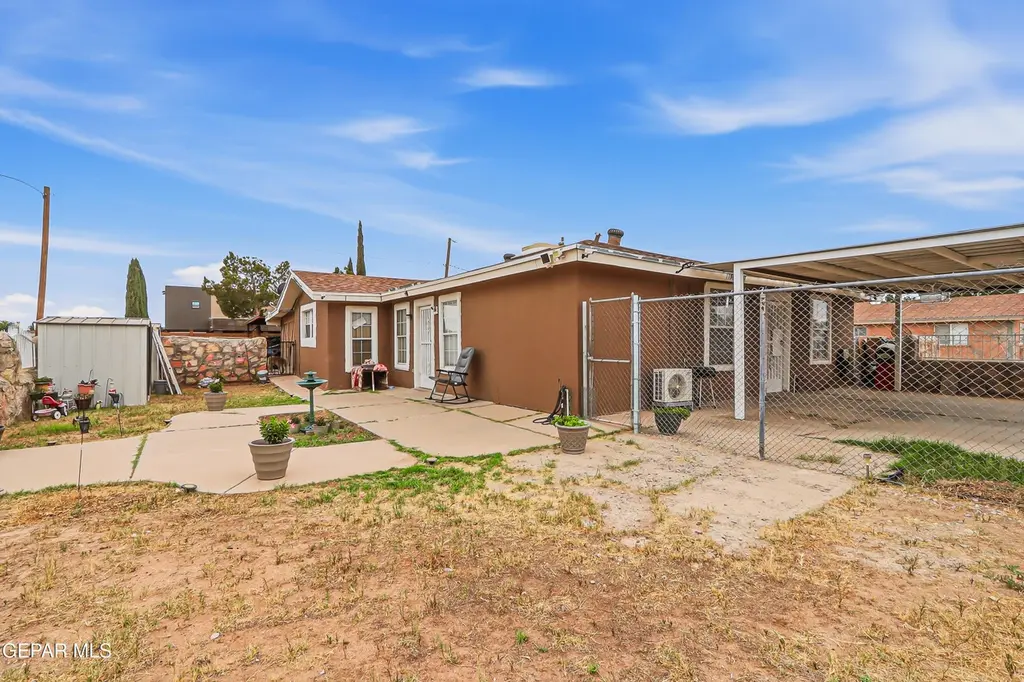
 Triplex
11548 Jenny Rd · Socorro, TX
Flood risk 1/10 · Minimal
- FEMA flood zone
- —
- Chance of flooding over 30 yrs
- 0.0%
- Est. flood insurance / yr
- —
Fire risk 1/10 · Minimal
- Est. fire insurance / yr
- $1,222 – $2,270
Heat risk 6/10 · Moderate
- Hot days now (above 101°F)
- 7 days/yr
- Hot days in 30 yrs
- 25 days/yr
Wind risk 1/10 · Minimal
- Chance of severe wind over 30 yrs
- —
Air-quality risk 2/10 · Minimal
- Unhealthy air days now
- 0 days/yr
- Unhealthy air days in 30 yrs
- 1 days/yr
Risk factors via First Street. Map © Google.
Why this score? — see what drove the B grade
The composite is a weighted blend of 9 inputs, each scored 0–100. Each bar is that input's sub-score; the figure is the points it added to the 100-point composite (weight × sub-score).
- Cash flow +30.0/30.0
- 1% rule +10.0/10.0
- DSCR +10.0/10.0
- ARV discount +7.5/15.0
- Appreciation +4.5/10.0
- Rent growth +3.8/5.0
- Livability +3.2/5.0
- Schools +2.6/10.0
- Condition / age +2.5/5.0
$220,000
🖨 Deal sheet 📄 Offer letter ✓ Due diligence
Multi-family units
County records classify this as Multi-Family (2-4 Unit). Listing-text estimate: 3 units. confirmed
Listing remarks
Investment opportunity with endless potential!This unique triplex sits on a spacious corner lot and offers three separate living spaces, making it ideal for rental income, multi-generational living, or an owner-occupant looking to offset their mortgage. The property features ample parking, covered carport areas, and a walled perimeter for added privacy. Conveniently located with easy access to main roads, shopping, dining, and schools. Space #1 offers a great studio area with kitchen and restroom. Space #2 offers 2 bedrooms and 1 bathroom. Space #3 has 1 bedroom and 1 bathroom. All with great space indoor and out.
Key facts
- Ample parking
- Walled perimeter
- Triplex
Tags
Property features AI
Finance
- Other: No special listing conditions
Exterior
- Parking: Covered parking
- Utilities: All utilities available; Electric available; Natural gas available
- Home design: Triplex; Total building area approximately 2060
- Construction: Stucco construction; Shingle roof
- Exterior features: Shingle roof; Stucco exterior; Lot about 0.12 acres
Interior
- Kitchen: Refrigerator; Range hood; Microwave; Free-standing gas oven
- Flooring: Tile; Vinyl
- Heating & cooling: Refrigerated cooling; Heating details listed in remarks
- Interior features: Tile and vinyl flooring; See remarks for heating details
- Laundry & utility: Washer hookup
Neighborhood map
What this means for you Summary
Snapshot
- This is a 2×1bd/1ba + 1×2bd/1ba units multifamily listed at $220k.
Deal economics
- At list price, monthly cash flow is $966 ($12k/yr) — positive. Per door: $322/mo.
- The deal already cash-flows at list — no discount required.
- Meets the 1% rule at list price ($3k rent vs $220k).
- Recommended offer: $217k (1.5% below list) — sets the bar for market timing.
Location & tenants
- Location reads 63/100 on livability (#830 in TX) — a middle-class / working-renter tenant base. Strengths: crime A+, cost of living A+, housing A+; Watch: amenities F, commute F, employment F.
- Socorro ISD (urban): math 23% / reading 36% proficiency, ranked #624 of 826 in TX (top 76%) — low school quality limits family demand, transient renter base, plan for 1-2y turnover; 66% free/reduced lunch — lower-income household profile, screen leases tightly.
- Zoned schools: Campestre El (math 17% / reading 27%, grade F, #3,333 of 4,322 statewide, top 80%, 495 students, 91% FRL); Socorro Middle (math 14% / reading 27%, grade F, #1,407 of 1,662 statewide, top 86%, 540 students, 92% FRL); Socorro H S (math 13% / reading 35%, grade F, #1,333 of 1,632 statewide, top 82%, 2,484 students, 87% FRL) — zoned schools average 90% FRL vs 66% district-wide (24 pts higher); higher-poverty schools than district average — tighter screening recommended.
- Market conditions: Rents rising fast (+5.3%/yr); 219 active listings in the ZIP; 2,196 units permitted in El Paso County in 2024 (143 in 5+ unit buildings).
- At $3,430/mo this rent would consume 77% of the median local household income ($54k/yr) (locally 732% of renters already pay >50% of income on rent) — very limited rent-growth headroom before tenants either downsize or default.
Forward outlook
- Local home prices are declining (-0.9%/yr); year-one equity from $2k of loan paydown is wiped out by about $2k of value loss. Plan a longer hold.
- El Paso County population projected at +10% by 2050 — modest demand growth; plan on rents tracking national, not racing it.
- At projected returns (-0.9% appreciation + 5.3% rent growth), your $62k cash investment doubles in ~5 years — after that, you're playing with house money.
Negotiation context
- It's been on market 28 days — a 2% lower offer ($217k) is reasonable based on typical stale-listing flexibility.
- 8 sale attempts since 12y ago with the ask held roughly flat each time — persistent listings suggest the price (not the market) is what's stuck; bring a comps-based counter.
Risks & watch-outs
- Watch-outs: property tax is 2.7% of price.
- Climate carrying-cost: extreme-heat days projected 7→25/yr by 2055 (HVAC capex compounding) — expect insurance premiums to compound above CPI over the hold.
Questions for the listing agent
- Can we see the unit-by-unit rent roll, current vacancy, and any below-market leases? What's the average tenancy length?
- What capital expenditures (roof, boiler, parking lot, exteriors) have been made in the last 5 years, and what's planned in the next 2?
- Property tax is high relative to price — has the assessment been appealed recently, and will the sale trigger a re-assessment?
- Is there a deadline driving the sale (1031 exchange, divorce, estate, relocation)? That informs how much negotiation room exists.
- Schools are F-rated, which usually means shorter tenancies and higher turnover. Who's the typical renter profile here, and what's been the actual vacancy rate?
- What's the average days-on-market for RENTAL listings here right now (not sales)? A rising rental-DOM trend means longer vacancies and softer asking-rent achievability than the comps imply.
- What's the recent tenant-quality profile in this submarket — average credit score on applications, eviction rate, late-payment / NSF rate, and stable-employment percentage? A property-management company in the area should have these aggregated.
- How much new apartment / multifamily construction is in the pipeline within 1–3 miles? Heavy new supply (>2% of stock underway) typically softens rents 12–24 months out; light construction supports rent growth.
Investment metrics
- 1% rule
- 1.56% ✓
- Cap rate
- 11.56%
- Cash-on-cash
- 18.81%
- DSCR
- 1.84
- GRM
- 5.3
CMA / ARV
No comps found within radius.
Projected returns pro-forma
-0.93% appreciation · 5.29% rent growth · sell at horizon
- IRR
- 18.6%
- Equity multiple
- 1.87×
- Total profit
- $53,875
- Equity at exit
- $53,807
- IRR
- 25.8%
- Equity multiple
- 3.93×
- Total profit
- $180,249
- Equity at exit
- $57,101
Cash invested: $61,600 (down + closing). Projections, not guarantees.
Landlord ↔ Tenant lean methodology
- Overall (STATE)
- 87 Strongly Landlord-Friendly
- State Texas
- 87 Strongly Landlord-Friendly · R+5
- County
- — inherits STATE
- City
- — inherits STATE
ZIP-level market 79927
- Home prices YoY
- -0.4%
- Rents YoY
- 5.3%
- Active inventory
- 219
- Price-to-rent
- 18.3×
Monthly cashflow live
- Estimated rent
- $3,430 medium interval (Pro) →
- Mortgage (P&I)
- −$1,154
- Tax from tax record
- −$499 /mo · $5,983/yr
- Insurance
- −$92
- HOA
- −$0
- Vacancy / Maint / Mgmt
- −$720
- Net cashflow
- $966
Break-even live
3-unit breakdown (identical units grouped — click to expand)
| Units | Beds | Baths | Est. rent |
|---|---|---|---|
| 2× units | 1 | 1 | $1,998 |
| #1 | 1 | 1 | $999 |
| #3 | 1 | 1 | $999 |
| 1× unit | 2 | 1 | $1,432 |
| Total (3 units) | $3,430 | ||
UW: 25.0% down · 7.5% · 30yr · 1.5% tax · 5.0% vac · 8.0% maint · 8.0% mgmt
Financing live
Cash to close
- Down payment
- $55,000
- Closing costs
- $6,600
- Reserves months
- —
- Total cash needed
- —
Loan-product check · same deal, 3 products live
Conventional
25% down · 7.5% · 30yr
- Down + closing
- —
- Monthly P&I
- —
- Monthly cashflow
- —
- DSCR
- —
- Eligible?
- —
Personal DTI + credit; lowest rate.
DSCR
20% down · 8.5% · 30yr
- Down + closing
- —
- Monthly P&I
- —
- Monthly cashflow
- —
- DSCR
- —
- Eligible?
- —
No personal income docs; deal must DSCR.
Hard money
10% down · 12.0% · 12mo
- Down + closing
- —
- Monthly P&I
- —
- Monthly cashflow
- —
- DSCR
- —
- Eligible?
- —
Short-term bridge; refi at stabilization.
Listing history 39 events
-
2026-06-18days on market $220,000 Active 28 DOM
-
2026-06-17days on market $220,000 Active 27 DOM
-
2026-06-16days on market $220,000 Active 26 DOM
-
2026-06-15days on market $220,000 Active 25 DOM
-
2026-06-13days on market $220,000 Active 23 DOM
-
2026-06-10days on market $220,000 Active 20 DOM
-
2026-06-09days on market $220,000 Active 19 DOM
-
2026-06-08days on market $220,000 Active 18 DOM
-
2026-06-07days on market $220,000 Active 17 DOM
-
2026-06-05days on market $220,000 Active 14 DOM
-
2026-06-03days on market $220,000 Active 13 DOM
-
2026-06-03days on market $220,000 Active 12 DOM
-
2026-06-01days on market $220,000 Active 11 DOM
-
2026-05-31days on market $220,000 Active 10 DOM
-
2026-05-13$220,000 Active
-
2024-08-27historical
-
2024-08-23price $205,000
-
2024-08-19price $224,777
-
2024-08-16price $225,000
-
2024-07-30price $227,995
-
2024-07-17price $229,997
-
2024-06-25price $230,000
-
2024-06-13$235,000 Active
-
2023-12-27soldstatus
-
2023-12-03historical $700
-
2023-11-30$700
-
2023-11-23historical $700
-
2023-11-23$700
-
2023-04-17soldstatus
-
2023-02-21status Pending
-
2022-11-29$165,000 Active
-
2018-05-31historical
-
2017-11-09price $99,995
-
2017-09-29status Pending Accept Offers
-
2017-09-06status Pending
-
2017-05-16$105,000 Active
-
2015-02-17soldstatus
-
2014-08-19$88,950
-
1987-04-23soldstatus
ⓘ Source: listings_history table (triggers on properties + properties_extension) + one-shot
backfill from property_details.listing_events for pre-trigger history.
Tax reassessment forecast TX · Resets to sale price
- Current annual tax
- $5,983 · $499/mo
- Projected year-2 tax
- $5,983 · $499/mo
- Expected delta
- $0/yr ($0/mo · 0.0%)
ⓘ Screening estimate from a state-policy table — verify with the county assessor before closing.
Climate risk First Street
- Flood 1/10 Low 0% chance over 30 yrs
- Wildfire 1/10 Low
- Heat 6/10 Major 7 d/yr ≥101°F today · 25 d/yr by 30 yrs out
- Wind 1/10 Low
- Air quality 2/10 Low 0 unhealthy d/yr today · 1 by 30 yrs out
Nearby sold comps map
Loading sold comps map…
Walkable amenities ~0.75 mi
Loading nearby amenities…
Taxation est. · year 1
- Rental income
- $41,160
- − Mortgage interest
- −$12,323
- − Property taxes
- −$5,983
- − Insurance
- −$1,100
- − Repairs & maintenance
- −$3,293
- − Management
- −$3,293
- − Depreciation
- −$6,400
- Taxable income
- $8,768
- Est. tax owed @ 24.0%
- −$2,104
- After-tax cash flow
- $9,485/yr
For passive investors: Depreciation is non-cash, so a rental often shows a tax loss while cash-flowing — sheltering income. Rental losses are passive: they offset passive income freely, and up to $25,000/yr can offset ordinary (W-2) income if you actively participate and your MAGI is under $100k (phasing out to $0 by $150k); unused losses carry forward. On sale, claimed depreciation is recaptured at up to 25%, and gains may owe capital-gains tax (a 1031 exchange can defer both). Figures are a year-1 estimate at your 24.0% rate — not tax advice; consult a CPA.
Schools (NCES district)
- District
- Socorro ISD
- NCES district ID
- 4840710
- Math proficiency
- 23% ▼ -34.00%
- Reading proficiency
- 36% ▼ -14.00%
- Median HH income
- $49,318
- Composite
- 25.67/100
- National rank
- #7396
- State rank
- #624 of 826 in TX
Livability — Socorro
- Score
- 63/100
- State rank
- #830
- US rank
- #14960
Category grades
Schools grade is shown separately in the Schools card above.
Census & demographics
- Census place
- Socorro, TX
- County
- El Paso County · 761,266 people
- City population
- 44,444
- Metro
- El Paso, TX
- Population (ZIP)
- 44,444
- Household income
- $53,652
- Rent vs Own
- Severe rent burden
- 732.0
Population outlook (El Paso County) Hauer SSP2
- Today (2025)
- 897,899 people
- By 2030
- 922,694 · +2.8%
- By 2040
- 960,492 · +7.0%
- By 2050
- 982,919 · +9.5%
- By 2075
- 997,266 · +11.1%
- By 2100
- 900,630 · +0.3%
Race, ethnicity, and origin ACS 2023
- Neighborhood character
- Predominantly Hispanic (97%)
- Race & ethnicity
- Hispanic / Latino 97% Two or more races 39% Native American 2% White 2%
- Hispanic origin (detail)
- Mexican 94%
- Foreign-born
- 34% · Canada
- Languages at home
- 16% English-only · Spanish 84%
Political lean MEDSL · El Paso
- 2024 margin
- D (+15.1) · D 57.0% · R 41.8% · Other 1.2%
- 2008→2024 swing
- -17.4pp toward R · 2008: 32.5pp · 2024: 15.1pp
- All cycles
- 2024: D+15.1 2020: D+35.1 2016: D+43.2 2012: D+32.6 2008: D+32.5
Not yet ingested
- Civics
- —
Market trends
- HPI YoY
- ▼ -0.93%
- Current HPI
- 239.646
- Rent YoY
- ▲ 5.29%
- Metro
- El Paso, TX
- State GDP YoY
- ▲ 3.95%
- F500 in state
- 110
Industry mix (Fortune 500 HQ in TX)
| Industry | F500 HQs | Revenue |
|---|---|---|
| Energy | 16 | $1,198B |
|
||
| Technology | 5 | $198B |
|
||
| Engineering / Construction | 4 | $72B |
|
||
| Energy Services | 3 | $60B |
|
||
| Utilities | 3 | $41B |
|
||
| Healthcare | 2 | $330B |
|
||
Price history
+147.3% since first listed25 events — show timeline
- 2026-05-13 Listed $220,000 GEPARMLS
- 2024-08-27 Listing Removed — GEPARMLS
- 2024-08-23 Price Changed $205,000 GEPARMLS
- 2024-08-19 Price Changed $224,777 GEPARMLS
- 2024-08-16 Price Changed $225,000 GEPARMLS
- 2024-07-30 Price Changed $227,995 GEPARMLS
- 2024-07-17 Price Changed $229,997 GEPARMLS
- 2024-06-25 Price Changed $230,000 GEPARMLS
- 2024-06-13 Listed $235,000 GEPARMLS
- 2023-12-27 Sold (Public Records) — Public Records
- 2023-12-03 Rental Removed $700 APPFOLIO
- 2023-11-30 Listed for Rent $700 APPFOLIO
- 2023-11-23 Rental Removed $700 APPFOLIO
- 2023-11-23 Listed for Rent $700 APPFOLIO
- 2023-04-17 Sold (Public Records) — Public Records
- 2023-02-21 Pending — GEPARMLS
- 2022-11-29 Listed $165,000 GEPARMLS
- 2018-05-31 Listing Removed — GEPARMLS
- 2017-11-09 Price Changed $99,995 GEPARMLS
- 2017-09-29 Relisted — GEPARMLS
- 2017-09-06 Pending — GEPARMLS
- 2017-05-16 Listed $105,000 GEPARMLS
- 2015-02-17 Sold (Public Records) — Public Records
- 2014-08-19 Listed $88,950 GEPARMLS
- 1987-04-23 Sold (Public Records) — Public Records
Property tax history
+10.7%/yrLatest (2025): $5,983 · -8.6% YoY. Source: county tax records.
Cash-flow waterfall
monthlySold comps — $/sqft
last 12 mo · ≤1 miLoading sold comps…