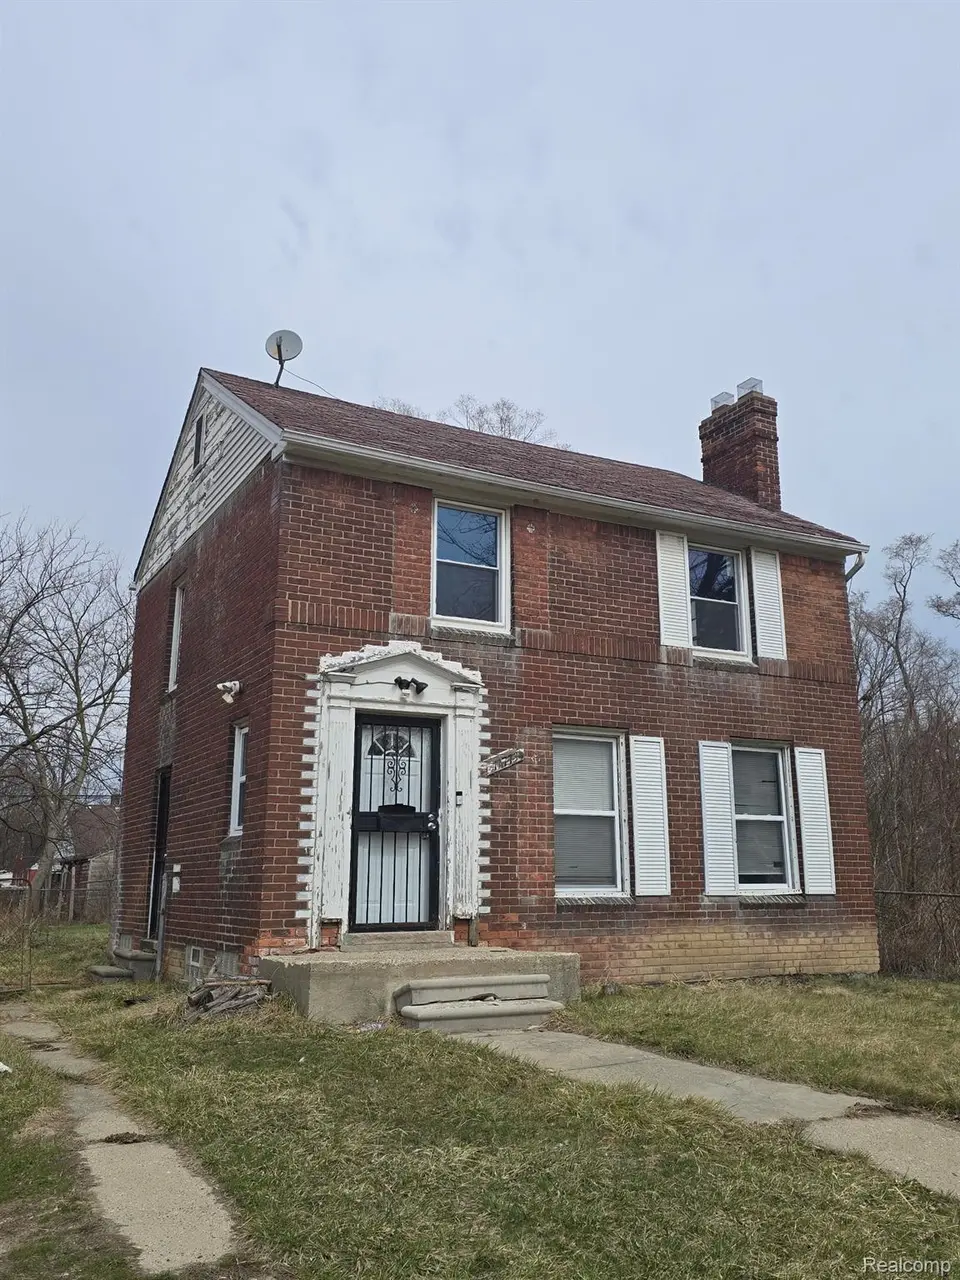
14773 Kilbourne St · Detroit, MI
Flood risk 1/10 · Minimal
- FEMA flood zone
- X (unshaded)
- Chance of flooding over 30 yrs
- 0.0%
- Est. flood insurance / yr
- $473 – $860
Fire risk 1/10 · Minimal
- Est. fire insurance / yr
- $784 – $1,456
Heat risk 3/10 · Minor
- Hot days now (above 95°F)
- 7 days/yr
- Hot days in 30 yrs
- 14 days/yr
Wind risk 2/10 · Minimal
- Chance of severe wind over 30 yrs
- —
Air-quality risk 3/10 · Minor
- Unhealthy air days now
- 2 days/yr
- Unhealthy air days in 30 yrs
- 5 days/yr
Risk factors via First Street. Map © Google.
Why this score? — see what drove the B- grade
The composite is a weighted blend of 9 inputs, each scored 0–100. Each bar is that input's sub-score; the figure is the points it added to the 100-point composite (weight × sub-score).
- Cash flow +30.0/30.0
- 1% rule +10.0/10.0
- DSCR +10.0/10.0
- ARV discount +7.5/15.0
- Livability +3.7/5.0
- Rent growth +2.5/5.0
- Condition / age +2.5/5.0
- Schools +1.3/10.0
- Appreciation +0.0/10.0
$35,000
🖨 Deal sheet 📄 Offer letter ✓ Due diligence
Listing remarks MLS
Here is an investment opportunity on Detroit's Eastside. 2BR Brick Colonial with the full basement. Living room with fireplace. Spacious primary bedroom with original hardwood floors. Good candidate to fix up and rent.
Key facts
- Full basement
- Fireplace
- 4,356 sq ft lot
Tags
Neighborhood map
What this means for you Summary
Snapshot
- This is a 2-bed/1.0-bath single-family listed at $35k.
Deal economics
- At list price, monthly cash flow is $743 ($9k/yr) — positive.
- The deal already cash-flows at list — no discount required.
- Meets the 1% rule at list price ($1k rent vs $35k).
- Recommended offer: $33k (6.0% below list) — sets the bar for market timing.
- Cap rate 31.8% vs local median 10.2% in Detroit — top-decile yield for the area; either an underpriced asset or a hidden risk that comps aren't pricing in. Stress-test before assuming the spread holds.
Location & tenants
- Location reads 73/100 on livability (#218 in MI) — a middle-class / working-renter tenant base. Strengths: amenities A+, commute A+, cost of living A+; Watch: schools F, crime F, employment F.
- Detroit Public Schools Community District (urban): math 10% / reading 24% proficiency, ranked #499 of 540 in MI (top 92%) — low school quality limits family demand, transient renter base, plan for 1-2y turnover; 90% free/reduced lunch — lower-income household profile, screen leases tightly.
- Market conditions: 190 active listings in the ZIP; 40 comparable units currently listed for rent nearby; rentals at typical pace (median 18d on market — plan ~3-4 weeks tenant-placement turnaround); lower-income renter base — watch delinquency; 2,639 units permitted in Wayne County in 2024 (1,216 in 5+ unit buildings).
- This rent runs 44% of the median local income ($34k/yr) — at the standard rent-burdened threshold; future hikes will face affordability resistance.
Forward outlook
- Local home prices are declining (-3.0%/yr); year-one equity from $242 of loan paydown is wiped out by about $1k of value loss. Plan a longer hold.
- Wayne County population projected at -17% by 2050 — secular population decline; favor cash flow + early exit over multi-decade hold.
- At projected returns (-3.0% appreciation + 3.0% rent growth), your $10k cash investment doubles in ~2 years — after that, you're playing with house money.
Negotiation context
- It's been on market 87 days — a 6% lower offer ($33k) is reasonable based on typical stale-listing flexibility.
- 5 sale attempts since 24y ago; this cycle's ask has dropped $13k (27%) from the opening price — seller is motivated, your offer sets the floor, not the list.
- Current owner paid $2k; list at $35k implies a 1650% gain — meaningful room to come down on a strong offer.
Risks & watch-outs
- Watch-outs: built in 1941 — expect roof / HVAC / electrical / plumbing capex.
Questions for the listing agent
- It's been on market 87 days. Have you received any prior offers? Is the seller open to a 6% concession, seller financing, or rate buy-down credit?
- Built in 1941 — when were the roof, HVAC, electrical panel, plumbing, and water heater last replaced?
- Why hasn't it sold? Are there any deal-killer items the seller is aware of (foundation, flood, title, zoning, code violations)?
- Is there a deadline driving the sale (1031 exchange, divorce, estate, relocation)? That informs how much negotiation room exists.
- Schools are F-rated, which usually means shorter tenancies and higher turnover. Who's the typical renter profile here, and what's been the actual vacancy rate?
- Crime grade is F in this area — have there been break-ins, vandalism, or insurance claims at this property in the last 3 years? What carrier currently insures it and at what premium?
- What's the average days-on-market for RENTAL listings here right now (not sales)? A rising rental-DOM trend means longer vacancies and softer asking-rent achievability than the comps imply.
- What's the recent tenant-quality profile in this submarket — average credit score on applications, eviction rate, late-payment / NSF rate, and stable-employment percentage? A property-management company in the area should have these aggregated.
- How much new for-sale + rental construction is in the pipeline within 1–3 miles? Heavy new supply typically softens prices + rents 12–24 months out; constrained supply supports both.
Investment metrics
- 1% rule
- 3.56% ✓
- Cap rate
- 31.78%
- Cash-on-cash
- 91.03%
- DSCR
- 5.05
- GRM
- 2.3
CMA / ARV
- ARV (median comp)
- $71,549
- List price
- $35,000
- Delta
- -51.08%
- Verdict
- UNDERPRICED
- Comps
- 20 within 1.0 mi
Show comp detail 12 sales within ~0.75 mi
| Address | Dist | Beds/Ba | Sqft | Sold | Price | $/sf | Match |
|---|---|---|---|---|---|---|---|
| 14750 Lannette St | 0.05mi | 3/1.0 (+1) | 1,099 (-5%) | 3mo | $78,000 | $71 | 81 |
| 14728 Wilfred St | 0.17mi | 3/1.0 (+1) | 1,050 (-10%) | 3mo | $30,500 | $29 | 69 |
| 14210 Wilfred St | 0.36mi | 3/1.0 (+1) | 1,264 (+9%) | 0mo | $17,000 | $13 | 63 |
| 13124 Flanders St | 0.57mi | 3/2.0 (+1) | 1,150 (-1%) | 0mo | $115,000 | $100 | 63 |
| 10904 N Mogul St | 0.36mi | 3/1.0 (+1) | 1,045 (-10%) | 0mo | $113,000 | $108 | 61 |
| 9500 Lakepointe St | 0.71mi | 3/1.0 (+1) | 1,130 (-3%) | 0mo | $125,000 | $111 | 58 |
| 13334 Elmdale St | 0.61mi | 3/1.0 (+1) | 1,221 (+5%) | 3mo | $89,254 | $73 | 55 |
| 10441 Roxbury St | 0.71mi | 3/1.5 (+1) | 1,127 (-3%) | 3mo | $59,000 | $52 | 53 |
| 15411 Young St St | 0.60mi | 3/1.5 (+1) | 1,240 (+7%) | 2mo | $95,000 | $77 | 52 |
| 15419 Young St | 0.61mi | 3/1.0 (+1) | 1,250 (+8%) | 3mo | $54,500 | $44 | 52 |
| 9768 Manistique St | 0.49mi | 3/1.0 (+1) | 986 (-15%) | 0mo | $35,000 | $35 | 47 |
| 10696 Stratman St | 0.54mi | 3/1.5 (+1) | 1,000 (-14%) | 3mo | $53,000 | $53 | 42 |
Match score weights: distance 35% · size 25% · config 20% · recency 20%. Top-matched comps best support the ARV.
Projected returns pro-forma
-3.0% appreciation · 3.0% rent growth · sell at horizon
- IRR
- 91.7%
- Equity multiple
- 5.25×
- Total profit
- $41,694
- Equity at exit
- $5,219
- IRR
- 94.6%
- Equity multiple
- 10.93×
- Total profit
- $97,349
- Equity at exit
- $3,026
Cash invested: $9,800 (down + closing). Projections, not guarantees.
Landlord ↔ Tenant lean methodology
- Overall (STATE)
- 62 Landlord-Friendly
- State Michigan
- 62 Landlord-Friendly · EVEN
- County
- — inherits STATE
- City
- — inherits STATE
ZIP-level market 48213
- Active inventory
- 190
- Price-to-rent
- 2.3×
Monthly cashflow live
- Estimated rent
- $1,247 high interval (Pro) →
- Mortgage (P&I)
- −$184
- Tax est. 1.5%
- −$44 /mo · $525/yr
- Insurance
- −$15
- HOA
- −$0
- Vacancy / Maint / Mgmt
- −$262
- Net cashflow
- $743
Break-even live
UW: 25.0% down · 7.5% · 30yr · 1.5% tax · 5.0% vac · 8.0% maint · 8.0% mgmt
Financing live
Cash to close
- Down payment
- $8,750
- Closing costs
- $1,050
- Reserves months
- —
- Total cash needed
- —
Loan-product check · same deal, 3 products live
Conventional
25% down · 7.5% · 30yr
- Down + closing
- —
- Monthly P&I
- —
- Monthly cashflow
- —
- DSCR
- —
- Eligible?
- —
Personal DTI + credit; lowest rate.
DSCR
20% down · 8.5% · 30yr
- Down + closing
- —
- Monthly P&I
- —
- Monthly cashflow
- —
- DSCR
- —
- Eligible?
- —
No personal income docs; deal must DSCR.
Hard money
10% down · 12.0% · 12mo
- Down + closing
- —
- Monthly P&I
- —
- Monthly cashflow
- —
- DSCR
- —
- Eligible?
- —
Short-term bridge; refi at stabilization.
Rent comps 40 comps
| Address | Beds | Baths | Sqft | Rent | $/sqft | DOM | Units | Dist |
|---|---|---|---|---|---|---|---|---|
| 15000 Mayfield St Detroit, MI | 3.0 | 1.0 | 1146 | $970 | $0.85 | 17d | 1 | 0.37mi |
| 10813 Whitehill St Detroit, MI | 3.0 | 1.0 | 1392 | $1,350 | $0.97 | 17d | 1 | 0.47mi |
| 10724 Whitehill St Detroit, MI | 3.0 | 3.0 | 1425 | $1,550 | $1.09 | 17d | 1 | 0.49mi |
| 13400 Longview St Detroit, MI | 3.0 | 1.5 | 1000 | $1,400 | $1.40 | 43d | 1 | 0.53mi |
| 10644 Stratman St Detroit, MI | 2.0 | 1.0 | 1000 | $1,200 | $1.20 | 17d | 1 | 0.55mi |
| 11018 Whitehill St Detroit, MI | 3.0 | 1.0 | 1146 | $1,450 | $1.27 | 10d | 1 | 0.55mi |
| 15010 Cedargrove St Detroit, MI | 3.0 | 1.5 | 1018 | $1,350 | $1.33 | 43d | 1 | 0.58mi |
| 9755 Wayburn St Detroit, MI | 3.0 | 2.0 | 1498 | $1,400 | $0.93 | 3d | 1 | 0.60mi |
| 12840 Kilbourne St Detroit, MI | 3.0 | 1.0 | 1136 | $1,350 | $1.19 | 17d | 1 | 0.63mi |
| 13137 Elmdale St Detroit, MI | 3.0 | 1.0 | 1115 | $1,400 | $1.26 | 24d | 1 | 0.65mi |
| 9516 Wayburn St Detroit, MI | 2.0 | 1.0 | 800 | $950 | $1.19 | 17d | 1 | 0.67mi |
| 10141 Roxbury St Detroit, MI | 3.0 | 1.0 | 1115 | $1,000 | $0.90 | 43d | 1 | 0.69mi |
| 14103 Rochelle Ave Unit 3 Detroit, MI | 1.0 | 1.0 | 700 | $800 | $1.14 | 43d | 1 | 0.69mi |
| 9190 Hayes St Unit 1 Detroit, MI | 2.0 | 1.0 | 750 | $850 | $1.13 | 14d | 1 | 0.73mi |
| 9168 Wayburn St Detroit, MI | 3.0 | 1.0 | 1274 | $1,300 | $1.02 | 20d | 1 | 0.79mi |
| 9400 Lakepointe St Detroit, MI | 3.0 | 1.0 | 1300 | $1,150 | $0.88 | 4d | 1 | 0.80mi |
| 9927 Beaconsfield St Detroit, MI | 3.0 | 1.0 | 942 | $1,375 | $1.46 | 14d | 1 | 0.80mi |
| 9984 Beaconsfield St Detroit, MI | 3.0 | 1.0 | 1222 | $1,575 | $1.29 | 43d | 1 | 0.84mi |
| 10803 Roxbury St Detroit, MI | 3.0 | 1.0 | 1150 | $900 | $0.78 | 20d | 1 | 0.87mi |
| 12740 August St Detroit, MI | 2.0 | 1.0 | 900 | $1,300 | $1.44 | 4d | 1 | 0.88mi |
| 9747 Somerset Ave Detroit, MI | 2.0 | 1.0 | 797 | $1,100 | $1.38 | 43d | 1 | 0.91mi |
| 15494 Mapleridge St Detroit, MI | 3.0 | 1.0 | 937 | $1,275 | $1.36 | 43d | 1 | 0.92mi |
| 9409 Balfour Rd Detroit, MI | 3.0 | 1.0 | 1195 | $1,200 | $1.00 | 43d | 1 | 0.99mi |
| 10404 Somerset Ave Detroit, MI | 3.0 | 1.0 | 1108 | $1,475 | $1.33 | 3d | 1 | 1.05mi |
| 5966 Eastlawn St Unit NA Detroit, MI | 3.0 | 1.5 | 1366 | $1,500 | $1.10 | 24d | 1 | 1.05mi |
| 11689 Wayburn St Detroit, MI | 3.0 | 1.0 | 1142 | $1,350 | $1.18 | 43d | 1 | 1.08mi |
| 11235 Roxbury St Detroit, MI | 3.0 | 1.0 | 1062 | $1,325 | $1.25 | 17d | 1 | 1.08mi |
| 13503 E McNichols Rd Unit 7 Detroit, MI | 1.0 | 1.0 | 750 | $800 | $1.07 | 17d | 1 | 1.09mi |
| 15857 Evanston St Detroit, MI | 3.0 | 1.5 | 1232 | $1,250 | $1.01 | 4d | 1 | 1.09mi |
| 12210 Longview St Detroit, MI | 3.0 | 1.0 | 1020 | $1,100 | $1.08 | 43d | 1 | 1.14mi |
| 5747 Lakepointe St Detroit, MI | 3.0 | 1.5 | 1316 | $1,473 | $1.12 | 43d | 1 | 1.15mi |
| 11620 Rossiter St Detroit, MI | 3.0 | 1.0 | 1140 | $1,200 | $1.05 | 17d | 1 | 1.15mi |
| 5751 Nottingham Rd Unit 5/21/26 Detroit, MI | 3.0 | 1.0 | 1100 | $1,250 | $1.14 | 14d | 1 | 1.19mi |
| 11611 Morang Ave Detroit, MI | 1.0–2.0 | 1.0 | 709 | $1,040 | $1.47 | 43d | 1 | 1.19mi |
| 12051 Wilshire Dr Detroit, MI | 3.0 | 1.5 | 1224 | $1,250 | $1.02 | 17d | 1 | 1.21mi |
| 13218 Greiner St Detroit, MI | 3.0 | 1.0 | 1162 | $1,195 | $1.03 | 17d | 1 | 1.24mi |
| 11776 Rossiter St Detroit, MI | 3.0 | 1.0 | 964 | $1,150 | $1.19 | 11d | 1 | 1.27mi |
| 12112 Christy St Unit 12110 Detroit, MI | 2.0 | 1.0 | 950 | $1,200 | $1.26 | 43d | 1 | 1.28mi |
| 12110 Christy St Detroit, MI | 2.0 | 1.5 | 950 | $1,200 | $1.26 | 17d | 1 | 1.28mi |
| 11529 Roxbury St Detroit, MI | 2.0 | 1.0 | 720 | $1,200 | $1.67 | 12d | 1 | 1.28mi |
Listing history 32 events
-
2026-06-18days on market $35,000 Active 87 DOM
-
2026-06-17days on market $35,000 Active 86 DOM
-
2026-06-15days on market $35,000 Active 84 DOM
-
2026-06-13days on market $35,000 Active 82 DOM
-
2026-06-13days on market $35,000 Active 81 DOM
-
2026-06-09days on market $35,000 Active 78 DOM
-
2026-06-08days on market $35,000 Active 77 DOM
-
2026-06-07days on market $35,000 Active 76 DOM
-
2026-06-04days on market $35,000 Active 73 DOM
-
2026-06-03days on market $35,000 Active 72 DOM
-
2026-06-01days on market $35,000 Active 70 DOM
-
2026-05-31days on market $35,000 Active 69 DOM
-
2026-05-08price $39,000 218-char remark
Show marketing remark (218 chars)
Here is an investment opportunity on Detroit's Eastside. 2BR Brick Colonial with the full basement. Living room with fireplace. Spacious primary bedroom with original hardwood floors. Good candidate to fix up and rent.
-
2026-05-08price $39,000 218-char remark
Show marketing remark (218 chars)
Here is an investment opportunity on Detroit's Eastside. 2BR Brick Colonial with the full basement. Living room with fireplace. Spacious primary bedroom with original hardwood floors. Good candidate to fix up and rent.
-
2026-04-10price $43,000 218-char remark
Show marketing remark (218 chars)
Here is an investment opportunity on Detroit's Eastside. 2BR Brick Colonial with the full basement. Living room with fireplace. Spacious primary bedroom with original hardwood floors. Good candidate to fix up and rent.
-
2026-04-10price $43,000 218-char remark
Show marketing remark (218 chars)
Here is an investment opportunity on Detroit's Eastside. 2BR Brick Colonial with the full basement. Living room with fireplace. Spacious primary bedroom with original hardwood floors. Good candidate to fix up and rent.
-
2026-03-23$48,000 Active 218-char remark
Show marketing remark (218 chars)
Here is an investment opportunity on Detroit's Eastside. 2BR Brick Colonial with the full basement. Living room with fireplace. Spacious primary bedroom with original hardwood floors. Good candidate to fix up and rent.
-
2026-03-23$48,000 Active 218-char remark
Show marketing remark (218 chars)
Here is an investment opportunity on Detroit's Eastside. 2BR Brick Colonial with the full basement. Living room with fireplace. Spacious primary bedroom with original hardwood floors. Good candidate to fix up and rent.
-
2010-03-01soldstatus $2,000
-
2010-03-01soldstatus $2,000
-
2009-12-09historical
-
2009-12-04$2,500
-
2009-05-15$2,500
-
2004-03-31soldstatus $77,000
-
2002-07-24soldstatus $40,000
-
2002-05-07soldstatus $42,000
-
2002-03-15$39,900
-
2001-05-18soldstatus $43,153
-
1996-04-26soldstatus $20,000
-
1993-07-12soldstatus $9,000
-
1993-07-12soldstatus $11,300
-
1993-07-12soldstatus $20,000
ⓘ Source: listings_history table (triggers on properties + properties_extension) + one-shot
backfill from property_details.listing_events for pre-trigger history.
Climate risk First Street
- Flood 1/10 Low FEMA zone X (unshaded) · 0% chance over 30 yrs
- Wildfire 1/10 Low
- Heat 3/10 Moderate 7 d/yr ≥95°F today · 14 d/yr by 30 yrs out
- Wind 2/10 Low
- Air quality 3/10 Moderate 2 unhealthy d/yr today · 5 by 30 yrs out
Nearby sold comps map
Loading sold comps map…
Walkable amenities ~0.75 mi
Loading nearby amenities…
Taxation est. · year 1
- Rental income
- $14,966
- − Mortgage interest
- −$1,961
- − Property taxes
- −$525
- − Insurance
- −$175
- − Repairs & maintenance
- −$1,197
- − Management
- −$1,197
- − Depreciation
- −$1,018
- Taxable income
- $8,893
- Est. tax owed @ 24.0%
- −$2,134
- After-tax cash flow
- $6,786/yr
For passive investors: Depreciation is non-cash, so a rental often shows a tax loss while cash-flowing — sheltering income. Rental losses are passive: they offset passive income freely, and up to $25,000/yr can offset ordinary (W-2) income if you actively participate and your MAGI is under $100k (phasing out to $0 by $150k); unused losses carry forward. On sale, claimed depreciation is recaptured at up to 25%, and gains may owe capital-gains tax (a 1031 exchange can defer both). Figures are a year-1 estimate at your 24.0% rate — not tax advice; consult a CPA.
Schools (NCES district)
- District
- Detroit Public Schools Community District
- NCES district ID
- 2601103
- Math proficiency
- 10% ▼ -2.00%
- Reading proficiency
- 24% ▲ 6.00%
- Median HH income
- $25,815
- Composite
- 13.06/100
- National rank
- #9564
- State rank
- #499 of 540 in MI
Livability — Detroit
- Score
- 73/100
- State rank
- #218
- US rank
- #5427
Category grades
Schools grade is shown separately in the Schools card above.
Census & demographics
- Census place
- Detroit, MI
- County
- Wayne County · 1,562,939 people
- City population
- 572,865
- Metro
- Detroit-Warren-Dearborn, MI
- Population (ZIP)
- 20,075
- Household income
- $34,003
- Rent vs Own
- Severe rent burden
- 1202.0
Population outlook (Wayne County) Hauer SSP2
- Today (2025)
- 1,675,273 people
- By 2030
- 1,620,300 · -3.3%
- By 2040
- 1,502,341 · -10.3%
- By 2050
- 1,384,039 · -17.4%
- By 2075
- 1,124,592 · -32.9%
- By 2100
- 881,193 · -47.4%
Race, ethnicity, and origin ACS 2023
- Neighborhood character
- Predominantly Black (92%)
- Race & ethnicity
- Black 92% White 4% Hispanic / Latino 2% Two or more races 1%
- Common ancestry
- Slovak 1%
- Foreign-born
- 2% · Canada
- Languages at home
- 97% English-only · Arabic 1% Spanish 1%
Political lean MEDSL · Wayne
- 2024 margin
- Strong D (+29.0) · D 62.7% · R 33.7% · Other 3.6%
- 2008→2024 swing
- -20.5pp toward R · 2008: 49.5pp · 2024: 29.0pp
- All cycles
- 2024: D+29.0 2020: D+38.1 2016: D+37.3 2012: D+46.9 2008: D+49.5
Not yet ingested
- Civics
- —
Market trends
- HPI YoY
- ▼ -122.86%
- Current HPI
- 217.2037
- Rent YoY
- —
- Metro
- Detroit-Warren-Dearborn, MI
- State GDP YoY
- ▲ 1.37%
- F500 in state
- 28
Industry mix (Fortune 500 HQ in MI)
| Industry | F500 HQs | Revenue |
|---|---|---|
| Automotive Parts | 3 | $48B |
|
||
| Automotive | 2 | $372B |
|
||
| Chemicals | 1 | $45B |
|
||
| Automotive Retail | 1 | $29B |
|
||
| Healthcare / Medical Devices | 1 | $23B |
|
||
| Automotive Technology | 1 | $20B |
|
||
Price history
+333.3% since first listed20 events — show timeline
- 2026-05-08 Price Changed $39,000 MiRealSource-MiMLS
- 2026-05-08 Price Changed $39,000 REALCOMP
- 2026-04-10 Price Changed $43,000 MiRealSource-MiMLS
- 2026-04-10 Price Changed $43,000 REALCOMP
- 2026-03-23 Listed $48,000 REALCOMP
- 2026-03-23 Listed $48,000 MiRealSource-MiMLS
- 2010-03-01 Sold (MLS) $2,000 MiRealSource-MiMLS
- 2010-03-01 Sold (MLS) $2,000 REALCOMP
- 2009-12-09 Listing Removed — MiRealSource-MiMLS
- 2009-12-04 Listed $2,500 MiRealSource-MiMLS
- 2009-05-15 Listed $2,500 REALCOMP
- 2004-03-31 Sold (Public Records) $77,000 Public Records
- 2002-07-24 Sold (Public Records) $40,000 Public Records
- 2002-05-07 Sold (MLS) $42,000 REALCOMP
- 2002-03-15 Listed $39,900 REALCOMP
- 2001-05-18 Sold (Public Records) $43,153 Public Records
- 1996-04-26 Sold (Public Records) $20,000 Public Records
- 1993-07-12 Sold (Public Records) $20,000 Public Records
- 1993-07-12 Sold (Public Records) $11,300 Public Records
- 1993-07-12 Sold (Public Records) $9,000 Public Records
Property tax history
+3.4%/yrLatest (2025): $1,879 · -54.2% YoY. Source: county tax records.
Cash-flow waterfall
monthlySold comps — $/sqft
last 12 mo · ≤1 miLoading sold comps…