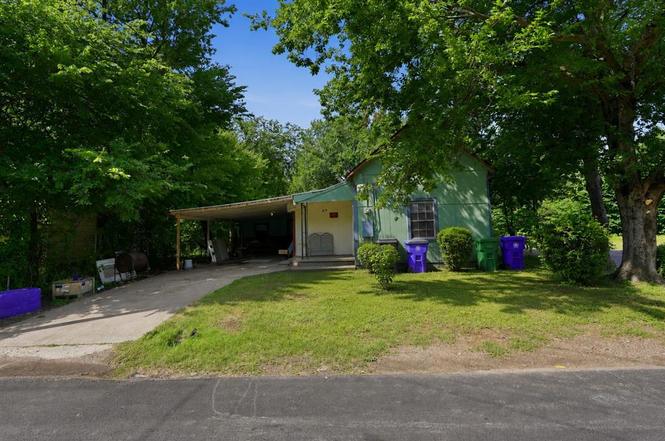
916 Turner St · Waco, TX
Flood risk 5/10 · Moderate
- FEMA flood zone
- X (shaded)
- Chance of flooding over 30 yrs
- 0.27%
- Est. flood insurance / yr
- $507 – $1,088
Fire risk 4/10 · Minor
- Est. fire insurance / yr
- $1,222 – $2,270
Heat risk 7/10 · Major
- Hot days now (above 109°F)
- 7 days/yr
- Hot days in 30 yrs
- 25 days/yr
Wind risk 6/10 · Moderate
- Chance of severe wind over 30 yrs
- 59.0%
Air-quality risk 2/10 · Minimal
- Unhealthy air days now
- 0 days/yr
- Unhealthy air days in 30 yrs
- 1 days/yr
Risk factors via First Street. Map © Google.
Why this score? — see what drove the B grade
The composite is a weighted blend of 9 inputs, each scored 0–100. Each bar is that input's sub-score; the figure is the points it added to the 100-point composite (weight × sub-score).
- Cash flow +30.0/30.0
- 1% rule +10.0/10.0
- DSCR +10.0/10.0
- ARV discount +7.5/15.0
- Livability +3.7/5.0
- Appreciation +2.5/10.0
- Rent growth +2.5/5.0
- Condition / age +2.5/5.0
- Schools +1.8/10.0
$69,900
🖨 Deal sheet 📄 Offer letter ✓ Due diligence
Listing remarks
Investor Special in Waco, TX! Flexible floor plan with multiple exit strategies. Property can function as a 3 bed - 2 bath residence or may offer duplex-triplex potential, subject to buyer verification. Livable as-is but would benefit from an upgrade, making it an excellent opportunity for a fix-and-flip, a value-add rental, or a home to make your own. Strong upside potential in a growing Waco market
Key facts
- 6,273 sq ft lot
- Garage
- Built 1913
Property features AI
Finance
- Other: Possession: Negotiable
- Financial info: Listing terms: Cash or Conventional; Treat as clear loan type; No second mortgage indicated
- HOA & community: No association (no HOA)
Exterior
- Parking: Carport; Driveway; One covered/carport space; Has attached garage (no garage spaces listed)
- Utilities: City water service; City sewer service; Not in a municipal utility district
- Home design: Single-family residence (residential); One story; Property is not attached
- Construction: Built in 1913; Composition roof; Slab foundation
- Exterior features: Lot under 0.5 acre (approximately 0.144 acres); City water; City sewer; Subdivision: Ashburn
Interior
- Kitchen: Kitchen (level 1) — approximately 14 x 15; Appliances: Other
- Bedrooms: Primary bedroom (level 1) — approximately 12 x 12; Bedroom (level 1) — approximately 10 x 10; Bedroom (level 1) — approximately 10 x 10
- Flooring: Concrete flooring; Laminate flooring; Wood flooring
- Bathrooms: Two full bathrooms; Primary bathroom (level 1) — approximately 8 x 9; Bathroom (level 1) — approximately 7 x 8
- Heating & cooling: Window unit(s) for cooling
- Interior features: Seven total rooms; One living area; One-level layout; Other interior features
- Laundry & utility: No specific washer/dryer details listed
Neighborhood map
What this means for you Summary
Snapshot
- This is a 3-bed/2.0-bath single-family listed at $70k.
Deal economics
- At list price, monthly cash flow is $523 ($6k/yr) — positive.
- The deal already cash-flows at list — no discount required.
- Meets the 1% rule at list price ($1k rent vs $70k).
- Cap rate 15.3% vs local median 3.9% in Waco — top-decile yield for the area; either an underpriced asset or a hidden risk that comps aren't pricing in. Stress-test before assuming the spread holds.
Location & tenants
- Location reads 74/100 on livability (#166 in TX, #4,378 nationally) — a middle-class / working-renter tenant base. Strengths: cost of living A+, housing A+, health & safety A+; Watch: crime D, commute F, employment D-.
- Waco ISD (urban): math 20% / reading 24% proficiency, ranked #773 of 826 in TX (top 94%) — low school quality limits family demand, transient renter base, plan for 1-2y turnover; 81% free/reduced lunch — lower-income household profile, screen leases tightly.
- Zoned schools: South Waco El (math 8% / reading 22%, grade F, #4,021 of 4,322 statewide, top 94%, 462 students, 96% FRL).
- Market conditions: 86 active listings in the ZIP; 31 comparable units currently listed for rent nearby; rentals at typical pace (median 21d on market — plan ~3-4 weeks tenant-placement turnaround); lower-income renter base — watch delinquency; 1,014 units permitted in McLennan County in 2024 (200 in 5+ unit buildings).
- At $1,438/mo this rent would consume 57% of the median local household income ($30k/yr) (locally 603% of renters already pay >50% of income on rent) — very limited rent-growth headroom before tenants either downsize or default.
Forward outlook
- Local home prices are declining (-3.0%/yr); year-one equity from $483 of loan paydown is wiped out by about $2k of value loss. Plan a longer hold.
- McLennan County population projected at +17% by 2050 — long-run rental-demand tailwind backs the buy-and-hold thesis.
- At projected returns (-3.0% appreciation + 3.0% rent growth), your $20k cash investment doubles in ~4 years — after that, you're playing with house money.
Negotiation context
- Only 1 days on market — expect competitive offers; lowballing is unlikely to land.
- 2 sale attempts since 10y ago with the ask held roughly flat each time — persistent listings suggest the price (not the market) is what's stuck; bring a comps-based counter.
Risks & watch-outs
- Watch-outs: property tax is 3.7% of price; built in 1913 — expect roof / HVAC / electrical / plumbing capex.
- Climate carrying-cost: moderate flood risk; major wind risk, 59% chance of damaging wind over 30y; extreme-heat days projected 7→25/yr by 2055 (HVAC capex compounding) — expect insurance premiums to compound above CPI over the hold.
Questions for the listing agent
- Built in 1913 — when were the roof, HVAC, electrical panel, plumbing, and water heater last replaced?
- Property tax is high relative to price — has the assessment been appealed recently, and will the sale trigger a re-assessment?
- Is there a deadline driving the sale (1031 exchange, divorce, estate, relocation)? That informs how much negotiation room exists.
- Schools are D-rated, which usually means shorter tenancies and higher turnover. Who's the typical renter profile here, and what's been the actual vacancy rate?
- Crime grade is D in this area — have there been break-ins, vandalism, or insurance claims at this property in the last 3 years? What carrier currently insures it and at what premium?
- What's the average days-on-market for RENTAL listings here right now (not sales)? A rising rental-DOM trend means longer vacancies and softer asking-rent achievability than the comps imply.
- What's the recent tenant-quality profile in this submarket — average credit score on applications, eviction rate, late-payment / NSF rate, and stable-employment percentage? A property-management company in the area should have these aggregated.
- How much new for-sale + rental construction is in the pipeline within 1–3 miles? Heavy new supply typically softens prices + rents 12–24 months out; constrained supply supports both.
Investment metrics
- 1% rule
- 2.06% ✓
- Cap rate
- 15.28%
- Cash-on-cash
- 32.08%
- DSCR
- 2.43
- GRM
- 4.1
CMA / ARV
- ARV (on-the-fly)
- $167,550
- Comps found
- 12
Show comp detail 12 sales within ~0.75 mi
| Address | Dist | Beds/Ba | Sqft | Sold | Price | $/sf | Match |
|---|---|---|---|---|---|---|---|
| 1111 Turner St | 0.13mi | 2/1.0 (-1) | 1,036 (-7%) | 7mo | $174,900 | $169 | 67 |
| 701 Rusk St | 0.47mi | 3/2.0 | 1,058 (-5%) | 5mo | $159,000 | $150 | 65 |
| 504 Dearborn St | 0.45mi | 3/1.5 | 1,068 (-4%) | 8mo | $185,000 | $173 | 63 |
| 1016 Preston St | 0.08mi | 2/1.0 (-1) | 989 (-12%) | 6mo | $35,000 | $35 | 63 |
| 803 Garrison St | 0.36mi | 3/1.0 | 1,244 (+11%) | 3mo | $198,500 | $160 | 58 |
| 521 E Lee St | 0.37mi | 2/2.0 (-1) | 1,200 (+7%) | 9mo | $139,900 | $117 | 58 |
| 1222 Chestnut St | 0.62mi | 3/1.5 | 1,080 (-3%) | 9mo | $115,000 | $106 | 56 |
| 1106 Chestnut St | 0.46mi | 3/1.0 | 1,204 (+8%) | 9mo | $165,000 | $137 | 54 |
| 504 Garrison St | 0.42mi | 2/1.0 (-1) | 1,032 (-8%) | 6mo | $69,900 | $68 | 54 |
| 604 Garrison St | 0.37mi | 2/1.0 (-1) | 960 (-14%) | 0mo | $114,900 | $120 | 50 |
| 1144 Faulkner Ln | 0.41mi | 3/1.0 | 972 (-13%) | 8mo | $162,000 | $167 | 49 |
| 621 Delano St | 0.66mi | 3/2.0 | 1,256 (+12%) | 1mo | $219,900 | $175 | 48 |
Match score weights: distance 35% · size 25% · config 20% · recency 20%. Top-matched comps best support the ARV.
Projected returns pro-forma
-3.0% appreciation · 3.0% rent growth · sell at horizon
- IRR
- 27.2%
- Equity multiple
- 2.13×
- Total profit
- $22,100
- Equity at exit
- $10,422
- IRR
- 34.8%
- Equity multiple
- 4.20×
- Total profit
- $62,568
- Equity at exit
- $6,044
Cash invested: $19,572 (down + closing). Projections, not guarantees.
Landlord ↔ Tenant lean methodology
- Overall (STATE)
- 87 Strongly Landlord-Friendly
- State Texas
- 87 Strongly Landlord-Friendly · R+5
- County
- — inherits STATE
- City
- — inherits STATE
ZIP-level market 76704
- Home prices YoY
- -2.7%
- Active inventory
- 86
- Price-to-rent
- 4.1×
Monthly cashflow live
- Estimated rent
- $1,438 high interval (Pro) →
- Mortgage (P&I)
- −$367
- Tax from tax record
- −$217 /mo · $2,607/yr
- Insurance
- −$29
- HOA
- −$0
- Vacancy / Maint / Mgmt
- −$302
- Net cashflow
- $523
Break-even live
UW: 25.0% down · 7.5% · 30yr · 1.5% tax · 5.0% vac · 8.0% maint · 8.0% mgmt
Financing live
Cash to close
- Down payment
- $17,475
- Closing costs
- $2,097
- Reserves months
- —
- Total cash needed
- —
Loan-product check · same deal, 3 products live
Conventional
25% down · 7.5% · 30yr
- Down + closing
- —
- Monthly P&I
- —
- Monthly cashflow
- —
- DSCR
- —
- Eligible?
- —
Personal DTI + credit; lowest rate.
DSCR
20% down · 8.5% · 30yr
- Down + closing
- —
- Monthly P&I
- —
- Monthly cashflow
- —
- DSCR
- —
- Eligible?
- —
No personal income docs; deal must DSCR.
Hard money
10% down · 12.0% · 12mo
- Down + closing
- —
- Monthly P&I
- —
- Monthly cashflow
- —
- DSCR
- —
- Eligible?
- —
Short-term bridge; refi at stabilization.
Rent comps 31 comps
| Address | Beds | Baths | Sqft | Rent | $/sqft | DOM | Units | Dist |
|---|---|---|---|---|---|---|---|---|
| 1104 Sherman St Waco, TX | 2.0 | 1.0 | 1120 | $1,500 | $1.34 | 43d | 1 | 0.17mi |
| 609 Sherman St Waco, TX | 3.0 | 2.0 | 1028 | $1,449 | $1.41 | 21d | 1 | 0.24mi |
| 1212 J J Flewellen Rd Waco, TX | 2.0 | 1.0 | 844 | $1,250 | $1.48 | 43d | 1 | 0.25mi |
| 108 Choctaw Ct Waco, TX | 3.0 | 2.0 | 1273 | $1,600 | $1.26 | 13d | 1 | 0.30mi |
| 825 Garrison St Waco, TX | 3.0 | 2.0 | 1028 | $1,370 | $1.33 | 13d | 1 | 0.34mi |
| 1107 Chestnut St Waco, TX | 2.0 | 1.0 | 928 | $1,300 | $1.40 | 21d | 1 | 0.45mi |
| 932 Dawson St Waco, TX | 3.0 | 2.0 | 1028 | $1,449 | $1.41 | 13d | 1 | 0.47mi |
| 507 Dunbar St Waco, TX | 3.0 | 1.0 | 841 | $1,550 | $1.84 | 21d | 1 | 0.60mi |
| 507 Dunbar St Waco, TX | 3.0 | 1.0 | 852 | $1,450 | $1.70 | 13d | 1 | 0.60mi |
| 1226 Chestnut St Unit A Waco, TX | 3.0 | 2.0 | 980 | $925 | $0.94 | 21d | 1 | 0.60mi |
| 916 Olive St Waco, TX | 3.0 | 2.0 | 1028 | $1,475 | $1.43 | 13d | 1 | 0.63mi |
| 804 Earle Ave Unit A Waco, TX | 3.0 | 2.0 | 872 | $1,035 | $1.19 | 13d | 1 | 0.71mi |
| 923 Burgan St Unit A Waco, TX | 3.0 | 2.0 | 872 | $1,015 | $1.16 | 13d | 1 | 0.71mi |
| 925 Burgan St Unit A Waco, TX | 3.0 | 2.0 | 872 | $999 | $1.15 | 13d | 1 | 0.72mi |
| 1319 Tabor St Waco, TX | 3.0 | 1.5 | 1234 | $1,700 | $1.38 | 13d | 1 | 0.75mi |
| 1013 Earle Ave Waco, TX | 3.0 | 2.0 | 1028 | $1,525 | $1.48 | 21d | 1 | 0.77mi |
| 2017 Broadway St Waco, TX | 3.0 | 1.0 | 1247 | $1,800 | $1.44 | 43d | 1 | 0.78mi |
| 413 Lottie St Unit B Waco, TX | 3.0 | 2.0 | 872 | $1,025 | $1.18 | 13d | 1 | 0.79mi |
| 1008 E Pecan Ave Waco, TX | 3.0 | 1.0 | 1400 | $1,350 | $0.96 | 13d | 1 | 0.81mi |
| 215 Washington Ave Waco, TX | 1.0–4.0 | 1.0–4.0 | 919 | $1,737 | $1.89 | 21d | 1 | 0.90mi |
| 1606 N 9th St Waco, TX | 4.0 | 2.0 | 1392 | $1,525 | $1.10 | 21d | 1 | 1.20mi |
| 718 Garland Ave Unit b Waco, TX | 3.0 | 1.0 | 838 | $985 | $1.18 | 13d | 1 | 1.22mi |
| 700 Franklin Ave Waco, TX | 2.0 | 2.0 | 802 | $1,500 | $1.87 | 43d | 1 | 1.30mi |
| 1110 N 11th St Waco, TX | 3.0 | 2.0 | 1172 | $1,495 | $1.28 | 21d | 1 | 1.34mi |
| 1104 N 11th St Waco, TX | 3.0 | 2.0 | 1231 | $1,650 | $1.34 | 21d | 1 | 1.34mi |
| 1600 N 11th St Unit A Waco, TX | 3.0 | 2.0 | 1217 | $1,750 | $1.44 | 43d | 1 | 1.34mi |
| 804 N 11th St Waco, TX | 1.0–2.0 | 1.0 | 838 | $1,200 | $1.43 | 21d | 1 | 1.35mi |
| 712 Proctor Ave Waco, TX | 4.0 | 2.0 | 1184 | $1,450 | $1.22 | 21d | 1 | 1.39mi |
| 700 S 4th St Waco, TX | 1.0–3.0 | 1.0–2.0 | 889 | $1,400 | $1.57 | 13d | 12 | 1.39mi |
| 1216 Tennessee Ave Unit B Waco, TX | 3.0 | 2.0 | 872 | $1,350 | $1.55 | 21d | 1 | 1.45mi |
| 1216 Tennessee Ave Waco, TX | 3.0 | 2.0 | 872 | $1,250 | $1.43 | 21d | 1 | 1.45mi |
Listing history 2 events
-
2026-06-17remarks 403-char remark
-
2026-06-17$69,900 Active 1 DOM
ⓘ Source: listings_history table (triggers on properties + properties_extension) + one-shot
backfill from property_details.listing_events for pre-trigger history.
Tax reassessment forecast TX · Resets to sale price
- Current annual tax
- $2,607 · $217/mo
- Projected year-2 tax
- $2,607 · $217/mo
- Expected delta
- $0/yr ($0/mo · 0.0%)
ⓘ Screening estimate from a state-policy table — verify with the county assessor before closing.
Climate risk First Street
- Flood 5/10 Major FEMA zone X (shaded) · 27% chance over 30 yrs
- Wildfire 4/10 Moderate
- Heat 7/10 Severe 7 d/yr ≥109°F today · 25 d/yr by 30 yrs out
- Wind 6/10 Major 59% chance of damaging wind over 30 yrs
- Air quality 2/10 Low 0 unhealthy d/yr today · 1 by 30 yrs out
Nearby sold comps map
Loading sold comps map…
Walkable amenities ~0.75 mi
Loading nearby amenities…
Taxation est. · year 1
- Rental income
- $17,259
- − Mortgage interest
- −$3,915
- − Property taxes
- −$2,607
- − Insurance
- −$350
- − Repairs & maintenance
- −$1,381
- − Management
- −$1,381
- − Depreciation
- −$2,033
- Taxable income
- $5,592
- Est. tax owed @ 24.0%
- −$1,342
- After-tax cash flow
- $4,937/yr
For passive investors: Depreciation is non-cash, so a rental often shows a tax loss while cash-flowing — sheltering income. Rental losses are passive: they offset passive income freely, and up to $25,000/yr can offset ordinary (W-2) income if you actively participate and your MAGI is under $100k (phasing out to $0 by $150k); unused losses carry forward. On sale, claimed depreciation is recaptured at up to 25%, and gains may owe capital-gains tax (a 1031 exchange can defer both). Figures are a year-1 estimate at your 24.0% rate — not tax advice; consult a CPA.
Schools (NCES district)
- District
- Waco ISD
- NCES district ID
- 4844280
- Math proficiency
- 20% ▼ -14.00%
- Reading proficiency
- 24% ▼ -6.00%
- Median HH income
- $29,208
- Composite
- 17.57/100
- National rank
- #9043
- State rank
- #773 of 826 in TX
Livability — Waco
- Score
- 74/100
- State rank
- #166
- US rank
- #4378
Category grades
Schools grade is shown separately in the Schools card above.
Census & demographics
- Census place
- Waco, TX
- County
- McLennan County · 213,088 people
- City population
- 125,319
- Metro
- Waco, TX
- Population (ZIP)
- 7,018
- Household income
- $30,349
- Rent vs Own
- Severe rent burden
- 603.0
Population outlook (McLennan County) Hauer SSP2
- Today (2025)
- 264,191 people
- By 2030
- 273,578 · +3.6%
- By 2040
- 291,506 · +10.3%
- By 2050
- 308,044 · +16.6%
- By 2075
- 349,648 · +32.3%
- By 2100
- 364,779 · +38.1%
Race, ethnicity, and origin ACS 2023
- Neighborhood character
- Predominantly Black (67%)
- Race & ethnicity
- Black 67% Hispanic / Latino 19% Two or more races 11% White 10%
- Hispanic origin (detail)
- Mexican 17%
- Common ancestry
- Lithuanian 2%
- Foreign-born
- 6% · Canada
- Languages at home
- 86% English-only · Spanish 14%
Political lean MEDSL · McLennan
- 2024 margin
- Solid R (+30.9) · D 34.0% · R 64.9% · Other 1.0%
- 2008→2024 swing
- -7.0pp toward R · 2008: -23.9pp · 2024: -30.9pp
- All cycles
- 2024: R+30.9 2020: R+23.4 2016: R+27.1 2012: R+29.8 2008: R+23.9
Not yet ingested
- Civics
- —
Market trends
- HPI YoY
- ▼ -5.09%
- Current HPI
- 181.8051
- Rent YoY
- —
- Metro
- Waco, TX
- State GDP YoY
- ▲ 3.95%
- F500 in state
- 110
Industry mix (Fortune 500 HQ in TX)
| Industry | F500 HQs | Revenue |
|---|---|---|
| Energy | 16 | $1,198B |
|
||
| Technology | 5 | $198B |
|
||
| Engineering / Construction | 4 | $72B |
|
||
| Energy Services | 3 | $60B |
|
||
| Utilities | 3 | $41B |
|
||
| Healthcare | 2 | $330B |
|
||
Price history
+133.8% since first listed3 events — show timeline
- 2026-06-17 Listed $69,900 NTREIS
- 2016-02-25 Listing Removed — NTREIS
- 2016-01-29 Listed $29,900 NTREIS
Property tax history
+8.2%/yrLatest (2025): $2,607 · -1.1% YoY. Source: county tax records.
Cash-flow waterfall
monthlySold comps — $/sqft
last 12 mo · ≤1 miLoading sold comps…