360&384 Rogers Ln · Cloverdale, VA
Flood risk 1/10 · Minimal
- FEMA flood zone
- X (unshaded)
- Chance of flooding over 30 yrs
- 0.0%
- Est. flood insurance / yr
- $473 – $860
Fire risk 4/10 · Minor
- Est. fire insurance / yr
- $666 – $1,236
Heat risk 4/10 · Minor
- Hot days now (above 100°F)
- 7 days/yr
- Hot days in 30 yrs
- 19 days/yr
Wind risk 2/10 · Minimal
- Chance of severe wind over 30 yrs
- 1.0%
Air-quality risk 2/10 · Minimal
- Unhealthy air days now
- 0 days/yr
- Unhealthy air days in 30 yrs
- 1 days/yr
Risk factors via First Street. Map © Google.
Why this score? — see what drove the F grade
The composite is a weighted blend of 9 inputs, each scored 0–100. Each bar is that input's sub-score; the figure is the points it added to the 100-point composite (weight × sub-score).
- ARV discount +7.5/15.0
- Schools +6.8/10.0
- Cash flow +5.8/30.0
- Appreciation +5.8/10.0
- Livability +3.3/5.0
- Rent growth +2.5/5.0
- Condition / age +2.5/5.0
- DSCR +0.2/10.0
- 1% rule +0.0/10.0
$315,000
🖨 Deal sheet 📄 Offer letter ✓ Due diligence
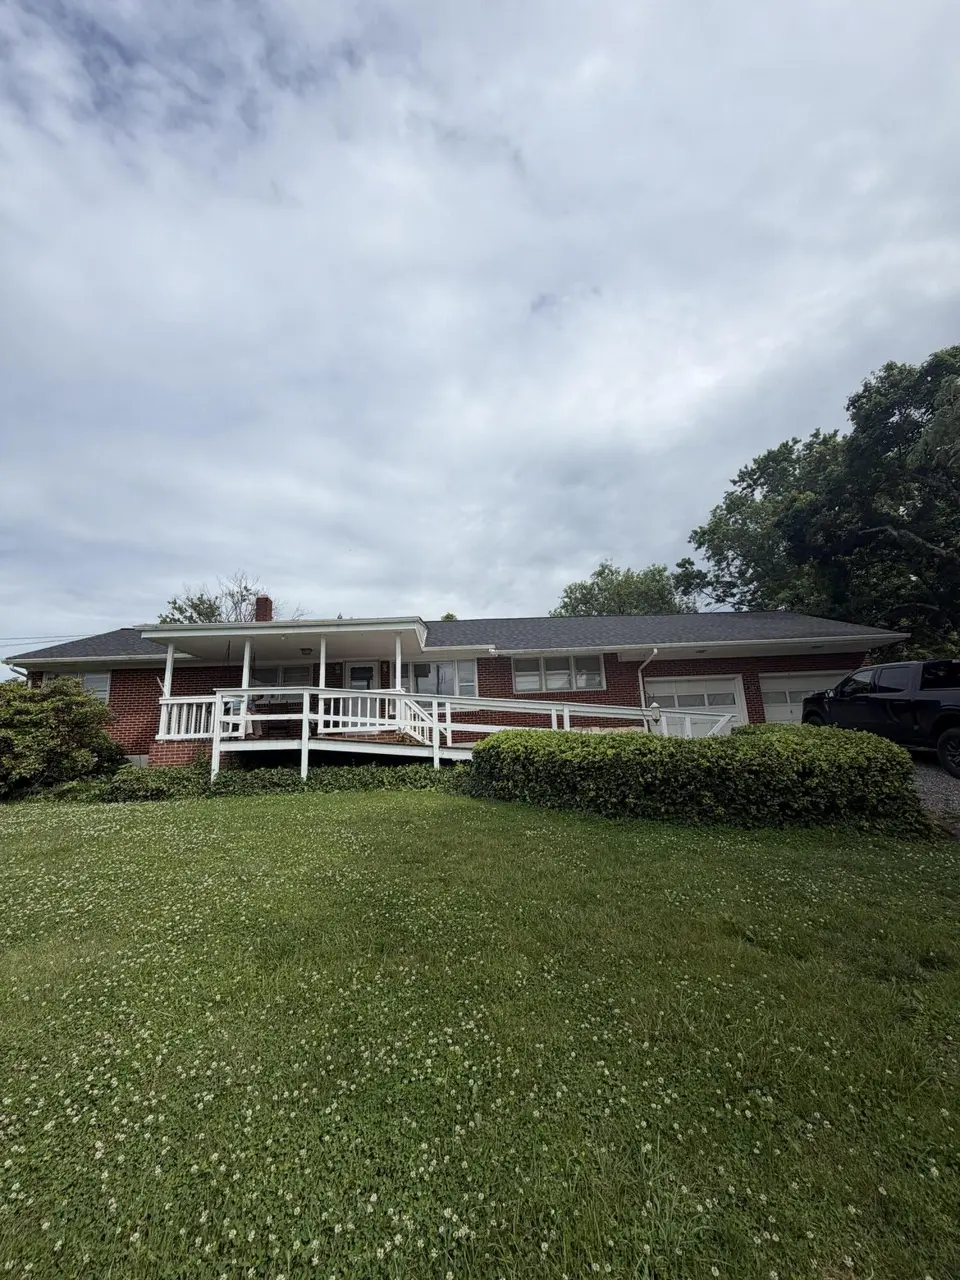
Listing remarks
2 houses side by side listed and sold same day. One is a 3 bed 1 full bath brick ranch with 2 car garage with a brand new roof. The other house is an old farm house with 1 bed 1 full bath. Both dated but functional.
Key facts
- Garage
- Built 1957
Neighborhood map
What this means for you Summary
Snapshot
- This is a 1-bed/1.0-bath single-family listed at $315k.
Deal economics
- At list price, monthly cash flow is $-630 ($-8k/yr) — negative.
- To cash-flow at today's rent, offer at most $204k (35.3% below list).
- To meet the 1% rule (rent ≥ 1% of price), the offer needs to be $155k (50.7% below list).
- Recommended offer: $155k (50.7% below list) — sets the bar for 1% rule.
- Cap rate 3.9% vs local median 2.9% in Cloverdale — top-decile yield for the area; either an underpriced asset or a hidden risk that comps aren't pricing in. Stress-test before assuming the spread holds.
Location & tenants
- Location reads 66/100 on livability (#325 in VA) — a middle-class / working-renter tenant base. Strengths: crime A+, housing B; Watch: employment C-, amenities F, commute F.
- Botetourt County Public School District (rural): math 76% / reading 82% proficiency, ranked #6 of 131 in VA (top 5%) — strong family-tenant draw, lease renewals of 3-5y typical; only 19% free/reduced lunch — higher-income household profile.
- Zoned schools: Cloverdale Elementary (math 77% / reading 87%, grade A+, #106 of 1,108 statewide, top 11%, 249 students, 33% FRL); Read Mountain Middle (math 75% / reading 82%, grade A+, #32 of 342 statewide, top 9%, 657 students, 35% FRL); Lord Botetourt High (math 83% / reading 92%, grade A, #15 of 319 statewide, top 4%, 980 students, 27% FRL).
- Market conditions: 6 active listings in the ZIP; 116 units permitted in Botetourt County in 2024 (0 in 5+ unit buildings).
Forward outlook
- In year one you build about $7k of equity ($2k loan paydown + $5k appreciation (1.6% local appreciation)).
- Botetourt County population projected to shrink 4% by 2050 — rents likely to lag national; underwrite the cash flow, not the appreciation.
- By year 5, paydown + projected appreciation supports a ~$32k cash-out refi (75% LTV) — recoverable capital for the next deal without selling this one.
Negotiation context
- Only 0 days on market — expect competitive offers; lowballing is unlikely to land.
Risks & watch-outs
- Watch-outs: built in 1957 — expect roof / HVAC / electrical / plumbing capex.
Questions for the listing agent
- What do current leases actually rent for vs. the listed asking? Can we see a recent rent roll and the last 12 months of T-12 income?
- Built in 1957 — when were the roof, HVAC, electrical panel, plumbing, and water heater last replaced?
- Is there a deadline driving the sale (1031 exchange, divorce, estate, relocation)? That informs how much negotiation room exists.
- Schools are A-rated — typically a magnet for longer-tenancy family renters. What's the average tenant stay here, and is there a school-zone premium baked into asking?
- The area grade is low — what's the realistic commute time and amenity access for the typical tenant pool here? Any planned neighborhood developments (good or bad) we should know about?
- What's the average days-on-market for RENTAL listings here right now (not sales)? A rising rental-DOM trend means longer vacancies and softer asking-rent achievability than the comps imply.
- What's the recent tenant-quality profile in this submarket — average credit score on applications, eviction rate, late-payment / NSF rate, and stable-employment percentage? A property-management company in the area should have these aggregated.
- How much new for-sale + rental construction is in the pipeline within 1–3 miles? Heavy new supply typically softens prices + rents 12–24 months out; constrained supply supports both.
Investment metrics
- 1% rule
- 0.49% ✗
- Cap rate
- 3.89%
- Cash-on-cash
- -8.58%
- DSCR
- 0.62
- GRM
- 16.9
CMA / ARV
No comps found within radius.
Projected returns pro-forma
1.58% appreciation · 3.0% rent growth · sell at horizon
- IRR
- -5.5%
- Equity multiple
- 0.71×
- Total profit
- $-25,344
- Equity at exit
- $117,197
- IRR
- -0.3%
- Equity multiple
- 0.96×
- Total profit
- $-3,850
- Equity at exit
- $163,510
Cash invested: $88,200 (down + closing). Projections, not guarantees.
Landlord ↔ Tenant lean methodology
- Overall (STATE)
- 55 Moderately Landlord-Leaning
- State Virginia
- 55 Moderately Landlord-Leaning · D+2
- County
- — inherits STATE
- City
- — inherits STATE
ZIP-level market 24077
- Home prices YoY
- 0.9%
- Active inventory
- 6
- Price-to-rent
- 16.9×
Monthly cashflow live
- Estimated rent
- $1,553 medium interval (Pro) →
- Mortgage (P&I)
- −$1,652
- Tax from tax record
- −$74 /mo · $884/yr
- Insurance
- −$131
- HOA
- −$0
- Vacancy / Maint / Mgmt
- −$326
- Net cashflow
- $-630
Break-even live
UW: 25.0% down · 7.5% · 30yr · 1.5% tax · 5.0% vac · 8.0% maint · 8.0% mgmt
Financing live
Cash to close
- Down payment
- $78,750
- Closing costs
- $9,450
- Reserves months
- —
- Total cash needed
- —
Loan-product check · same deal, 3 products live
Conventional
25% down · 7.5% · 30yr
- Down + closing
- —
- Monthly P&I
- —
- Monthly cashflow
- —
- DSCR
- —
- Eligible?
- —
Personal DTI + credit; lowest rate.
DSCR
20% down · 8.5% · 30yr
- Down + closing
- —
- Monthly P&I
- —
- Monthly cashflow
- —
- DSCR
- —
- Eligible?
- —
No personal income docs; deal must DSCR.
Hard money
10% down · 12.0% · 12mo
- Down + closing
- —
- Monthly P&I
- —
- Monthly cashflow
- —
- DSCR
- —
- Eligible?
- —
Short-term bridge; refi at stabilization.
Listing history 2 events
-
2026-06-02remarks 215-char remark
-
2026-06-02$315,000 Pending
ⓘ Source: listings_history table (triggers on properties + properties_extension) + one-shot
backfill from property_details.listing_events for pre-trigger history.
Tax reassessment forecast VA · Resets to sale price
- Current annual tax
- $884 · $74/mo
- Projected year-2 tax
- $2,583 · $215/mo
- Expected delta
- +$1,699/yr (+$142/mo · 192.2%)
ⓘ Screening estimate from a state-policy table — verify with the county assessor before closing.
Climate risk First Street
- Flood 1/10 Low FEMA zone X (unshaded) · 0% chance over 30 yrs
- Wildfire 4/10 Moderate
- Heat 4/10 Moderate 7 d/yr ≥100°F today · 19 d/yr by 30 yrs out
- Wind 2/10 Low 100% chance of damaging wind over 30 yrs
- Air quality 2/10 Low 0 unhealthy d/yr today · 1 by 30 yrs out
Nearby sold comps map
Loading sold comps map…
Walkable amenities ~0.75 mi
Loading nearby amenities…
Taxation est. · year 1
- Rental income
- $18,631
- − Mortgage interest
- −$17,645
- − Property taxes
- −$884
- − Insurance
- −$1,575
- − Repairs & maintenance
- −$1,490
- − Management
- −$1,490
- − Depreciation
- −$9,164
- Taxable loss
- −$13,618
- Est. tax savings @ 24.0%
- +$3,268
- After-tax cash flow
- $-4,295/yr
For passive investors: Depreciation is non-cash, so a rental often shows a tax loss while cash-flowing — sheltering income. Rental losses are passive: they offset passive income freely, and up to $25,000/yr can offset ordinary (W-2) income if you actively participate and your MAGI is under $100k (phasing out to $0 by $150k); unused losses carry forward. On sale, claimed depreciation is recaptured at up to 25%, and gains may owe capital-gains tax (a 1031 exchange can defer both). Figures are a year-1 estimate at your 24.0% rate — not tax advice; consult a CPA.
Schools (NCES district)
- District
- Botetourt County Public School District
- NCES district ID
- 5100420
- Math proficiency
- 76% ▼ -14.00%
- Reading proficiency
- 82% ▼ -2.00%
- Median HH income
- $63,125
- Composite
- 68.07/100
- National rank
- #355
- State rank
- #6 of 131 in VA
Livability — Cloverdale
- Score
- 66/100
- State rank
- #325
- US rank
- #12236
Category grades
Schools grade is shown separately in the Schools card above.
Census & demographics
- Population (ZIP)
- 1,098
Population outlook (Botetourt County) Hauer SSP2
- Today (2025)
- 34,273 people
- By 2030
- 34,457 · +0.5%
- By 2040
- 34,051 · -0.6%
- By 2050
- 32,841 · -4.2%
- By 2075
- 30,720 · -10.4%
- By 2100
- 26,395 · -23.0%
Race, ethnicity, and origin ACS 2023
- Neighborhood character
- Predominantly White (70%)
- Race & ethnicity
- White 70% Black 11% Hispanic / Latino 11%
- Hispanic origin (detail)
- Mexican 1% Puerto Rican 9%
- Common ancestry
- Lithuanian 10% Slovak 9% Serbian 8%
- Foreign-born
- 2%
Political lean MEDSL · Botetourt
- 2024 margin
- Solid R (+45.1) · D 27.0% · R 72.2%
- 2008→2024 swing
- -11.9pp toward R · 2008: -33.2pp · 2024: -45.1pp
- All cycles
- 2024: R+45.1 2020: R+44.5 2016: R+47.6 2012: R+38.6 2008: R+33.2
Not yet ingested
- Civics
- —
Market trends
- HPI YoY
- ▲ 1.58%
- Current HPI
- 167.3582
- Rent YoY
- —
- Metro
- —
- State GDP YoY
- ▲ 2.40%
- F500 in state
- 50
Industry mix (Fortune 500 HQ in VA)
| Industry | F500 HQs | Revenue |
|---|---|---|
| Aerospace / Defense | 4 | $236B |
|
||
| Technology / Defense | 3 | $32B |
|
||
| Financial Services | 2 | $176B |
|
||
| Utilities | 2 | $27B |
|
||
| Insurance | 2 | $25B |
|
||
| Technology | 2 | $15B |
|
||
Price history
2 events — show timeline
- 2026-06-01 Listing Removed — MLSRV
- 2026-06-01 Listed $315,000 MLSRV
Property tax history
+2.2%/yrLatest (2025): $884 · +0.0% YoY. Source: county tax records.
Cash-flow waterfall
monthlySold comps — $/sqft
last 12 mo · ≤1 miLoading sold comps…