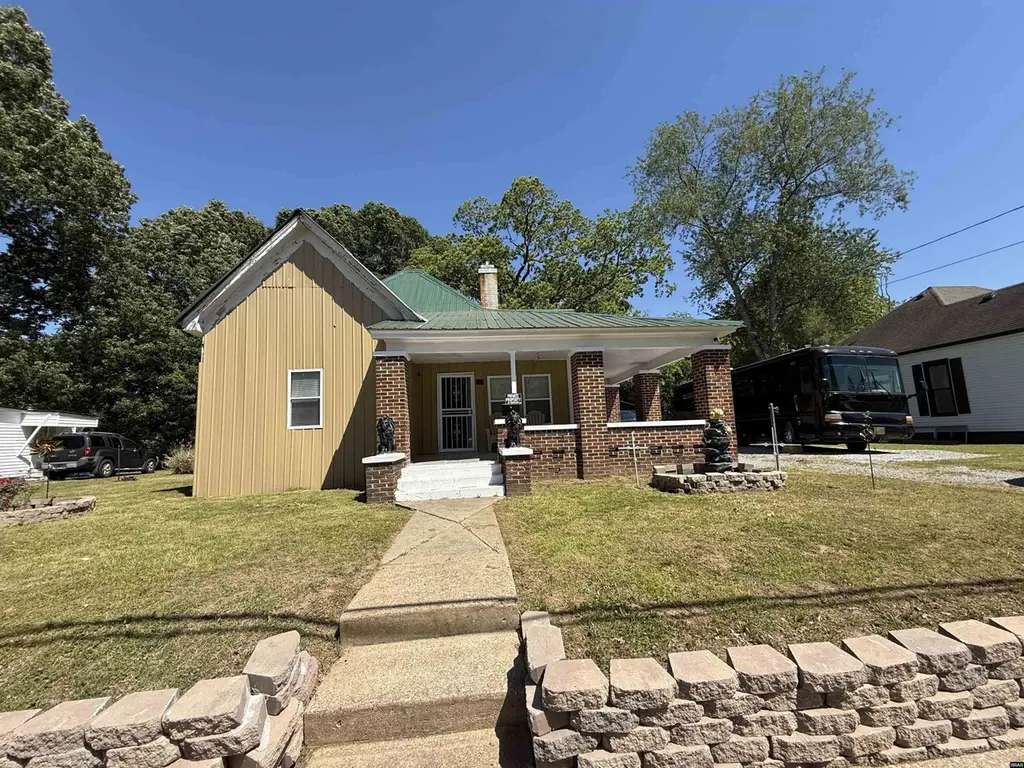
417 N Mccombs St · Martin, TN
Flood risk 1/10 · Minimal
- FEMA flood zone
- X (unshaded)
- Chance of flooding over 30 yrs
- 0.0%
- Est. flood insurance / yr
- $507 – $1,088
Fire risk 1/10 · Minimal
- Est. fire insurance / yr
- $949 – $1,763
Heat risk 6/10 · Moderate
- Hot days now (above 107°F)
- 7 days/yr
- Hot days in 30 yrs
- 21 days/yr
Wind risk 4/10 · Minor
- Chance of severe wind over 30 yrs
- 8.0%
Air-quality risk 1/10 · Minimal
- Unhealthy air days now
- 0 days/yr
- Unhealthy air days in 30 yrs
- 0 days/yr
Risk factors via First Street. Map © Google.
Why this score? — see what drove the D grade
The composite is a weighted blend of 9 inputs, each scored 0–100. Each bar is that input's sub-score; the figure is the points it added to the 100-point composite (weight × sub-score).
- Cash flow +17.1/30.0
- DSCR +5.3/10.0
- ARV discount +4.0/15.0
- 1% rule +3.8/10.0
- Livability +3.8/5.0
- Schools +3.0/10.0
- Rent growth +2.5/5.0
- Condition / age +2.5/5.0
- Appreciation +0.0/10.0
$159,000
🖨 Deal sheet 📄 Offer letter ✓ Due diligence
Listing remarks MLS
Large lot. Home has fire damage; being sold as is Information deemed reliable but not guaranteed
Key facts
- 0.31 acre lot
- Garage
- Built 1913
Property features AI
Finance
- Other: Listing broker: CENTURY 21 GOLDEN SERVICE REALTY
Exterior
- Parking: Detached 1-car garage
- Utilities: Public water; Public sewer
- Home design: Single-family residence; Single-story
- Construction: Aluminum siding; Metal roof; Crawl space foundation; Built as residential single family (up to 5 acres)
- Exterior features: Level lot; Paved road access
Interior
- Kitchen: Refrigerator; Range
- Bedrooms: Total of 5 rooms (includes bedrooms and living spaces)
- Flooring: See remarks
- Bathrooms: 2 full bathrooms
- Heating & cooling: Heat pump heating; Heat pump cooling; Ceiling fans
- Interior features: Blinds on windows; Fireplace with insert
- Laundry & utility: Washer; Dryer
Neighborhood map
What this means for you Summary
Snapshot
- This is a 3-bed/2.0-bath single-family listed at $159k.
Deal economics
- At list price, monthly cash flow is $110 ($1k/yr) — positive.
- The deal already cash-flows at list — no discount required.
- To meet the 1% rule (rent ≥ 1% of price), the offer needs to be $140k (12.1% below list).
- Recommended offer: $140k (12.1% below list) — sets the bar for 1% rule.
- Cap rate 7.1% vs local median 4.0% in Martin — top-decile yield for the area; either an underpriced asset or a hidden risk that comps aren't pricing in. Stress-test before assuming the spread holds.
Location & tenants
- Location reads 75/100 on livability (#15 in TN, #4,330 nationally) — a middle-class / working-renter tenant base. Strengths: cost of living A+, health & safety A+, housing B+; Watch: schools D+, commute F, employment F.
- Weakley County (rural): math 34% / reading 38% proficiency, ranked #32 of 139 in TN (top 23%) — families likely to look elsewhere, expect single-tenant / working-renter base with shorter leases.
- Market conditions: 85 active listings in the ZIP; 69 units permitted in Weakley County in 2024 (0 in 5+ unit buildings).
- This rent runs 32% of the median local income ($52k/yr) — at the standard rent-burdened threshold; future hikes will face affordability resistance.
Forward outlook
- Local home prices are declining (-3.0%/yr); year-one equity from $1k of loan paydown is wiped out by about $5k of value loss. Plan a longer hold.
- Weakley County population projected at -20% by 2050 — secular population decline; favor cash flow + early exit over multi-decade hold.
Negotiation context
- It's been on market 45 days — a 3% lower offer ($154k) is reasonable based on typical stale-listing flexibility.
- 2 sale attempts since 5y ago with the ask held roughly flat each time — persistent listings suggest the price (not the market) is what's stuck; bring a comps-based counter.
- Current owner paid $18k; list at $159k implies a 783% gain — meaningful room to come down on a strong offer.
Risks & watch-outs
- Watch-outs: built in 1913 — expect roof / HVAC / electrical / plumbing capex.
- Climate carrying-cost: extreme-heat days projected 7→21/yr by 2055 (HVAC capex compounding) — expect insurance premiums to compound above CPI over the hold.
Questions for the listing agent
- It's been on market 45 days. Have you received any prior offers? Is the seller open to a 12% concession, seller financing, or rate buy-down credit?
- Built in 1913 — when were the roof, HVAC, electrical panel, plumbing, and water heater last replaced?
- Is there a deadline driving the sale (1031 exchange, divorce, estate, relocation)? That informs how much negotiation room exists.
- Schools are D-rated, which usually means shorter tenancies and higher turnover. Who's the typical renter profile here, and what's been the actual vacancy rate?
- The area grade is low — what's the realistic commute time and amenity access for the typical tenant pool here? Any planned neighborhood developments (good or bad) we should know about?
- What's the average days-on-market for RENTAL listings here right now (not sales)? A rising rental-DOM trend means longer vacancies and softer asking-rent achievability than the comps imply.
- What's the recent tenant-quality profile in this submarket — average credit score on applications, eviction rate, late-payment / NSF rate, and stable-employment percentage? A property-management company in the area should have these aggregated.
- How much new for-sale + rental construction is in the pipeline within 1–3 miles? Heavy new supply typically softens prices + rents 12–24 months out; constrained supply supports both.
Investment metrics
- 1% rule
- 0.88% ✗
- Cap rate
- 7.12%
- Cash-on-cash
- 2.96%
- DSCR
- 1.13
- GRM
- 9.5
CMA / ARV
- ARV (median comp)
- $147,435
- List price
- $159,000
- Delta
- 7.84%
- Verdict
- FAIR
- Comps
- 20 within 1.0 mi
Show comp detail 12 sales within ~0.75 mi
| Address | Dist | Beds/Ba | Sqft | Sold | Price | $/sf | Match |
|---|---|---|---|---|---|---|---|
| 401 Jackson St | 0.10mi | 4/2.0 (+1) | 1,500 (+1%) | 7mo | $145,000 | $97 | 83 |
| 120 Church St | 0.36mi | 3/1.0 | 1,506 (+1%) | 10mo | $177,500 | $118 | 69 |
| 102 Virginia St | 0.56mi | 4/2.0 (+1) | 1,486 (+0%) | 4mo | $155,000 | $104 | 66 |
| 226 Marshall St | 0.70mi | 3/2.0 | 1,425 (-4%) | 2mo | $85,000 | $60 | 59 |
| 108 Gardner St | 0.52mi | 3/2.0 | 1,537 (+4%) | 14mo | $175,500 | $114 | 58 |
| 203 Summer St St | 0.60mi | 4/2.0 (+1) | 1,495 (+1%) | 10mo | $125,000 | $84 | 58 |
| 518 K St | 0.51mi | 3/1.0 | 1,352 (-9%) | 0mo | $190,000 | $141 | 57 |
| 206 Christine St | 0.60mi | 3/2.0 | 1,540 (+4%) | 13mo | $188,000 | $122 | 55 |
| 523 Olney St | 0.48mi | 3/1.5 | 1,596 (+8%) | 11mo | $202,500 | $127 | 54 |
| 218 Marshall St | 0.69mi | 3/2.5 | 1,632 (+10%) | 2mo | $171,500 | $105 | 48 |
| 108 Ruskin Dr | 0.67mi | 3/2.0 | 1,375 (-7%) | 11mo | $250,000 | $182 | 47 |
| 309 Summer St | 0.74mi | 2/1.0 (-1) | 1,359 (-8%) | 6mo | $156,000 | $115 | 37 |
Match score weights: distance 35% · size 25% · config 20% · recency 20%. Top-matched comps best support the ARV.
Projected returns pro-forma
-3.0% appreciation · 3.0% rent growth · sell at horizon
- IRR
- -11.7%
- Equity multiple
- 0.58×
- Total profit
- $-18,814
- Equity at exit
- $23,707
- IRR
- -2.5%
- Equity multiple
- 0.83×
- Total profit
- $-7,554
- Equity at exit
- $13,747
Cash invested: $44,520 (down + closing). Projections, not guarantees.
Landlord ↔ Tenant lean methodology
- Overall (STATE)
- 87 Strongly Landlord-Friendly
- State Tennessee
- 87 Strongly Landlord-Friendly · R+13
- County
- — inherits STATE
- City
- — inherits STATE
ZIP-level market 38237
- Home prices YoY
- -16.5%
- Active inventory
- 85
- Price-to-rent
- 9.5×
Monthly cashflow live
- Estimated rent
- $1,397 medium interval (Pro) →
- Mortgage (P&I)
- −$834
- Tax from tax record
- −$94 /mo · $1,127/yr
- Insurance
- −$66
- HOA
- −$0
- Vacancy / Maint / Mgmt
- −$293
- Net cashflow
- $110
Break-even live
UW: 25.0% down · 7.5% · 30yr · 1.5% tax · 5.0% vac · 8.0% maint · 8.0% mgmt
Financing live
Cash to close
- Down payment
- $39,750
- Closing costs
- $4,770
- Reserves months
- —
- Total cash needed
- —
Loan-product check · same deal, 3 products live
Conventional
25% down · 7.5% · 30yr
- Down + closing
- —
- Monthly P&I
- —
- Monthly cashflow
- —
- DSCR
- —
- Eligible?
- —
Personal DTI + credit; lowest rate.
DSCR
20% down · 8.5% · 30yr
- Down + closing
- —
- Monthly P&I
- —
- Monthly cashflow
- —
- DSCR
- —
- Eligible?
- —
No personal income docs; deal must DSCR.
Hard money
10% down · 12.0% · 12mo
- Down + closing
- —
- Monthly P&I
- —
- Monthly cashflow
- —
- DSCR
- —
- Eligible?
- —
Short-term bridge; refi at stabilization.
Listing history 18 events
-
2026-06-19days on market $159,000 Active 45 DOM
-
2026-06-18days on market $159,000 Active 44 DOM
-
2026-06-17days on market $159,000 Active 43 DOM
-
2026-06-16days on market $159,000 Active 42 DOM
-
2026-06-15days on market $159,000 Active 41 DOM
-
2026-06-14days on market $159,000 Active 39 DOM
-
2026-06-12days on market $159,000 Active 38 DOM
-
2026-06-09days on market $159,000 Active 35 DOM
-
2026-06-08days on market $159,000 Active 34 DOM
-
2026-06-07days on market $159,000 Active 33 DOM
-
2026-06-04days on market $159,000 Active 29 DOM
-
2026-06-02days on market $159,000 Active 28 DOM
-
2026-06-01days on market $159,000 Active 27 DOM
-
2026-05-31days on market $159,000 Active 26 DOM
-
2026-05-31days on market $159,000 Active 25 DOM
-
2026-05-05$159,000 Active 256-char remark
-
2022-05-27soldstatus $18,000 99-char remark
Show marketing remark (99 chars)
Large lot. Home has fire damage; being sold as is Information deemed reliable but not guaranteed
-
2021-07-29$25,000 99-char remark
Show marketing remark (99 chars)
Large lot. Home has fire damage; being sold as is Information deemed reliable but not guaranteed
ⓘ Source: listings_history table (triggers on properties + properties_extension) + one-shot
backfill from property_details.listing_events for pre-trigger history.
Tax reassessment forecast TN · Resets to sale price
- Current annual tax
- $1,127 · $94/mo
- Projected year-2 tax
- $1,129 · $94/mo
- Expected delta
- +$2/yr ($0/mo · 0.2%)
ⓘ Screening estimate from a state-policy table — verify with the county assessor before closing.
Climate risk First Street
- Flood 1/10 Low FEMA zone X (unshaded) · 0% chance over 30 yrs
- Wildfire 1/10 Low
- Heat 6/10 Major 7 d/yr ≥107°F today · 21 d/yr by 30 yrs out
- Wind 4/10 Moderate 8% chance of damaging wind over 30 yrs
- Air quality 1/10 Low 0 unhealthy d/yr today · 0 by 30 yrs out
Nearby sold comps map
Loading sold comps map…
Walkable amenities ~0.75 mi
Loading nearby amenities…
Taxation est. · year 1
- Rental income
- $16,766
- − Mortgage interest
- −$8,906
- − Property taxes
- −$1,127
- − Insurance
- −$795
- − Repairs & maintenance
- −$1,341
- − Management
- −$1,341
- − Depreciation
- −$4,625
- Taxable loss
- −$1,370
- Est. tax savings @ 24.0%
- +$329
- After-tax cash flow
- $1,647/yr
For passive investors: Depreciation is non-cash, so a rental often shows a tax loss while cash-flowing — sheltering income. Rental losses are passive: they offset passive income freely, and up to $25,000/yr can offset ordinary (W-2) income if you actively participate and your MAGI is under $100k (phasing out to $0 by $150k); unused losses carry forward. On sale, claimed depreciation is recaptured at up to 25%, and gains may owe capital-gains tax (a 1031 exchange can defer both). Figures are a year-1 estimate at your 24.0% rate — not tax advice; consult a CPA.
Schools (NCES district)
- District
- Weakley County
- NCES district ID
- 4704470
- Math proficiency
- 34% ▼ -10.00%
- Reading proficiency
- 38% ▼ -2.00%
- Median HH income
- $35,389
- Composite
- 29.77/100
- National rank
- #6434
- State rank
- #32 of 139 in TN
Livability — Martin
- Score
- 75/100
- State rank
- #15
- US rank
- #4330
Category grades
Schools grade is shown separately in the Schools card above.
Census & demographics
- Census place
- Martin, TN
- County
- Weakley County · 15,627 people
- City population
- 15,627
- Metro
- Martin, TN
- Population (ZIP)
- 15,627
- Household income
- $51,670
- Rent vs Own
- Severe rent burden
- 636.0
Population outlook (Weakley County) Hauer SSP2
- Today (2025)
- 31,862 people
- By 2030
- 30,688 · -3.7%
- By 2040
- 27,935 · -12.3%
- By 2050
- 25,485 · -20.0%
- By 2075
- 21,080 · -33.8%
- By 2100
- 18,214 · -42.8%
Race, ethnicity, and origin ACS 2023
- Neighborhood character
- Predominantly White (77%)
- Race & ethnicity
- White 77% Black 13% Two or more races 5% Hispanic / Latino 4% Asian 2%
- Common ancestry
- Slovak 2% Italian 1% Serbian 1%
- Foreign-born
- 4% · Canada, Vietnam, South Korea
- Languages at home
- 95% English-only · Spanish 2% Vietnamese 1% Other Indo-European 1%
Political lean MEDSL · Weakley
- 2024 margin
- Solid R (+58.4) · D 20.3% · R 78.7%
- 2008→2024 swing
- -27.2pp toward R · 2008: -31.1pp · 2024: -58.4pp
- All cycles
- 2024: R+58.4 2020: R+53.7 2016: R+51.4 2012: R+41.0 2008: R+31.1
Not yet ingested
- Civics
- —
Market trends
- HPI YoY
- ▼ -46.05%
- Current HPI
- 233.76
- Rent YoY
- —
- Metro
- Martin, TN
- State GDP YoY
- ▲ 2.78%
- F500 in state
- 22
Industry mix (Fortune 500 HQ in TN)
| Industry | F500 HQs | Revenue |
|---|---|---|
| Healthcare | 3 | $91B |
|
||
| Retail | 3 | $72B |
|
||
| Transportation / Logistics | 1 | $88B |
|
||
| Paper / Packaging | 1 | $19B |
|
||
| Insurance | 1 | $13B |
|
||
| Energy | 1 | $12B |
|
||
Price history
+536.0% since first listed3 events — show timeline
- 2026-05-05 Listed $159,000 RRAR as distributed by MLS GRID
- 2022-05-27 Sold (MLS) $18,000 RRAR as distributed by MLS GRID
- 2021-07-29 Listed $25,000 RRAR as distributed by MLS GRID
Property tax history
+10.4%/yrLatest (2025): $1,127 · +108.7% YoY. Source: county tax records.
Cash-flow waterfall
monthlySold comps — $/sqft
last 12 mo · ≤1 miLoading sold comps…