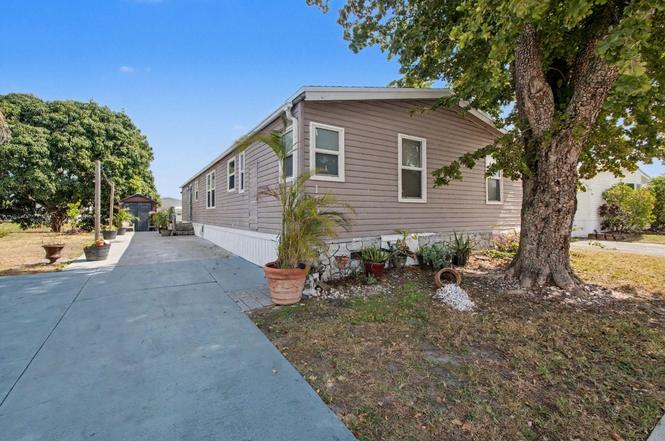
1700 SW 66th Ave · Hillsboro Pines, FL
Flood risk 1/10 · Minimal
- FEMA flood zone
- X (unshaded)
- Chance of flooding over 30 yrs
- 0.0%
- Est. flood insurance / yr
- $507 – $1,088
Fire risk 1/10 · Minimal
- Est. fire insurance / yr
- $947 – $1,759
Heat risk 9/10 · Severe
- Hot days now (above 107°F)
- 7 days/yr
- Hot days in 30 yrs
- 26 days/yr
Wind risk 10/10 · Severe
- Chance of severe wind over 30 yrs
- 99.0%
Air-quality risk 3/10 · Minor
- Unhealthy air days now
- 2 days/yr
- Unhealthy air days in 30 yrs
- 3 days/yr
Risk factors via First Street. Map © Google.
Why this score? — see what drove the C- grade
The composite is a weighted blend of 9 inputs, each scored 0–100. Each bar is that input's sub-score; the figure is the points it added to the 100-point composite (weight × sub-score).
- Cash flow +18.2/30.0
- ARV discount +7.5/15.0
- DSCR +5.7/10.0
- 1% rule +5.4/10.0
- Schools +4.3/10.0
- Livability +3.9/5.0
- Rent growth +3.4/5.0
- Condition / age +2.5/5.0
- Appreciation +0.0/10.0
$369,000
🖨 Deal sheet 📄 Offer letter ✓ Due diligence
Listing remarks MLS
Spacious 4 Bedroom 2 Bath with a water view in a great location in West Boca Raton. Large kitchen and living areas! Updated bathroom, new refrigerator, washer and dryer inside unit. Freshly painted!New gutters . All ages community.
Key facts
- 6,000 sq ft lot
- 2 parking spots
- Built 1992
Property features AI
Finance
- Financial info: Pets allowed with breed restrictions and a number limit
- HOA & community: Community association with sidewalks; Monthly association fee of 158
Exterior
- Parking: Two open parking spaces
- Utilities: Public water; Three-phase electric service; Water service available
- Home design: Manufactured home; Single-story; Faces west; Resale condition
- Construction: Modular / pre-fabricated construction; Composition shingle roof; Built with standard foundation
- Exterior features: Open patio; Patio
Interior
- Kitchen: Electric range; Microwave
- Bedrooms: Four bedrooms on the main level
- Flooring: Vinyl flooring
- Bathrooms: Two full bathrooms, both on the main level
- Heating & cooling: Central heating; Central air conditioning
- Interior features: Split bedroom layout; Drapes on windows; Unfurnished
- Laundry & utility: Laundry area inside; Electric water heater
Neighborhood map
What this means for you Summary
Snapshot
- This is a 4-bed/2.0-bath land listed at $369k.
Deal economics
- At list price, monthly cash flow is $332 ($4k/yr) — positive.
- The deal already cash-flows at list — no discount required.
- Meets the 1% rule at list price ($4k rent vs $369k).
- Recommended offer: $325k (12.0% below list) — sets the bar for market timing.
Location & tenants
- Location reads 78/100 on livability (#173 in FL, #2,634 nationally) — a middle-class / working-renter tenant base. Strengths: crime A+, employment A+, health & safety A+; Watch: amenities F, cost of living F.
- Palm Beach (suburban): math 46% / reading 53% proficiency, ranked #34 of 73 in FL (top 47%) — families likely to look elsewhere, expect single-tenant / working-renter base with shorter leases.
- Zoned schools: Hammock Pointe Elementary School (math 61% / reading 63%, grade B, #608 of 2,144 statewide, top 29%, 958 students, 42% FRL); Eagles Landing Middle School (math 66% / reading 67%, grade A-, #84 of 571 statewide, top 16%, 1,508 students, 27% FRL); Olympic Heights Community High (math 52% / reading 64%, grade C, #120 of 667 statewide, top 18%, 2,602 students, 30% FRL) — zoned schools average 33% FRL vs 52% district-wide (19 pts lower); this property's tenant base skews higher-income than the district average.
- Zoned-school proficiency averages 62% at this address vs 50% district-wide (+13 pts) — the actual schools serving this property are materially stronger than the Palm Beach average implies; a family-tenant draw the district grade alone would hide.
- Market conditions: Rents rising (+3.7%/yr); 267 active listings in the ZIP; 40 comparable units currently listed for rent nearby; rentals leasing fast (median 14d on market — plan ~1-2 weeks tenant-placement turnaround); solid renter incomes; 3,974 units permitted in Palm Beach County in 2024 (1,012 in 5+ unit buildings).
- At $3,846/mo this rent would consume 52% of the median local household income ($89k/yr) (locally 1990% of renters already pay >50% of income on rent) — very limited rent-growth headroom before tenants either downsize or default.
Forward outlook
- Local home prices are declining (-3.0%/yr); year-one equity from $3k of loan paydown is wiped out by about $11k of value loss. Plan a longer hold.
- Palm Beach County population projected at +30% by 2050 — long-run rental-demand tailwind backs the buy-and-hold thesis.
Negotiation context
- It's been on market 125 days — a 12% lower offer ($325k) is reasonable based on typical stale-listing flexibility.
- 12 sale attempts since 19y ago with the ask held roughly flat each time — persistent listings suggest the price (not the market) is what's stuck; bring a comps-based counter.
- Current owner paid $187k; list at $369k implies a 97% gain — meaningful room to come down on a strong offer.
Risks & watch-outs
- Climate carrying-cost: severe wind risk, 99% chance of damaging wind over 30y; extreme-heat days projected 7→26/yr by 2055 (HVAC capex compounding) — expect insurance premiums to compound above CPI over the hold.
Questions for the listing agent
- It's been on market 125 days. Have you received any prior offers? Is the seller open to a 12% concession, seller financing, or rate buy-down credit?
- What does the HOA fee cover, when was the last increase, and are there any pending special assessments or reserve-fund shortfalls?
- Why hasn't it sold? Are there any deal-killer items the seller is aware of (foundation, flood, title, zoning, code violations)?
- Is there a deadline driving the sale (1031 exchange, divorce, estate, relocation)? That informs how much negotiation room exists.
- Schools are A-rated — typically a magnet for longer-tenancy family renters. What's the average tenant stay here, and is there a school-zone premium baked into asking?
- What's the average days-on-market for RENTAL listings here right now (not sales)? A rising rental-DOM trend means longer vacancies and softer asking-rent achievability than the comps imply.
- What's the recent tenant-quality profile in this submarket — average credit score on applications, eviction rate, late-payment / NSF rate, and stable-employment percentage? A property-management company in the area should have these aggregated.
- How much new for-sale + rental construction is in the pipeline within 1–3 miles? Heavy new supply typically softens prices + rents 12–24 months out; constrained supply supports both.
Investment metrics
- 1% rule
- 1.04% ✓
- Cap rate
- 7.37%
- Cash-on-cash
- 3.85%
- DSCR
- 1.17
- GRM
- 8.0
CMA / ARV
No comps found within radius.
Projected returns pro-forma
-3.0% appreciation · 3.72% rent growth · sell at horizon
- IRR
- -9.4%
- Equity multiple
- 0.65×
- Total profit
- $-35,712
- Equity at exit
- $55,019
- IRR
- 1.1%
- Equity multiple
- 1.08×
- Total profit
- $8,410
- Equity at exit
- $31,904
Cash invested: $103,320 (down + closing). Projections, not guarantees.
Landlord ↔ Tenant lean methodology
- Overall (STATE)
- 87 Strongly Landlord-Friendly
- State Florida
- 87 Strongly Landlord-Friendly · R+3
- County
- — inherits STATE
- City
- — inherits STATE
ZIP-level market 33428
- Rents YoY
- 3.7%
- Active inventory
- 267
- Price-to-rent
- 8.0×
Monthly cashflow live
- Estimated rent
- $3,846 high interval (Pro) →
- Mortgage (P&I)
- −$1,935
- Tax from tax record
- −$460 /mo · $5,514/yr
- Insurance
- −$154
- HOA
- −$158
- Vacancy / Maint / Mgmt
- −$808
- Net cashflow
- $332
Break-even live
UW: 25.0% down · 7.5% · 30yr · 1.5% tax · 5.0% vac · 8.0% maint · 8.0% mgmt
Financing live
Cash to close
- Down payment
- $92,250
- Closing costs
- $11,070
- Reserves months
- —
- Total cash needed
- —
Loan-product check · same deal, 3 products live
Conventional
25% down · 7.5% · 30yr
- Down + closing
- —
- Monthly P&I
- —
- Monthly cashflow
- —
- DSCR
- —
- Eligible?
- —
Personal DTI + credit; lowest rate.
DSCR
20% down · 8.5% · 30yr
- Down + closing
- —
- Monthly P&I
- —
- Monthly cashflow
- —
- DSCR
- —
- Eligible?
- —
No personal income docs; deal must DSCR.
Hard money
10% down · 12.0% · 12mo
- Down + closing
- —
- Monthly P&I
- —
- Monthly cashflow
- —
- DSCR
- —
- Eligible?
- —
Short-term bridge; refi at stabilization.
Rent comps 40 comps
| Address | Beds | Baths | Sqft | Rent | $/sqft | DOM | Units | Dist |
|---|---|---|---|---|---|---|---|---|
| 10199 Akenside Dr Boca Raton, FL | 3.0 | 2.5 | 2020 | $4,850 | $2.40 | 7d | 1 | 0.29mi |
| 10222 Akenside Dr Boca Raton, FL | 3.0 | 2.5 | 2131 | $4,975 | $2.33 | 24d | 1 | 0.30mi |
| 10111 Akenside Dr Unit 10111 Boca Raton, FL | 3.0 | 2.5 | 1728 | $3,600 | $2.08 | 3d | 1 | 0.35mi |
| 10111 Akenside Dr Unit 10111 Boca Raton, FL | 3.0 | 2.5 | 1728 | $3,600 | $2.08 | 14d | 1 | 0.35mi |
| 22745 SW 65th Way Boca Raton, FL | 3.0 | 2.0 | 1477 | $3,500 | $2.37 | 2d | 1 | 0.36mi |
| 10106 Akenside Dr Boca Raton, FL | 3.0 | 2.5 | 2131 | $4,600 | $2.16 | 24d | 1 | 0.37mi |
| 10098 Akenside Dr Boca Raton, FL | 3.0 | 2.5 | 2131 | $4,500 | $2.11 | 5d | 1 | 0.38mi |
| 22682 Family Cir Unit 22682 Boca Raton, FL | 3.0 | 2.0 | 1425 | $3,400 | $2.39 | 13d | 1 | 0.43mi |
| 10112 Aqua Vista Way Boca Raton, FL | 3.0 | 2.0 | 1877 | $4,800 | $2.56 | 5d | 1 | 0.49mi |
| 10234 Sleepy Brook Way Boca Raton, FL | 3.0 | 2.0 | 1552 | $3,500 | $2.26 | 7d | 1 | 0.58mi |
| 9380 SW 61st Way Unit B Boca Raton, FL | 3.0 | 2.5 | 1593 | $2,900 | $1.82 | 24d | 1 | 0.61mi |
| 10669 Boca Entrada Blvd Boca Raton, FL | 3.0 | 2.0 | 1083 | $3,450 | $3.19 | 24d | 1 | 0.61mi |
| 9460 SW 61st Way Unit D Boca Raton, FL | 3.0 | 2.5 | 1600 | $2,900 | $1.81 | 24d | 1 | 0.68mi |
| 23392 Country Club Dr E Boca Raton, FL | 3.0 | 2.0 | 1200 | $3,500 | $2.92 | 18d | 1 | 0.73mi |
| 22465 SW 61st Way #247 Boca Raton, FL | 3.0 | 2.0 | 1407 | $2,700 | $1.92 | 24d | 1 | 0.74mi |
| 22465 SW 61st Way #247 Boca Raton, FL | 3.0 | 2.0 | 1407 | $2,600 | $1.85 | 3d | 1 | 0.74mi |
| 9260 Boca Vue Dr Boca Raton, FL | 1.0–3.0 | 1.0–2.0 | 1052 | $4,265 | $4.05 | 1d | 33 | 0.78mi |
| 5989 NW 74th St Parkland, FL | 4.0 | 2.0 | 2164 | $5,200 | $2.40 | 7d | 1 | 0.84mi |
| 5989 NW 74th St Parkland, FL | 4.0 | 2.0 | 2164 | $4,900 | $2.26 | 13d | 1 | 0.84mi |
| 9860 SW 3rd St Boca Raton, FL | 1.0–3.0 | 1.5–2.5 | 1222 | $3,397 | $2.78 | 1d | 36 | 0.85mi |
| 22974 Seaspray Pl Boca Raton, FL | 3.0 | 2.0 | 1080 | $2,200 | $2.04 | 12d | 1 | 0.87mi |
| 10180 Fanfare Dr Unit 10180 Boca Raton, FL | 3.0 | 2.0 | 1266 | $3,800 | $3.00 | 2d | 1 | 0.89mi |
| 10180 Fanfare Dr Unit 10180 Boca Raton, FL | 3.0 | 2.0 | 1266 | $3,800 | $3.00 | 1d | 1 | 0.89mi |
| 7374 NW 61st Ter Parkland, FL | 3.0 | 2.5 | 1776 | $3,750 | $2.11 | 24d | 1 | 0.93mi |
| 6534 NW 80th Dr Parkland, FL | 3.0 | 2.0 | 1661 | $4,500 | $2.71 | 13d | 1 | 0.94mi |
| 22447 SW 56th Ave Boca Raton, FL | 3.0 | 2.0 | 1831 | $3,400 | $1.86 | 24d | 1 | 0.95mi |
| 7525 NW 61st Ter #3103 Parkland, FL | 3.0 | 2.0 | 1760 | $3,200 | $1.82 | 7d | 1 | 0.97mi |
| 22800 SW 54th Way Boca Raton, FL | 3.0 | 2.0 | 1554 | $3,400 | $2.19 | 16d | 1 | 0.98mi |
| 5201 W Hillsboro Blvd Coconut Creek, FL | 1.0–3.0 | 1.0–2.0 | 1072 | $3,628 | $3.38 | 1d | 28 | 1.02mi |
| 23312 SW 53rd Ave Unit C Boca Raton, FL | 3.0 | 2.5 | 1412 | $3,100 | $2.20 | 24d | 1 | 1.02mi |
| 9244 SW 2nd St Boca Raton, FL | 3.0 | 2.0 | 1480 | $3,300 | $2.23 | 24d | 1 | 1.04mi |
| 22776 Neptune Rd Boca Raton, FL | 3.0 | 2.0 | 1288 | $2,900 | $2.25 | 24d | 1 | 1.05mi |
| 22062 Acapulco Ct Boca Raton, FL | 3.0 | 2.0 | 1184 | $3,650 | $3.08 | 24d | 1 | 1.15mi |
| 6950 Long Pine Cir Unit 6950 Coconut Creek, FL | 3.0 | 2.5 | 1449 | $3,200 | $2.21 | 14d | 1 | 1.15mi |
| 22028 Acapulco Ct Boca Raton, FL | 5.0 | 3.0 | 1697 | $3,600 | $2.12 | 24d | 1 | 1.18mi |
| 6979 Pines Cir Unit 35 Coconut Creek, FL | 3.0 | 2.5 | 1734 | $3,550 | $2.05 | 10d | 1 | 1.21mi |
| 4538 Albedo St Boca Raton, FL | 3.0 | 2.0 | 1146 | $3,400 | $2.97 | 19d | 1 | 1.29mi |
| 10884 Gantry St Boca Raton, FL | 4.0 | 2.0 | 1356 | $4,200 | $3.10 | 4d | 1 | 1.36mi |
| 11143 Model Cir E Boca Raton, FL | 3.0 | 2.0 | 1116 | $3,350 | $3.00 | 24d | 1 | 1.40mi |
| 22592 Lombard Ave Boca Raton, FL | 4.0 | 2.0 | 1369 | $4,100 | $2.99 | 2d | 1 | 1.40mi |
HOA detail
- Monthly dues
- $158 · $1,896/yr
- Likely covers
- water
Listing history 49 events
-
2026-06-18days on market $369,000 Active 125 DOM
-
2026-06-17days on market $369,000 Active 124 DOM
-
2026-06-16days on market $369,000 Active 123 DOM
-
2026-06-15days on market $369,000 Active 122 DOM
-
2026-06-13days on market $369,000 Active 120 DOM
-
2026-06-09remarks 699-char remark
-
2026-06-09days on market $369,000 Active 116 DOM
-
2026-06-07days on market $369,000 Active 114 DOM
-
2026-06-04days on market $369,000 Active 111 DOM
-
2026-06-03days on market $369,000 Active 110 DOM
-
2026-06-01days on market $369,000 Active 108 DOM
-
2026-05-31days on market $369,000 Active 107 DOM
-
2026-03-16price $369,000
-
2026-02-13$375,000 Active
-
2026-02-11historical $375,000
-
2025-06-08historical
-
2025-02-08price $340,000
-
2025-02-08status Active
-
2024-11-11status Pending
-
2024-10-30status Active
-
2024-09-13status Pending
-
2024-08-22price $333,000
-
2024-08-21status Active
-
2024-08-05status Pending
-
2024-07-19status Active
-
2024-06-27status Pending
-
2024-06-08$350,000 Active
-
2020-12-07soldstatus $187,000
-
2020-11-20soldstatus $187,000 Closed 231-char remark
Show marketing remark (231 chars)
Spacious 4 Bedroom 2 Bath with a water view in a great location in West Boca Raton. Large kitchen and living areas! Updated bathroom, new refrigerator, washer and dryer inside unit. Freshly painted!New gutters . All ages community.
-
2020-10-09status Pending 231-char remark
Show marketing remark (231 chars)
Spacious 4 Bedroom 2 Bath with a water view in a great location in West Boca Raton. Large kitchen and living areas! Updated bathroom, new refrigerator, washer and dryer inside unit. Freshly painted!New gutters . All ages community.
-
2020-09-21price $185,000 231-char remark
Show marketing remark (231 chars)
Spacious 4 Bedroom 2 Bath with a water view in a great location in West Boca Raton. Large kitchen and living areas! Updated bathroom, new refrigerator, washer and dryer inside unit. Freshly painted!New gutters . All ages community.
-
2020-09-07$192,000 Active 231-char remark
Show marketing remark (231 chars)
Spacious 4 Bedroom 2 Bath with a water view in a great location in West Boca Raton. Large kitchen and living areas! Updated bathroom, new refrigerator, washer and dryer inside unit. Freshly painted!New gutters . All ages community.
-
2017-10-19soldstatus $137,000
-
2017-10-17soldstatus $137,000 Closed
-
2017-09-03historical Contingent
-
2017-05-09$140,000 Active
-
2016-03-03soldstatus $73,000
-
2009-04-16soldstatus $65,000
-
2009-04-01historical
-
2009-03-06$97,700
-
2009-01-27historical
-
2008-11-19$99,000
-
2008-07-21historical
-
2008-04-19$135,000
-
2008-04-05historical
-
2007-09-12$137,700
-
1997-11-03soldstatus $75,000
-
1986-05-01soldstatus $32,000
-
1983-03-01soldstatus $30,000
ⓘ Source: listings_history table (triggers on properties + properties_extension) + one-shot
backfill from property_details.listing_events for pre-trigger history.
Tax reassessment forecast FL · Resets to sale price
- Current annual tax
- $5,514 · $460/mo
- Projected year-2 tax
- $5,514 · $460/mo
- Expected delta
- $0/yr ($0/mo · 0.0%)
ⓘ Screening estimate from a state-policy table — verify with the county assessor before closing.
Climate risk First Street
- Flood 1/10 Low FEMA zone X (unshaded) · 0% chance over 30 yrs
- Wildfire 1/10 Low
- Heat 9/10 Extreme 7 d/yr ≥107°F today · 26 d/yr by 30 yrs out
- Wind 10/10 Extreme 99% chance of damaging wind over 30 yrs
- Air quality 3/10 Moderate 2 unhealthy d/yr today · 3 by 30 yrs out
Nearby sold comps map
Loading sold comps map…
Walkable amenities ~0.75 mi
Loading nearby amenities…
Taxation est. · year 1
- Rental income
- $46,146
- − Mortgage interest
- −$20,670
- − Property taxes
- −$5,514
- − Insurance
- −$1,845
- − Repairs & maintenance
- −$3,692
- − Management
- −$3,692
- − HOA
- −$1,896
- − Depreciation
- −$10,735
- Taxable loss
- −$1,896
- Est. tax savings @ 24.0%
- +$455
- After-tax cash flow
- $4,435/yr
For passive investors: Depreciation is non-cash, so a rental often shows a tax loss while cash-flowing — sheltering income. Rental losses are passive: they offset passive income freely, and up to $25,000/yr can offset ordinary (W-2) income if you actively participate and your MAGI is under $100k (phasing out to $0 by $150k); unused losses carry forward. On sale, claimed depreciation is recaptured at up to 25%, and gains may owe capital-gains tax (a 1031 exchange can defer both). Figures are a year-1 estimate at your 24.0% rate — not tax advice; consult a CPA.
Schools (NCES district)
- District
- Palm Beach
- NCES district ID
- 1201500
- Math proficiency
- 46% ▼ -16.00%
- Reading proficiency
- 53% ▼ -4.00%
- Median HH income
- $53,943
- Composite
- 42.72/100
- National rank
- #3160
- State rank
- #34 of 73 in FL
Livability — Hillsboro Pines
- Score
- 78/100
- State rank
- #173
- US rank
- #2634
Category grades
Schools grade is shown separately in the Schools card above.
Census & demographics
- County
- Palm Beach County · 1,438,312 people
- Metro
- Miami-Fort Lauderdale-Pompano Beach, FL
- Population (ZIP)
- 47,588
- Household income
- $88,543
- Rent vs Own
- Severe rent burden
- 1990.0
Population outlook (Palm Beach County) Hauer SSP2
- Today (2025)
- 1,637,487 people
- By 2030
- 1,743,255 · +6.5%
- By 2040
- 1,948,712 · +19.0%
- By 2050
- 2,132,979 · +30.3%
- By 2075
- 2,530,027 · +54.5%
- By 2100
- 2,706,979 · +65.3%
Race, ethnicity, and origin ACS 2023
- Neighborhood character
- Diverse neighborhood (Simpson 0.69)
- Race & ethnicity
- White 50% Two or more races 23% Hispanic / Latino 22% Black 7% Asian 5%
- Hispanic origin (detail)
- Mexican 3% Puerto Rican 3% Cuban 2% Dominican 1%
- Common ancestry
- Estonian 12% Romanian 3% Scotch-Irish 3%
- Foreign-born
- 37% · Canada, Jamaica, Vietnam
- Languages at home
- 55% English-only · Spanish 19% Other Indo-European 17% French/Haitian/Cajun 2%
Political lean MEDSL · Palm Beach
- 2024 margin
- Toss-up / Even · D 50.0% · R 49.2%
- 2008→2024 swing
- -22.1pp toward R · 2008: 22.9pp · 2024: 0.8pp
- All cycles
- 2024: D+0.8 2020: D+12.8 2016: D+15.3 2012: D+17.0 2008: D+22.9
Not yet ingested
- Civics
- —
Market trends
- HPI YoY
- ▼ -299.00%
- Current HPI
- 373.2649
- Rent YoY
- ▲ 3.72%
- Metro
- Miami-Fort Lauderdale-Pompano Beach, FL
- State GDP YoY
- ▲ 3.28%
- F500 in state
- 36
Industry mix (Fortune 500 HQ in FL)
| Industry | F500 HQs | Revenue |
|---|---|---|
| Industrial Technology | 2 | $29B |
|
||
| Insurance | 2 | $17B |
|
||
| Retail | 1 | $60B |
|
||
| Technology Distribution | 1 | $58B |
|
||
| Homebuilding | 1 | $35B |
|
||
| Technology Manufacturing | 1 | $35B |
|
||
Price history
+1130.0% since first listed37 events — show timeline
- 2026-03-16 Price Changed $369,000 Beaches MLS
- 2026-02-13 Listed $375,000 Beaches MLS
- 2026-02-11 Coming Soon $375,000 Beaches MLS
- 2025-06-08 Listing Removed — Beaches MLS
- 2025-02-08 Price Changed $340,000 Beaches MLS
- 2025-02-08 Relisted — Beaches MLS
- 2024-11-11 Pending — Beaches MLS
- 2024-10-30 Relisted — Beaches MLS
- 2024-09-13 Pending — Beaches MLS
- 2024-08-22 Price Changed $333,000 Beaches MLS
- 2024-08-21 Relisted — Beaches MLS
- 2024-08-05 Pending — Beaches MLS
- 2024-07-19 Relisted — Beaches MLS
- 2024-06-27 Pending — Beaches MLS
- 2024-06-08 Listed $350,000 Beaches MLS
- 2020-12-07 Sold (Public Records) $187,000 Public Records
- 2020-11-20 Sold (MLS) $187,000 Beaches MLS
- 2020-10-09 Pending — Beaches MLS
- 2020-09-21 Price Changed $185,000 Beaches MLS
- 2020-09-07 Listed $192,000 Beaches MLS
- 2017-10-19 Sold (Public Records) $137,000 Public Records
- 2017-10-17 Sold (MLS) $137,000 Beaches MLS
- 2017-09-03 Contingent — Beaches MLS
- 2017-05-09 Listed $140,000 Beaches MLS
- 2016-03-03 Sold (Public Records) $73,000 Public Records
- 2009-04-16 Sold (MLS) $65,000 Beaches MLS
- 2009-04-01 Listing Removed — Beaches MLS
- 2009-03-06 Listed $97,700 Beaches MLS
- 2009-01-27 Listing Removed — Beaches MLS
- 2008-11-19 Listed $99,000 Beaches MLS
- 2008-07-21 Listing Removed — Beaches MLS
- 2008-04-19 Listed $135,000 Beaches MLS
- 2008-04-05 Listing Removed — Beaches MLS
- 2007-09-12 Listed $137,700 Beaches MLS
- 1997-11-03 Sold (Public Records) $75,000 Public Records
- 1986-05-01 Sold (Public Records) $32,000 Public Records
- 1983-03-01 Sold (Public Records) $30,000 Public Records
Property tax history
+12.8%/yrLatest (2025): $5,514 · +1.4% YoY. Source: county tax records.
Cash-flow waterfall
monthlySold comps — $/sqft
last 12 mo · ≤1 miLoading sold comps…