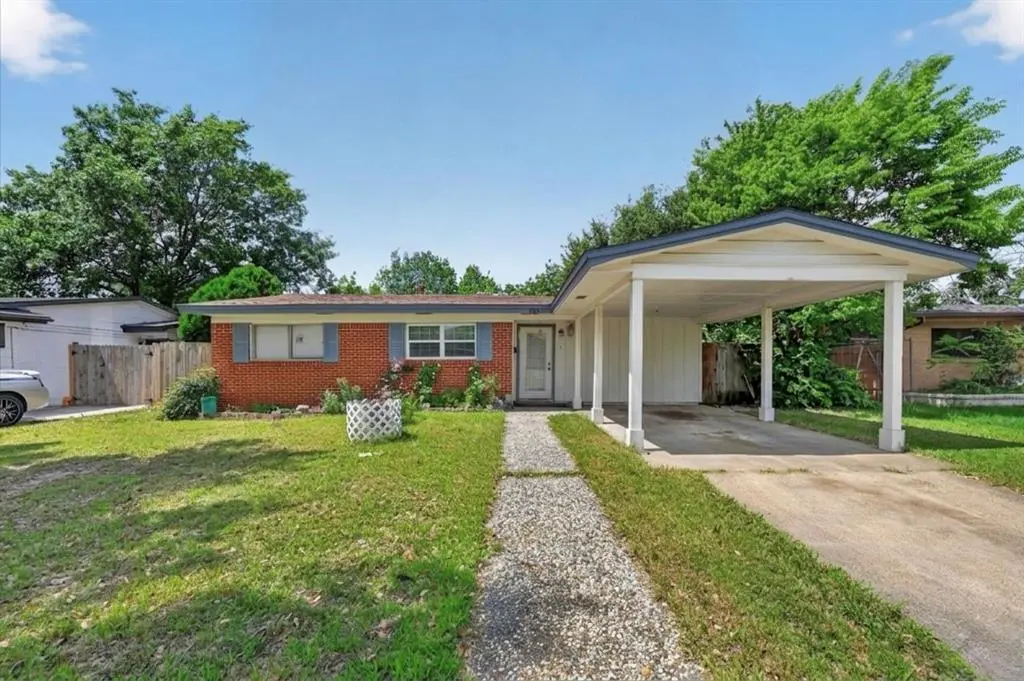
1403 Beacon Hill Dr · Irving, TX
Flood risk 1/10 · Minimal
- FEMA flood zone
- X (unshaded)
- Chance of flooding over 30 yrs
- 0.0%
- Est. flood insurance / yr
- $507 – $1,088
Fire risk 1/10 · Minimal
- Est. fire insurance / yr
- $1,222 – $2,270
Heat risk 7/10 · Major
- Hot days now (above 110°F)
- 7 days/yr
- Hot days in 30 yrs
- 23 days/yr
Wind risk 6/10 · Moderate
- Chance of severe wind over 30 yrs
- 27.0%
Air-quality risk 3/10 · Minor
- Unhealthy air days now
- 2 days/yr
- Unhealthy air days in 30 yrs
- 3 days/yr
Risk factors via First Street. Map © Google.
Why this score? — see what drove the D- grade
The composite is a weighted blend of 9 inputs, each scored 0–100. Each bar is that input's sub-score; the figure is the points it added to the 100-point composite (weight × sub-score).
- ARV discount +15.0/15.0
- Cash flow +8.0/30.0
- Livability +4.0/5.0
- 1% rule +3.4/10.0
- Rent growth +2.7/5.0
- Condition / age +2.5/5.0
- DSCR +2.0/10.0
- Schools +1.9/10.0
- Appreciation +0.0/10.0
$199,900
🖨 Deal sheet 📄 Offer letter ✓ Due diligence
Listing remarks MLS
Charming home looking for their new owners. Come bring your vision and with a little tlc this gem will be a delight! This home features 4 bedrooms and 1 full bath. The formal dinning room was made into a bedroom, it has a build in closet. Enjoy your evenings in the immaculate backyard. This home is being sold as is. There are nearby schools, shopping and public transportation. This home is located right across from Irving Blvd, very close to the shopping and restaurants.Pictures are coming soon.
Key facts
- Close to restaurants
- Immaculate backyard
- Close to shopping
Tags
Neighborhood map
What this means for you Summary
Snapshot
- This is a 3-bed/1.0-bath single-family listed at $200k.
Deal economics
- At list price, monthly cash flow is $-208 ($-2k/yr) — negative.
- To cash-flow at today's rent, offer at most $163k (18.4% below list).
- To meet the 1% rule (rent ≥ 1% of price), the offer needs to be $167k (16.2% below list).
- Recommended offer: $163k (18.4% below list) — sets the bar for cash-flow.
- Cap rate 5.0% vs local median 2.6% in Irving — top-decile yield for the area; either an underpriced asset or a hidden risk that comps aren't pricing in. Stress-test before assuming the spread holds.
Location & tenants
- Location reads 80/100 on livability (#45 in TX, #1,913 nationally) — a professional / high-income tenant draw. Strengths: commute A+, cost of living A+, housing A+; Watch: amenities C-.
- Irving ISD (urban): math 19% / reading 25% proficiency, ranked #751 of 826 in TX (top 91%) — low school quality limits family demand, transient renter base, plan for 1-2y turnover; 72% free/reduced lunch — lower-income household profile, screen leases tightly.
- Market conditions: Rents flat; 101 active listings in the ZIP; 31 comparable units currently listed for rent nearby; rentals at typical pace (median 19d on market — plan ~3-4 weeks tenant-placement turnaround); 12,577 units permitted in Dallas County in 2024 (6,829 in 5+ unit buildings).
- This rent runs 31% of the median local income ($64k/yr) — at the standard rent-burdened threshold; future hikes will face affordability resistance.
Forward outlook
- Local home prices are declining (-3.0%/yr); year-one equity from $1k of loan paydown is wiped out by about $6k of value loss. Plan a longer hold.
- Dallas County population projected at +35% by 2050 — long-run rental-demand tailwind backs the buy-and-hold thesis.
Negotiation context
- It's been on market 72 days — a 6% lower offer ($188k) is reasonable based on typical stale-listing flexibility.
- 3 sale attempts since 24y ago with the ask held roughly flat each time — persistent listings suggest the price (not the market) is what's stuck; bring a comps-based counter.
Risks & watch-outs
- Watch-outs: built in 1957 — expect roof / HVAC / electrical / plumbing capex.
- Climate carrying-cost: major wind risk, 27% chance of damaging wind over 30y; extreme-heat days projected 7→23/yr by 2055 (HVAC capex compounding) — expect insurance premiums to compound above CPI over the hold.
Questions for the listing agent
- What do current leases actually rent for vs. the listed asking? Can we see a recent rent roll and the last 12 months of T-12 income?
- It's been on market 72 days. Have you received any prior offers? Is the seller open to a 18% concession, seller financing, or rate buy-down credit?
- Built in 1957 — when were the roof, HVAC, electrical panel, plumbing, and water heater last replaced?
- Why hasn't it sold? Are there any deal-killer items the seller is aware of (foundation, flood, title, zoning, code violations)?
- Is there a deadline driving the sale (1031 exchange, divorce, estate, relocation)? That informs how much negotiation room exists.
- The area grade is low — what's the realistic commute time and amenity access for the typical tenant pool here? Any planned neighborhood developments (good or bad) we should know about?
- What's the average days-on-market for RENTAL listings here right now (not sales)? A rising rental-DOM trend means longer vacancies and softer asking-rent achievability than the comps imply.
- What's the recent tenant-quality profile in this submarket — average credit score on applications, eviction rate, late-payment / NSF rate, and stable-employment percentage? A property-management company in the area should have these aggregated.
- How much new for-sale + rental construction is in the pipeline within 1–3 miles? Heavy new supply typically softens prices + rents 12–24 months out; constrained supply supports both.
Investment metrics
- 1% rule
- 0.84% ✗
- Cap rate
- 5.04%
- Cash-on-cash
- -4.46%
- DSCR
- 0.80
- GRM
- 10.0
CMA / ARV
- ARV (median comp)
- $274,651
- List price
- $199,900
- Delta
- -27.22%
- Verdict
- UNDERPRICED
- Comps
- 20 within 1.0 mi
Show comp detail 12 sales within ~0.75 mi
| Address | Dist | Beds/Ba | Sqft | Sold | Price | $/sf | Match |
|---|---|---|---|---|---|---|---|
| 1808 Salem St | 0.29mi | 3/1.0 | 1,185 (+6%) | 8mo | $279,000 | $235 | 69 |
| 1802 Bradford St | 0.58mi | 3/1.0 | 1,159 (+4%) | 2mo | $246,000 | $212 | 65 |
| 1826 Salem St | 0.32mi | 3/1.0 | 1,237 (+11%) | 7mo | $235,000 | $190 | 62 |
| 1710 Plymouth Dr N | 0.49mi | 3/1.0 | 1,183 (+6%) | 8mo | $230,000 | $194 | 61 |
| 1821 Bunker Hill Dr | 0.31mi | 3/1.0 | 1,194 (+7%) | 19mo | $295,000 | $247 | 58 |
| 1213 Mohawk Dr | 0.10mi | 3/2.0 | 1,250 (+12%) | 17mo | $329,900 | $264 | 57 |
| 1516 Priscilla Ln | 0.64mi | 3/1.0 | 1,065 (-5%) | 8mo | $289,999 | $272 | 56 |
| 1529 John Smith Dr | 0.51mi | 3/1.0 | 1,090 (-2%) | 22mo | $229,900 | $211 | 54 |
| 1821 Salem St | 0.33mi | 3/1.0 | 1,233 (+10%) | 21mo | $296,000 | $240 | 50 |
| 701 Fouts Dr | 0.62mi | 3/2.0 | 1,176 (+5%) | 16mo | $235,000 | $200 | 45 |
| 1605 Plymouth Dr N | 0.46mi | 3/1.0 | 1,256 (+12%) | 19mo | $299,999 | $239 | 41 |
| 3020 Conflans Rd | 0.57mi | 2/1.0 (-1) | 1,000 (-10%) | 15mo | $249,000 | $249 | 39 |
Match score weights: distance 35% · size 25% · config 20% · recency 20%. Top-matched comps best support the ARV.
Projected returns pro-forma
-3.0% appreciation · 0.72% rent growth · sell at horizon
- IRR
- -26.7%
- Equity multiple
- 0.12×
- Total profit
- $-49,288
- Equity at exit
- $29,806
- IRR
- -35.6%
- Equity multiple
- -0.33×
- Total profit
- $-74,235
- Equity at exit
- $17,284
Cash invested: $55,972 (down + closing). Projections, not guarantees.
Landlord ↔ Tenant lean methodology
- Overall (STATE)
- 87 Strongly Landlord-Friendly
- State Texas
- 87 Strongly Landlord-Friendly · R+5
- County
- — inherits STATE
- City
- — inherits STATE
ZIP-level market 75061
- Rents YoY
- 0.7%
- Active inventory
- 101
- Price-to-rent
- 10.0×
Monthly cashflow live
- Estimated rent
- $1,674 high interval (Pro) →
- Mortgage (P&I)
- −$1,048
- Tax from tax record
- −$399 /mo · $4,790/yr
- Insurance
- −$83
- HOA
- −$0
- Vacancy / Maint / Mgmt
- −$352
- Net cashflow
- $-208
Break-even live
UW: 25.0% down · 7.5% · 30yr · 1.5% tax · 5.0% vac · 8.0% maint · 8.0% mgmt
Financing live
Cash to close
- Down payment
- $49,975
- Closing costs
- $5,997
- Reserves months
- —
- Total cash needed
- —
Loan-product check · same deal, 3 products live
Conventional
25% down · 7.5% · 30yr
- Down + closing
- —
- Monthly P&I
- —
- Monthly cashflow
- —
- DSCR
- —
- Eligible?
- —
Personal DTI + credit; lowest rate.
DSCR
20% down · 8.5% · 30yr
- Down + closing
- —
- Monthly P&I
- —
- Monthly cashflow
- —
- DSCR
- —
- Eligible?
- —
No personal income docs; deal must DSCR.
Hard money
10% down · 12.0% · 12mo
- Down + closing
- —
- Monthly P&I
- —
- Monthly cashflow
- —
- DSCR
- —
- Eligible?
- —
Short-term bridge; refi at stabilization.
Rent comps 31 comps
| Address | Beds | Baths | Sqft | Rent | $/sqft | DOM | Units | Dist |
|---|---|---|---|---|---|---|---|---|
| 2800 W Pioneer Dr Irving, TX | 2.0 | 1.0–2.0 | 806 | $1,250 | $1.55 | 2d | 3 | 0.15mi |
| 2871 W Pioneer Dr Irving, TX | 1.0–3.0 | 1.0–2.0 | 706 | $1,625 | $2.30 | 3d | 1 | 0.22mi |
| 2934 W Pioneer Dr Irving, TX | 1.0–2.0 | 1.0 | 675 | $1,200 | $1.78 | 43d | 1 | 0.30mi |
| 3200 W Pioneer Dr Irving, TX | 1.0–2.0 | 1.0–2.0 | 818 | $1,575 | $1.93 | 21d | 4 | 0.58mi |
| 3031 Lela St Irving, TX | 3.0 | 2.0 | 1242 | $2,150 | $1.73 | 43d | 1 | 0.61mi |
| 2138 Onetta Dr Irving, TX | 3.0 | 2.0 | 1467 | $2,085 | $1.42 | 24d | 1 | 0.71mi |
| 110 Crandall Rd Unit 112-Right Side Irving, TX | 3.0 | 2.5 | 1425 | $1,975 | $1.39 | 43d | 1 | 0.90mi |
| 3015 Tudor Ln Irving, TX | 3.0 | 2.5 | 1409 | $2,350 | $1.67 | 43d | 1 | 1.01mi |
| 2213 Jimmydee Dr Irving, TX | 3.0 | 2.0 | 1393 | $2,400 | $1.72 | 14d | 1 | 1.02mi |
| 3701 W Pioneer Dr Irving, TX | 1.0–2.0 | 1.0–2.0 | 758 | $1,779 | $2.35 | 1d | 29 | 1.03mi |
| 3024 Tudor Ln Unit 102 Irving, TX | 2.0 | 2.0 | 1100 | $1,500 | $1.36 | 6d | 1 | 1.04mi |
| 3024 Tudor Ln Unit 101 Irving, TX | 2.0 | 2.0 | 1100 | $1,375 | $1.25 | 43d | 1 | 1.04mi |
| 1928 Rock Island Rd Irving, TX | 2.0 | 1.0 | 880 | $1,400 | $1.59 | 1d | 1 | 1.08mi |
| 210 Rolston Rd Unit 1 Irving, TX | 2.0 | 2.0 | 1072 | $1,600 | $1.49 | 19d | 1 | 1.09mi |
| 210 Rolston Rd Unit 4 Irving, TX | 2.0 | 2.0 | 1072 | $1,600 | $1.49 | 43d | 1 | 1.10mi |
| 2529 Rutgers Dr Irving, TX | 4.0 | 2.0 | 1122 | $2,350 | $2.09 | 13d | 1 | 1.10mi |
| 2002 Rock Island Rd Irving, TX | 1.0–3.0 | 1.0–2.0 | 880 | $1,655 | $1.88 | 1d | 7 | 1.11mi |
| 1814 Estrada Pkwy Irving, TX | 1.0–2.0 | 1.0–2.0 | 826 | $1,619 | $1.96 | 2d | 26 | 1.14mi |
| 3860 Evergreen St Irving, TX | 1.0–2.0 | 1.0–2.0 | 763 | $1,600 | $2.10 | 21d | 5 | 1.17mi |
| 3860 Evergreen St Irving, TX | 1.0–2.0 | 1.0–2.0 | 763 | $1,450 | $1.90 | 17d | 4 | 1.17mi |
| 3132 Helmet St Irving, TX | 3.0 | 2.0 | 1268 | $2,000 | $1.58 | 18d | 1 | 1.17mi |
| 211 Wanda Dr Irving, TX | 2.0 | 1.0 | 979 | $2,375 | $2.43 | 43d | 1 | 1.17mi |
| 313 Rolston Rd Unit 315-102 Irving, TX | 2.0 | 1.5 | 875 | $1,100 | $1.26 | 43d | 1 | 1.22mi |
| 1900 Estrada Pkwy Irving, TX | 1.0–2.0 | 1.0–2.0 | 669 | $1,395 | $2.08 | 1d | 20 | 1.24mi |
| 111 Saint Clair Dr E Irving, TX | 3.0 | 2.0 | 1362 | $2,500 | $1.84 | 43d | 1 | 1.25mi |
| 3301 Elder Ct Irving, TX | 2.0 | 2.0 | 1154 | $1,475 | $1.28 | 43d | 1 | 1.31mi |
| 4047 Evergreen St Irving, TX | 2.0 | 2.0 | 1200 | $1,499 | $1.25 | 15d | 1 | 1.35mi |
| 2053 Estrada Pkwy Irving, TX | 1.0–2.0 | 1.0–2.0 | 678 | $1,725 | $2.54 | 24d | 1 | 1.36mi |
| 2115 Estrada Pkwy Irving, TX | 1.0–2.0 | 1.0–2.0 | 780 | $1,470 | $1.88 | 1d | 16 | 1.39mi |
| 2053 Estrada Pkwy Irving, TX | 1.0–2.0 | 1.0–2.0 | 678 | $1,725 | $2.54 | 6d | 10 | 1.41mi |
| 700 S Story Rd Irving, TX | 1.0–2.0 | 1.0–2.5 | 968 | $1,645 | $1.70 | 5d | 15 | 1.44mi |
Listing history 21 events
-
2026-06-18days on market $199,900 Active 72 DOM
-
2026-06-17days on market $199,900 Active 71 DOM
-
2026-06-16days on market $199,900 Active 70 DOM
-
2026-06-15days on market $199,900 Active 69 DOM
-
2026-06-13days on market $199,900 Active 67 DOM
-
2026-06-13days on market $199,900 Active 66 DOM
-
2026-06-09days on market $199,900 Active 63 DOM
-
2026-06-08days on market $199,900 Active 62 DOM
-
2026-06-07days on market $199,900 Active 61 DOM
-
2026-06-04days on market $199,900 Active 58 DOM
-
2026-06-03days on market $199,900 Active 57 DOM
-
2026-06-02days on market $199,900 Active 56 DOM
-
2026-06-01days on market $199,900 Active 55 DOM
-
2026-05-31days on market $199,900 Active 54 DOM
-
2026-04-19status Active 500-char remark
Show marketing remark (500 chars)
Charming home looking for their new owners. Come bring your vision and with a little tlc this gem will be a delight! This home features 4 bedrooms and 1 full bath. The formal dinning room was made into a bedroom, it has a build in closet. Enjoy your evenings in the immaculate backyard. This home is being sold as is. There are nearby schools, shopping and public transportation. This home is located right across from Irving Blvd, very close to the shopping and restaurants.Pictures are coming soon.
-
2026-04-14historical Active Option Contract 500-char remark
Show marketing remark (500 chars)
Charming home looking for their new owners. Come bring your vision and with a little tlc this gem will be a delight! This home features 4 bedrooms and 1 full bath. The formal dinning room was made into a bedroom, it has a build in closet. Enjoy your evenings in the immaculate backyard. This home is being sold as is. There are nearby schools, shopping and public transportation. This home is located right across from Irving Blvd, very close to the shopping and restaurants.Pictures are coming soon.
-
2026-04-07$199,900 Active 500-char remark
Show marketing remark (500 chars)
Charming home looking for their new owners. Come bring your vision and with a little tlc this gem will be a delight! This home features 4 bedrooms and 1 full bath. The formal dinning room was made into a bedroom, it has a build in closet. Enjoy your evenings in the immaculate backyard. This home is being sold as is. There are nearby schools, shopping and public transportation. This home is located right across from Irving Blvd, very close to the shopping and restaurants.Pictures are coming soon.
-
2003-12-30soldstatus
-
2003-01-24soldstatus
-
2002-11-21historical
-
2002-11-11$69,900
ⓘ Source: listings_history table (triggers on properties + properties_extension) + one-shot
backfill from property_details.listing_events for pre-trigger history.
Tax reassessment forecast TX · Resets to sale price
- Current annual tax
- $4,790 · $399/mo
- Projected year-2 tax
- $4,790 · $399/mo
- Expected delta
- $0/yr ($0/mo · 0.0%)
ⓘ Screening estimate from a state-policy table — verify with the county assessor before closing.
Climate risk First Street
- Flood 1/10 Low FEMA zone X (unshaded) · 0% chance over 30 yrs
- Wildfire 1/10 Low
- Heat 7/10 Severe 7 d/yr ≥110°F today · 23 d/yr by 30 yrs out
- Wind 6/10 Major 27% chance of damaging wind over 30 yrs
- Air quality 3/10 Moderate 2 unhealthy d/yr today · 3 by 30 yrs out
Nearby sold comps map
Loading sold comps map…
Walkable amenities ~0.75 mi
Loading nearby amenities…
Taxation est. · year 1
- Rental income
- $20,090
- − Mortgage interest
- −$11,198
- − Property taxes
- −$4,790
- − Insurance
- −$1,000
- − Repairs & maintenance
- −$1,607
- − Management
- −$1,607
- − Depreciation
- −$5,815
- Taxable loss
- −$5,926
- Est. tax savings @ 24.0%
- +$1,422
- After-tax cash flow
- $-1,075/yr
For passive investors: Depreciation is non-cash, so a rental often shows a tax loss while cash-flowing — sheltering income. Rental losses are passive: they offset passive income freely, and up to $25,000/yr can offset ordinary (W-2) income if you actively participate and your MAGI is under $100k (phasing out to $0 by $150k); unused losses carry forward. On sale, claimed depreciation is recaptured at up to 25%, and gains may owe capital-gains tax (a 1031 exchange can defer both). Figures are a year-1 estimate at your 24.0% rate — not tax advice; consult a CPA.
Schools (NCES district)
- District
- Irving ISD
- NCES district ID
- 4824420
- Math proficiency
- 19% ▼ -28.00%
- Reading proficiency
- 25% ▼ -11.00%
- Median HH income
- $44,870
- Composite
- 19.06/100
- National rank
- #8840
- State rank
- #751 of 826 in TX
Livability — Irving
- Score
- 80/100
- State rank
- #45
- US rank
- #1913
Category grades
Schools grade is shown separately in the Schools card above.
Census & demographics
- Census place
- Irving, TX
- County
- Dallas County · 2,612,404 people
- City population
- 258,488
- Metro
- Dallas-Fort Worth-Arlington, TX
- Population (ZIP)
- 56,013
- Household income
- $63,798
- Rent vs Own
- Severe rent burden
- 2930.0
Population outlook (Dallas County) Hauer SSP2
- Today (2025)
- 2,979,839 people
- By 2030
- 3,191,823 · +7.1%
- By 2040
- 3,619,611 · +21.5%
- By 2050
- 4,026,915 · +35.1%
- By 2075
- 4,957,073 · +66.4%
- By 2100
- 5,508,725 · +84.9%
Race, ethnicity, and origin ACS 2023
- Neighborhood character
- Predominantly Hispanic (71%)
- Race & ethnicity
- Hispanic / Latino 71% Two or more races 17% White 14% Black 8% Asian 5%
- Hispanic origin (detail)
- Mexican 41%
- Common ancestry
- Serbian 1% Italian 1% Slovak 1%
- Foreign-born
- 41% · Canada, Vietnam, China
- Languages at home
- 30% English-only · Spanish 64% Other Indo-European 3% Vietnamese 1%
Political lean MEDSL · Dallas
- 2024 margin
- Strong D (+22.2) · D 60.2% · R 38.0% · Other 1.8%
- 2008→2024 swing
- +6.9pp toward D · 2008: 15.3pp · 2024: 22.2pp
- All cycles
- 2024: D+22.2 2020: D+31.6 2016: D+26.2 2012: D+15.4 2008: D+15.3
Not yet ingested
- Civics
- —
Market trends
- HPI YoY
- ▼ -213.97%
- Current HPI
- 333.2765
- Rent YoY
- ▲ 0.72%
- Metro
- Dallas-Fort Worth-Arlington, TX
- State GDP YoY
- ▲ 3.95%
- F500 in state
- 110
Industry mix (Fortune 500 HQ in TX)
| Industry | F500 HQs | Revenue |
|---|---|---|
| Energy | 16 | $1,198B |
|
||
| Technology | 5 | $198B |
|
||
| Engineering / Construction | 4 | $72B |
|
||
| Energy Services | 3 | $60B |
|
||
| Utilities | 3 | $41B |
|
||
| Healthcare | 2 | $330B |
|
||
Price history
+186.0% since first listed7 events — show timeline
- 2026-04-19 Relisted — NTREIS
- 2026-04-14 Contingent — NTREIS
- 2026-04-07 Listed $199,900 NTREIS
- 2003-12-30 Sold (Public Records) — Public Records
- 2003-01-24 Sold (Public Records) — Public Records
- 2002-11-21 Listing Removed — NTREIS
- 2002-11-11 Listed $69,900 NTREIS
Property tax history
+7.5%/yrLatest (2025): $4,790 · +23.0% YoY. Source: county tax records.
Cash-flow waterfall
monthlySold comps — $/sqft
last 12 mo · ≤1 miLoading sold comps…