209 Mcneal Heritage Cir · Hahira, GA
Flood risk No data
- FEMA flood zone
- —
- Chance of flooding over 30 yrs
- —
- Est. flood insurance / yr
- —
Fire risk No data
- Est. fire insurance / yr
- —
Heat risk No data
- Hot days now (above threshold)
- —
- Hot days in 30 yrs
- —
Wind risk No data
- Chance of severe wind over 30 yrs
- —
Air-quality risk No data
- Unhealthy air days now
- —
- Unhealthy air days in 30 yrs
- —
Risk factors via First Street. Map © Google.
Why this score? — see what drove the D- grade
The composite is a weighted blend of 9 inputs, each scored 0–100. Each bar is that input's sub-score; the figure is the points it added to the 100-point composite (weight × sub-score).
- Appreciation +10.0/10.0
- ARV discount +6.2/15.0
- Cash flow +5.7/30.0
- Schools +4.7/10.0
- Livability +3.4/5.0
- Rent growth +2.5/5.0
- Condition / age +2.5/5.0
- 1% rule +1.3/10.0
- DSCR +0.1/10.0
$359,900
🖨 Deal sheet 📄 Offer letter ✓ Due diligence
Listing remarks
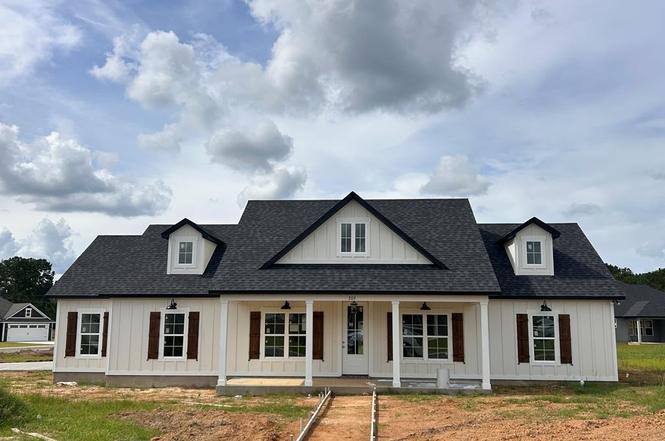
NEW CONSTRUCTION ON A CORNER LOT!!!. Welcome home to this beautifully designed home featuring a THREE CAR SIDE ENTRY GARAGE and a classic Southern-style front porch - perfect for rocking chairs, planted ferns, sweet tea, and sunset conversations. Step inside through the front foyer into an open floor-plan ideal for entertaining. The living room's vaulted ceiling flows seamlessly into the kitchen and a flexible space that can serve as a formal dining room, home office, or playroom. Granite countertops, a tile backsplash, tile shower, crown moldings, custom built-ins, and durable laminate wood flooring offer timeless style and pride of ownership from entry to exit. Enjoy the community pool pl
Key facts
- Community pool
- Basketball court
- Open floor-plan
Tags
Neighborhood map
What this means for you Summary
Snapshot
- This is a 4-bed/2.0-bath single-family listed at $360k.
Deal economics
- At list price, monthly cash flow is $-734 ($-9k/yr) — negative.
- To cash-flow at today's rent, offer at most $254k (29.5% below list).
- To meet the 1% rule (rent ≥ 1% of price), the offer needs to be $226k (37.1% below list).
- Recommended offer: $226k (37.1% below list) — sets the bar for 1% rule.
Location & tenants
- Location reads 67/100 on livability (#161 in GA) — a middle-class / working-renter tenant base. Strengths: cost of living A+, housing A+; Watch: crime C-, employment D+, health & safety D.
- Lowndes County (rural): math 59% / reading 52% proficiency, ranked #8 of 174 in GA (top 5%) — acceptable for families but not a draw, mixed tenant base, ~2y average lease.
- Market conditions: 189 active listings in the ZIP; 2 comparable units currently listed for rent nearby; solid renter incomes; 896 units permitted in Lowndes County in 2024 (0 in 5+ unit buildings).
- This rent runs 32% of the median local income ($84k/yr) — at the standard rent-burdened threshold; future hikes will face affordability resistance.
Forward outlook
- In year one you build about $38k of equity ($2k loan paydown + $36k appreciation (10.0% local appreciation)).
- Lowndes County population projected at +10% by 2050 — modest demand growth; plan on rents tracking national, not racing it.
- By year 2, paydown + projected appreciation supports a ~$62k cash-out refi (75% LTV) — recoverable capital for the next deal without selling this one.
Negotiation context
- It's been on market 38 days — a 3% lower offer ($349k) is reasonable based on typical stale-listing flexibility.
Questions for the listing agent
- What do current leases actually rent for vs. the listed asking? Can we see a recent rent roll and the last 12 months of T-12 income?
- It's been on market 38 days. Have you received any prior offers? Is the seller open to a 37% concession, seller financing, or rate buy-down credit?
- What does the HOA fee cover, when was the last increase, and are there any pending special assessments or reserve-fund shortfalls?
- Is there a deadline driving the sale (1031 exchange, divorce, estate, relocation)? That informs how much negotiation room exists.
- The area grade is low — what's the realistic commute time and amenity access for the typical tenant pool here? Any planned neighborhood developments (good or bad) we should know about?
- What's the average days-on-market for RENTAL listings here right now (not sales)? A rising rental-DOM trend means longer vacancies and softer asking-rent achievability than the comps imply.
- What's the recent tenant-quality profile in this submarket — average credit score on applications, eviction rate, late-payment / NSF rate, and stable-employment percentage? A property-management company in the area should have these aggregated.
- How much new for-sale + rental construction is in the pipeline within 1–3 miles? Heavy new supply typically softens prices + rents 12–24 months out; constrained supply supports both.
Investment metrics
- 1% rule
- 0.63% ✗
- Cap rate
- 3.85%
- Cash-on-cash
- -8.74%
- DSCR
- 0.61
- GRM
- 13.2
CMA / ARV
- ARV (on-the-fly)
- $349,530
- Comps found
- 12
Show comp detail 12 sales within ~0.75 mi
| Address | Dist | Beds/Ba | Sqft | Sold | Price | $/sf | Match |
|---|---|---|---|---|---|---|---|
| 209 Mcneal Heritage Cir | 0.00mi | 4/2.0 | 1,830 (0%) | 0mo | $359,900 | $197 | 100 |
| 338 Mcneal Heritage Cir | 0.03mi | 4/2.0 | 1,830 (0%) | 0mo | $359,900 | $197 | 98 |
| 233 Mcneal Heritage Cir | 0.00mi | 3/2.0 (-1) | 1,880 (+3%) | 1mo | $359,900 | $191 | 90 |
| 343 Mcneal Heritage Cir | 0.00mi | 4/2.0 | 1,683 (-8%) | 1mo | $319,900 | $190 | 85 |
| 347 Mcneal Heritage Cir | 0.00mi | 4/2.0 | 1,683 (-8%) | 2mo | $329,900 | $196 | 85 |
| 213 Barry Field Cir | 0.27mi | 4/2.0 | 1,804 (-1%) | 2mo | $329,900 | $183 | 83 |
| 117 Sparrow Dr | 0.30mi | 4/2.0 | 1,748 (-4%) | 1mo | $270,000 | $154 | 77 |
| 220 Wood Duck Pt | 0.19mi | 3/2.0 (-1) | 1,739 (-5%) | 1mo | $289,900 | $167 | 77 |
| 367 Mcneal Heritage Cir | 0.16mi | 4/2.0 | 1,671 (-9%) | 3mo | $326,900 | $196 | 76 |
| 351 Mcneal Heritage Cir | 0.23mi | 4/2.0 | 1,671 (-9%) | 2mo | $321,800 | $193 | 73 |
| 224 Barry Field Cir | 0.30mi | 4/2.0 | 1,683 (-8%) | 3mo | $319,900 | $190 | 70 |
| 191 Orvis Ln | 0.03mi | 3/3.0 (-1) | 2,102 (+15%) | 3mo | $402,000 | $191 | 62 |
Match score weights: distance 35% · size 25% · config 20% · recency 20%. Top-matched comps best support the ARV.
Projected returns pro-forma
10.0% appreciation · 3.0% rent growth · sell at horizon
- IRR
- 18.1%
- Equity multiple
- 2.48×
- Total profit
- $149,312
- Equity at exit
- $324,226
- IRR
- 16.9%
- Equity multiple
- 5.73×
- Total profit
- $476,579
- Equity at exit
- $699,207
Cash invested: $100,772 (down + closing). Projections, not guarantees.
Landlord ↔ Tenant lean methodology
- Overall (STATE)
- 90 Strongly Landlord-Friendly
- State Georgia
- 90 Strongly Landlord-Friendly · R+3
- County
- — inherits STATE
- City
- — inherits STATE
ZIP-level market 31632
- Home prices YoY
- 8.1%
- Active inventory
- 189
- Price-to-rent
- 13.2×
Monthly cashflow live
- Estimated rent
- $2,265 medium interval (Pro) →
- Mortgage (P&I)
- −$1,887
- Tax est. 1.5%
- −$450 /mo · $5,398/yr
- Insurance
- −$150
- HOA
- −$36
- Vacancy / Maint / Mgmt
- −$476
- Net cashflow
- $-734
Break-even live
UW: 25.0% down · 7.5% · 30yr · 1.5% tax · 5.0% vac · 8.0% maint · 8.0% mgmt
Financing live
Cash to close
- Down payment
- $89,975
- Closing costs
- $10,797
- Reserves months
- —
- Total cash needed
- —
Loan-product check · same deal, 3 products live
Conventional
25% down · 7.5% · 30yr
- Down + closing
- —
- Monthly P&I
- —
- Monthly cashflow
- —
- DSCR
- —
- Eligible?
- —
Personal DTI + credit; lowest rate.
DSCR
20% down · 8.5% · 30yr
- Down + closing
- —
- Monthly P&I
- —
- Monthly cashflow
- —
- DSCR
- —
- Eligible?
- —
No personal income docs; deal must DSCR.
Hard money
10% down · 12.0% · 12mo
- Down + closing
- —
- Monthly P&I
- —
- Monthly cashflow
- —
- DSCR
- —
- Eligible?
- —
Short-term bridge; refi at stabilization.
Rent comps 2 comps
| Address | Beds | Baths | Sqft | Rent | $/sqft | DOM | Units | Dist |
|---|---|---|---|---|---|---|---|---|
| 305 Barfield St Hahira, GA | 3.0 | 2.0 | 1361 | $1,495 | $1.10 | 43d | 1 | 0.68mi |
| 7410 Northcreek Cir Hahira, GA | 3.0 | 2.0 | 1460 | $1,750 | $1.20 | 21d | 1 | 1.12mi |
HOA detail
- Monthly dues
- $36 · $432/yr
- Likely covers
- pool
Listing history 2 events
-
2026-03-30status Pending
-
2026-02-19$359,900 Active
ⓘ Source: listings_history table (triggers on properties + properties_extension) + one-shot
backfill from property_details.listing_events for pre-trigger history.
Nearby sold comps map
Loading sold comps map…
Walkable amenities ~0.75 mi
Loading nearby amenities…
Taxation est. · year 1
- Rental income
- $27,176
- − Mortgage interest
- −$20,160
- − Property taxes
- −$5,398
- − Insurance
- −$1,800
- − Repairs & maintenance
- −$2,174
- − Management
- −$2,174
- − HOA
- −$432
- − Depreciation
- −$10,470
- Taxable loss
- −$15,432
- Est. tax savings @ 24.0%
- +$3,704
- After-tax cash flow
- $-5,106/yr
For passive investors: Depreciation is non-cash, so a rental often shows a tax loss while cash-flowing — sheltering income. Rental losses are passive: they offset passive income freely, and up to $25,000/yr can offset ordinary (W-2) income if you actively participate and your MAGI is under $100k (phasing out to $0 by $150k); unused losses carry forward. On sale, claimed depreciation is recaptured at up to 25%, and gains may owe capital-gains tax (a 1031 exchange can defer both). Figures are a year-1 estimate at your 24.0% rate — not tax advice; consult a CPA.
Schools (NCES district)
- District
- Lowndes County
- NCES district ID
- 1303390
- Math proficiency
- 59% ▼ -1.00%
- Reading proficiency
- 52% ▼ -2.00%
- Median HH income
- $48,221
- Composite
- 47.21/100
- National rank
- #2317
- State rank
- #8 of 174 in GA
Livability — Hahira
- Score
- 67/100
- State rank
- #161
- US rank
- #10280
Category grades
Schools grade is shown separately in the Schools card above.
Census & demographics
- Census place
- Hahira, GA
- County
- Lowndes County · 107,801 people
- Metro
- Valdosta, GA
- Population (ZIP)
- 15,942
- Household income
- $83,946
- Rent vs Own
- Severe rent burden
- 73.0
Population outlook (Lowndes County) Hauer SSP2
- Today (2025)
- 120,348 people
- By 2030
- 123,469 · +2.6%
- By 2040
- 128,482 · +6.8%
- By 2050
- 131,907 · +9.6%
- By 2075
- 139,080 · +15.6%
- By 2100
- 133,649 · +11.1%
Race, ethnicity, and origin ACS 2023
- Neighborhood character
- Predominantly White (79%)
- Race & ethnicity
- White 79% Black 12% Hispanic / Latino 6% Two or more races 5%
- Hispanic origin (detail)
- Mexican 2% Puerto Rican 2%
- Common ancestry
- Slovak 3% Serbian 2% Italian 1%
- Foreign-born
- 2% · Canada, Jamaica
- Languages at home
- 96% English-only · Spanish 3%
Political lean MEDSL · Lowndes
- 2024 margin
- R (+18.0) · D 40.8% · R 58.8%
- 2008→2024 swing
- -8.6pp toward R · 2008: -9.4pp · 2024: -18.0pp
- All cycles
- 2024: R+18.0 2020: R+12.0 2016: R+18.2 2012: R+10.5 2008: R+9.4
Not yet ingested
- Civics
- —
Market trends
- HPI YoY
- ▲ 19.44%
- Current HPI
- 259.01
- Rent YoY
- —
- Metro
- Valdosta, GA
- State GDP YoY
- ▲ 2.66%
- F500 in state
- 28
Industry mix (Fortune 500 HQ in GA)
| Industry | F500 HQs | Revenue |
|---|---|---|
| Paper / Packaging | 2 | $29B |
|
||
| Retail | 1 | $160B |
|
||
| Transportation / Logistics | 1 | $91B |
|
||
| Airlines | 1 | $62B |
|
||
| Consumer Goods | 1 | $47B |
|
||
| Utilities | 1 | $25B |
|
||
Price history
2 events — show timeline
- 2026-03-30 Pending — SGMLS
- 2026-02-19 Listed $359,900 SGMLS
Cash-flow waterfall
monthlySold comps — $/sqft
last 12 mo · ≤1 miLoading sold comps…