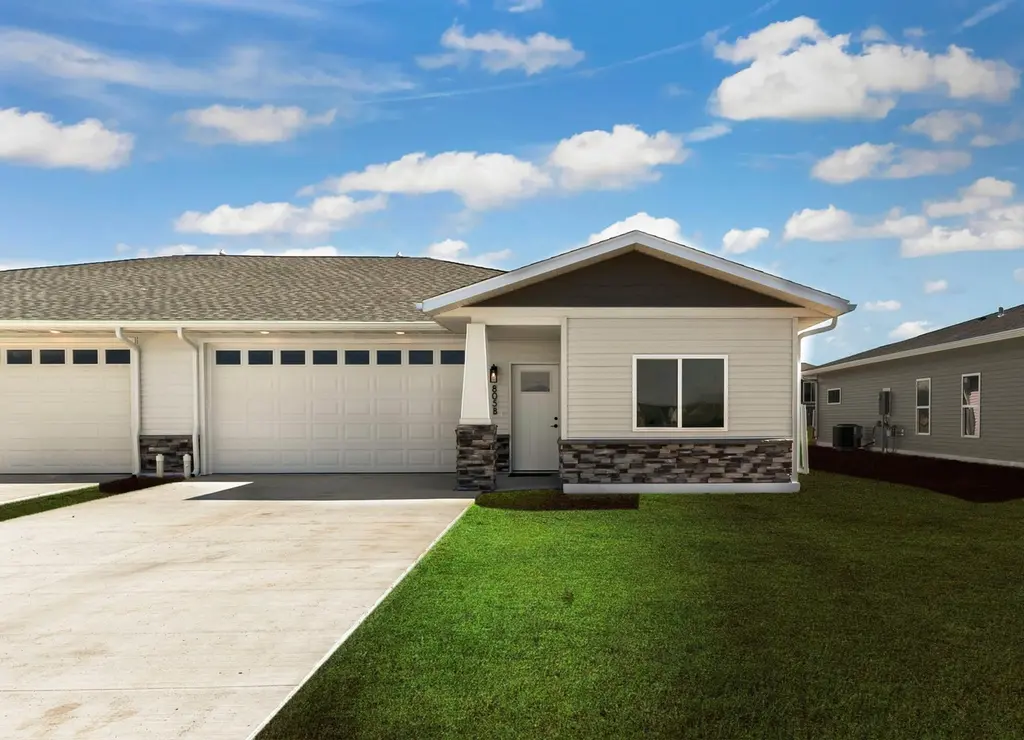
805 9th Ave SW Unit B · Perham, MN
Flood risk No data
- FEMA flood zone
- —
- Chance of flooding over 30 yrs
- —
- Est. flood insurance / yr
- —
Fire risk No data
- Est. fire insurance / yr
- —
Heat risk No data
- Hot days now (above threshold)
- —
- Hot days in 30 yrs
- —
Wind risk No data
- Chance of severe wind over 30 yrs
- —
Air-quality risk No data
- Unhealthy air days now
- —
- Unhealthy air days in 30 yrs
- —
Risk factors via First Street. Map © Google.
Why this score? — see what drove the D grade
The composite is a weighted blend of 9 inputs, each scored 0–100. Each bar is that input's sub-score; the figure is the points it added to the 100-point composite (weight × sub-score).
- Cash flow +12.0/30.0
- ARV discount +7.5/15.0
- Condition / age +4.8/5.0
- Schools +4.4/10.0
- DSCR +3.6/10.0
- 1% rule +3.5/10.0
- Livability +3.5/5.0
- Rent growth +2.5/5.0
- Appreciation +0.0/10.0
$369,500
🖨 Deal sheet (PDF) 📄 Offer letter ✓ Due diligence
Listing remarks MLS
Modern new construction with premium finishes & a prime location. No steps in this stunning patio twin-home featuring 10ft ceilings and luxury vinyl plank flooring throughout. The kitchen and bathrooms boast quartz countertops, while large windows flood the space with natural light. Entertain around the kitchen island or cozy up next to the beautiful gas fireplace. Primary suite w/ double sinks and glass door shower. The exterior is clad in low-maintenance steel siding, complemented by an insulated, finished garage. Located near schools, parks, and the hospital, this home offers convenience and comfort. Benefit from TIF financing to reduce special assessments and no association dues. Experience luxury living with minimal maintenance, call today for a showing!
Key facts
- Large windows
- Quartz countertops
- Patio twin-home
Tags
Neighborhood map
What this means for you Summary
Snapshot
- This is a 3-bed/2.0-bath single-family listed at $370k. Condition is rated excellent.
Deal economics
- At list price, monthly cash flow is $-85 ($-1k/yr) — negative.
- To cash-flow at today's rent, offer at most $357k (3.3% below list).
- To meet the 1% rule (rent ≥ 1% of price), the offer needs to be $312k (15.4% below list).
- Recommended offer: $312k (15.4% below list) — sets the bar for 1% rule.
Location & tenants
- Location reads 70/100 on livability (#328 in MN) — a middle-class / working-renter tenant base. Strengths: crime A+, cost of living A+, health & safety A+; Watch: amenities F, commute F, employment F.
- Perham-Dent Public School District (town): math 45% / reading 57% proficiency, ranked #110 of 301 in MN (top 36%) — acceptable for families but not a draw, mixed tenant base, ~2y average lease.
- Zoned schools: Heart of The Lake Elementary (math 54% / reading 51%, grade C-, #364 of 857 statewide, top 43%, 575 students, 47% FRL); Prairie Wind Middle (math 44% / reading 59%, grade C, #65 of 258 statewide, top 26%, 515 students, 38% FRL); Perham Senior High (math 37% / reading 62%, grade D, #143 of 471 statewide, top 33%, 505 students, 36% FRL).
- Market conditions: 93 active listings in the ZIP; 2 comparable units currently listed for rent nearby; 140 units permitted in Otter Tail County in 2024 (48 in 5+ unit buildings).
Forward outlook
- Local home prices are declining (-3.0%/yr); year-one equity from $3k of loan paydown is wiped out by about $11k of value loss. Plan a longer hold.
Negotiation context
- It's been on market 91 days — a 9% lower offer ($336k) is reasonable based on typical stale-listing flexibility.
- 5 sale attempts since 2y ago with the ask held roughly flat each time — persistent listings suggest the price (not the market) is what's stuck; bring a comps-based counter.
Questions for the listing agent
- What do current leases actually rent for vs. the listed asking? Can we see a recent rent roll and the last 12 months of T-12 income?
- It's been on market 91 days. Have you received any prior offers? Is the seller open to a 15% concession, seller financing, or rate buy-down credit?
- Why hasn't it sold? Are there any deal-killer items the seller is aware of (foundation, flood, title, zoning, code violations)?
- Is there a deadline driving the sale (1031 exchange, divorce, estate, relocation)? That informs how much negotiation room exists.
- Schools are B-rated — typically a magnet for longer-tenancy family renters. What's the average tenant stay here, and is there a school-zone premium baked into asking?
- The area grade is low — what's the realistic commute time and amenity access for the typical tenant pool here? Any planned neighborhood developments (good or bad) we should know about?
- What's the average days-on-market for RENTAL listings here right now (not sales)? A rising rental-DOM trend means longer vacancies and softer asking-rent achievability than the comps imply.
- What's the recent tenant-quality profile in this submarket — average credit score on applications, eviction rate, late-payment / NSF rate, and stable-employment percentage? A property-management company in the area should have these aggregated.
- How much new for-sale + rental construction is in the pipeline within 1–3 miles? Heavy new supply typically softens prices + rents 12–24 months out; constrained supply supports both.
Investment metrics
- 1% rule
- 0.85% ✗
- Cap rate
- 6.02%
- Cash-on-cash
- -0.98%
- DSCR
- 0.96
- GRM
- 9.9
CMA / ARV
No comps found within radius.
Projected returns pro-forma
-3.0% appreciation · 3.0% rent growth · sell at horizon
- IRR
- -17.9%
- Equity multiple
- 0.37×
- Total profit
- $-65,227
- Equity at exit
- $55,094
- IRR
- -10.1%
- Equity multiple
- 0.39×
- Total profit
- $-63,560
- Equity at exit
- $31,948
Cash invested: $103,460 (down + closing). Projections, not guarantees.
Landlord ↔ Tenant lean methodology
- Overall (STATE)
- 46 Balanced
- State Minnesota
- 46 Balanced · D+2
- County
- — inherits STATE
- City
- — inherits STATE
ZIP-level market 56573
- Home prices YoY
- -15.8%
- Active inventory
- 93
- Price-to-rent
- 9.9×
Monthly cashflow live
- Estimated rent
- $3,125 medium interval (Pro) →
- Mortgage (P&I)
- −$1,938
- Tax est. 1.5%
- −$462 /mo · $5,542/yr
- Insurance
- −$154
- HOA
- −$0
- Vacancy / Maint / Mgmt
- −$656
- Net cashflow
- $-85
Break-even live
Sensitivity live
| Price | -10% $171 | -5% $43 | +0% $-85 | +5% $-212 | +10% $-340 |
|---|---|---|---|---|---|
| Rent | -10% $-332 | -5% $-208 | +0% $-85 | +5% $39 | +10% $162 |
| Rate | -1.0pp $101 | -0.5pp $9 | base $-85 | +0.5pp $-181 | +1.0pp $-278 |
UW: 25.0% down · 7.5% · 30yr · 1.5% tax · 5.0% vac · 8.0% maint · 8.0% mgmt
Financing live
Cash to close
- Down payment
- $92,375
- Closing costs
- $11,085
- Reserves months
- —
- Total cash needed
- —
Loan-product check · same deal, 3 products live
Conventional
25% down · 7.5% · 30yr
- Down + closing
- —
- Monthly P&I
- —
- Monthly cashflow
- —
- DSCR
- —
- Eligible?
- —
Personal DTI + credit; lowest rate.
DSCR
20% down · 8.5% · 30yr
- Down + closing
- —
- Monthly P&I
- —
- Monthly cashflow
- —
- DSCR
- —
- Eligible?
- —
No personal income docs; deal must DSCR.
Hard money
10% down · 12.0% · 12mo
- Down + closing
- —
- Monthly P&I
- —
- Monthly cashflow
- —
- DSCR
- —
- Eligible?
- —
Short-term bridge; refi at stabilization.
Rent comps 2 comps
| Address | Beds | Baths | Sqft | Rent | $/sqft | DOM | Units | Dist |
|---|---|---|---|---|---|---|---|---|
| 812 7th St SW Unit A Perham, MN | 3.0 | 2.0 | 1602 | $3,750 | $2.34 | 45d | 1 | 0.15mi |
| 812 7th St SW Unit B Perham, MN | 3.0 | 2.0 | 1602 | $2,500 | $1.56 | 45d | 1 | 0.15mi |
Listing history 28 events
-
2026-06-22days on market $369,500 Active 91 DOM
-
2026-06-21days on market $369,500 Active 90 DOM
-
2026-06-21days on market $369,500 Active 89 DOM
-
2026-06-18days on market $369,500 Active 87 DOM
-
2026-06-17days on market $369,500 Active 86 DOM
-
2026-06-16days on market $369,500 Active 85 DOM
-
2026-06-15days on market $369,500 Active 84 DOM
-
2026-06-13days on market $369,500 Active 82 DOM
-
2026-06-12days on market $369,500 Active 81 DOM
-
2026-06-09days on market $369,500 Active 78 DOM
-
2026-06-08days on market $369,500 Active 77 DOM
-
2026-06-07days on market $369,500 Active 76 DOM
-
2026-06-07days on market $369,500 Active 75 DOM
-
2026-06-04days on market $369,500 Active 72 DOM
-
2026-06-02days on market $369,500 Active 71 DOM
-
2026-06-01days on market $369,500 Active 70 DOM
-
2026-05-31days on market $369,500 Active 69 DOM
-
2026-05-31days on market $369,500 Active 68 DOM
-
2026-03-23$369,500 Active 773-char remark
Show marketing remark (773 chars)
Modern new construction with premium finishes & a prime location. No steps in this stunning patio twin-home featuring 10ft ceilings and luxury vinyl plank flooring throughout. The kitchen and bathrooms boast quartz countertops, while large windows flood the space with natural light. Entertain around the kitchen island or cozy up next to the beautiful gas fireplace. Primary suite w/ double sinks and glass door shower. The exterior is clad in low-maintenance steel siding, complemented by an insulated, finished garage. Located near schools, parks, and the hospital, this home offers convenience and comfort. Benefit from TIF financing to reduce special assessments and no association dues. Experience luxury living with minimal maintenance, call today for a showing!
-
2026-03-23historical
Show marketing remark (773 chars)
Modern new construction with premium finishes & a prime location. No steps in this stunning patio twin-home featuring 10ft ceilings and luxury vinyl plank flooring throughout. The kitchen and bathrooms boast quartz countertops, while large windows flood the space with natural light. Entertain around the kitchen island or cozy up next to the beautiful gas fireplace. Primary suite w/ double sinks and glass door shower. The exterior is clad in low-maintenance steel siding, complemented by an insulated, finished garage. Located near schools, parks, and the hospital, this home offers convenience and comfort. Benefit from TIF financing to reduce special assessments and no association dues. Experience luxury living with minimal maintenance, call today for a showing!
-
2025-09-17price $362,500
-
2025-08-29status Active
-
2025-08-29historical
-
2025-03-03status Active
-
2025-03-01historical
-
2024-08-29$369,000 Active
-
2024-04-17historical
-
2024-03-20$375,000 Active
ⓘ Source: listings_history table (triggers on properties + properties_extension) + one-shot
backfill from property_details.listing_events for pre-trigger history.
Nearby sold comps map
Loading sold comps map…
Walkable amenities ~0.75 mi
Loading nearby amenities…
Taxation est. · year 1
- Rental income
- $37,500
- − Mortgage interest
- −$20,698
- − Property taxes
- −$5,542
- − Insurance
- −$1,848
- − Repairs & maintenance
- −$3,000
- − Management
- −$3,000
- − Depreciation
- −$10,749
- Taxable loss
- −$7,337
- Est. tax savings @ 24.0%
- +$1,761
- After-tax cash flow
- $743/yr
For passive investors: Depreciation is non-cash, so a rental often shows a tax loss while cash-flowing — sheltering income. Rental losses are passive: they offset passive income freely, and up to $25,000/yr can offset ordinary (W-2) income if you actively participate and your MAGI is under $100k (phasing out to $0 by $150k); unused losses carry forward. On sale, claimed depreciation is recaptured at up to 25%, and gains may owe capital-gains tax (a 1031 exchange can defer both). Figures are a year-1 estimate at your 24.0% rate — not tax advice; consult a CPA.
Condition & rehab AI · 12 photos
This modern new construction home is in excellent condition with premium finishes and a prime location. It is move-in ready with no repairs needed.
Value-add opportunities
- Both Painting exterior — Enhances curb appeal and value
- Both Landscaping — Improves curb appeal and rental value
- Both Add smart home features — Enhances convenience and marketability
Renovation cost estimate screening
Value-add ROI direction
- Both Painting exterior — Enhances curb appeal and value ↑
- Both Landscaping — Improves curb appeal and rental value ↑
- Both Add smart home features — Enhances convenience and marketability ↑
ⓘ Cost ranges are severity-bucket heuristics (US national rule-of-thumb). Get contractor quotes + a written scope before underwriting a rehab budget.
Schools (NCES district)
- District
- Perham-Dent Public School District
- NCES district ID
- 2728230
- Math proficiency
- 45% ▼ -14.00%
- Reading proficiency
- 57% ▼ -5.00%
- Median HH income
- $50,712
- Composite
- 43.64/100
- National rank
- #2966
- State rank
- #110 of 301 in MN
Livability — Perham
- Score
- 70/100
- State rank
- #328
- US rank
- #7425
Category grades
Schools grade is shown separately in the Schools card above.
Census & demographics
- Census place
- Perham, MN
- Population (ZIP)
- 6,868
Population outlook (Otter Tail County) Hauer SSP2
- Today (2025)
- 58,183 people
- By 2030
- 58,267 · +0.1%
- By 2040
- 57,999 · -0.3%
- By 2050
- 57,183 · -1.7%
- By 2075
- 57,638 · -0.9%
- By 2100
- 54,697 · -6.0%
Race, ethnicity, and origin ACS 2023
- Neighborhood character
- Predominantly White (86%)
- Race & ethnicity
- White 86% Hispanic / Latino 9% Two or more races 6% Black 1%
- Hispanic origin (detail)
- Mexican 2% Dominican 1%
- Common ancestry
- Portuguese 18% Romanian 6% Lithuanian 3%
- Foreign-born
- 5% · Canada
- Languages at home
- 92% English-only · Spanish 7%
Political lean MEDSL · Otter Tail
- 2024 margin
- Solid R (+34.2) · D 32.1% · R 66.3% · Other 1.6%
- 2008→2024 swing
- -21.3pp toward R · 2008: -12.9pp · 2024: -34.2pp
- All cycles
- 2024: R+34.2 2020: R+32.5 2016: R+35.9 2012: R+21.2 2008: R+12.9
Not yet ingested
- Civics
- —
Market trends
- HPI YoY
- ▼ -42.48%
- Current HPI
- 225.7071
- Rent YoY
- —
- Metro
- —
- State GDP YoY
- ▲ 2.41%
- F500 in state
- 34
Industry mix (Fortune 500 HQ in MN)
| Industry | F500 HQs | Revenue |
|---|---|---|
| Healthcare | 2 | $407B |
|
||
| Retail | 2 | $150B |
|
||
| Consumer Goods | 2 | $32B |
|
||
| Industrial Machinery | 2 | $6B |
|
||
| Agriculture | 1 | $40B |
|
||
| Healthcare / Medical Devices | 1 | $32B |
|
||
Price history
-1.5% since first listed10 events — show timeline
- 2026-03-23 Listing Removed — NORTHSTARMLS as Distributed by MLS Grid
- 2026-03-23 Listed $369,500 NORTHSTARMLS as Distributed by MLS Grid
- 2025-09-17 Price Changed $362,500 NORTHSTARMLS as Distributed by MLS Grid
- 2025-08-29 Relisted — NORTHSTARMLS as Distributed by MLS Grid
- 2025-08-29 Listing Removed — NORTHSTARMLS as Distributed by MLS Grid
- 2025-03-03 Relisted — NORTHSTARMLS as Distributed by MLS Grid
- 2025-03-01 Listing Removed — NORTHSTARMLS as Distributed by MLS Grid
- 2024-08-29 Listed $369,000 NORTHSTARMLS as Distributed by MLS Grid
- 2024-04-17 Listing Removed — NORTHSTARMLS as Distributed by MLS Grid
- 2024-03-20 Listed $375,000 NORTHSTARMLS as Distributed by MLS Grid
Cash-flow waterfall
monthlySold comps — $/sqft
last 12 mo · ≤1 miLoading sold comps…