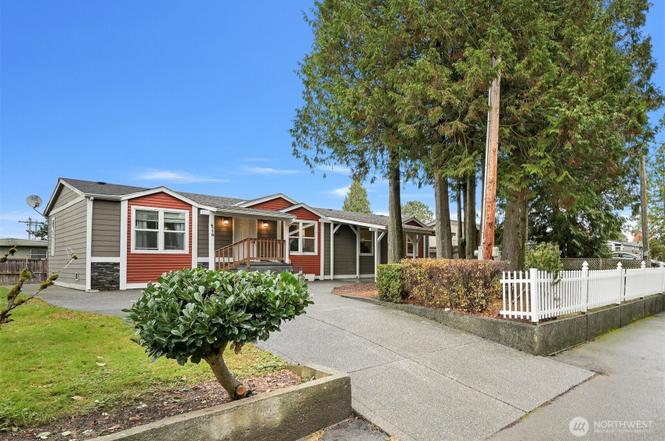
4716 Fir Dr · Birch Bay, WA
Flood risk 1/10 · Minimal
- FEMA flood zone
- X (unshaded)
- Chance of flooding over 30 yrs
- 0.0%
- Est. flood insurance / yr
- $507 – $1,088
Fire risk 3/10 · Minor
- Est. fire insurance / yr
- $604 – $1,122
Heat risk 2/10 · Minimal
- Hot days now (above 81°F)
- 7 days/yr
- Hot days in 30 yrs
- 18 days/yr
Wind risk 1/10 · Minimal
- Chance of severe wind over 30 yrs
- —
Air-quality risk 6/10 · Moderate
- Unhealthy air days now
- 7 days/yr
- Unhealthy air days in 30 yrs
- 10 days/yr
Risk factors via First Street. Map © Google.
Why this score? — see what drove the D+ grade
The composite is a weighted blend of 9 inputs, each scored 0–100. Each bar is that input's sub-score; the figure is the points it added to the 100-point composite (weight × sub-score).
- ARV discount +14.9/15.0
- Appreciation +10.0/10.0
- Cash flow +7.7/30.0
- Schools +4.7/10.0
- Rent growth +3.3/5.0
- Livability +3.1/5.0
- Condition / age +2.5/5.0
- DSCR +1.8/10.0
- 1% rule +1.4/10.0
$419,000
🖨 Deal sheet (PDF) 📄 Offer letter ✓ Due diligence
Listing remarks
Welcome to 4716 Fir Drive, a well-maintained 2003 home offering over 1,500 sq ft of comfortable living. The smart layout features two living room spaces and a desirable bedroom design, featuring a generously sized primary bedroom with an en suite bath on one side and secondary bedrooms on the other. Ideal for first-time buyers or investors, this home sits in Blaine’s sought-after coastal corridor and was previously operated as an income-producing Airbnb. The low-maintenance yard means more time for beach-combing, kayaking, and enjoying Birch Bay’s stunning sunsets—just minutes from your door. Close to local boutiques, cafés, and seasonal festivals, this home blends
Key facts
- 6,534 sq ft lot
- Parking
- Built 2003
Property features AI
Finance
- Financial info: Accepts Cash, Conventional, FHA, USDA Loan, VA Loan
Exterior
- Parking: Attached carport (1 covered/carport space); RV parking available
- Security: Partially fenced
- Utilities: Electric energy source; Community water (Birch Bay Water & Sewer); Sewer connected (Birch Bay Water & Sewer); Electric water heater; Power by PSE; Internet (Ziply)
- Home design: Manufactured home on land (double wide); One story; Main level entry; Faces south
- Construction: Wood construction; Composition roof; Poured concrete foundation; Model ORE 440826 (double wide manufactured)
- Exterior features: Partially fenced yard; Patio; Outbuildings; RV parking; Wood exterior products; Paved dead-end street; Level to partially sloped lot; Has a view
Interior
- Kitchen: Kitchen with eating space; Dishwasher; Microwave; Refrigerator; Stove/Range
- Bedrooms: 3 bedrooms (all on the main level); Primary bedroom (main level)
- Flooring: Vinyl; Vinyl plank; Carpet
- Bathrooms: 2 full bathrooms (both on the main level); Each bathroom includes a tub and shower
- Heating & cooling: Forced air heating; Heat pump; Has heating and cooling (see remarks)
- Interior features: Dining room; Vaulted ceilings; Electric water heater
- Laundry & utility: Washer; Dryer; Utility room (main level)
Neighborhood map
What this means for you Summary
Snapshot
- This is a 3-bed/2.0-bath manufactured listed at $419k.
Deal economics
- At list price, monthly cash flow is $-489 ($-6k/yr) — negative.
- To cash-flow at today's rent, offer at most $333k (20.6% below list).
- To meet the 1% rule (rent ≥ 1% of price), the offer needs to be $267k (36.3% below list).
- Recommended offer: $267k (36.3% below list) — sets the bar for 1% rule.
- Cap rate 4.9% vs local median 2.6% in Birch Bay — top-decile yield for the area; either an underpriced asset or a hidden risk that comps aren't pricing in. Stress-test before assuming the spread holds.
Location & tenants
- Location reads 62/100 on livability (#406 in WA) — a middle-class / working-renter tenant base. Strengths: housing A; Watch: cost of living D+, health & safety D, amenities F.
- Blaine School District (town): math 49% / reading 55% proficiency, ranked #120 of 291 in WA (top 41%) — acceptable for families but not a draw, mixed tenant base, ~2y average lease.
- Zoned schools: Blaine Elementary School (463 students, 54% FRL); Blaine Middle School (459 students, 54% FRL); Blaine High School (609 students, 46% FRL) — zoned schools average 51% FRL vs 33% district-wide (18 pts higher); higher-poverty schools than district average — tighter screening recommended.
- Market conditions: Rents rising (+3.1%/yr); 461 active listings in the ZIP; solid renter incomes; 1,190 units permitted in Whatcom County in 2024 (327 in 5+ unit buildings).
- This rent runs 37% of the median local income ($87k/yr) — at the standard rent-burdened threshold; future hikes will face affordability resistance.
Forward outlook
- In year one you build about $45k of equity ($3k loan paydown + $42k appreciation (10.0% local appreciation)).
- Whatcom County population projected at +28% by 2050 — long-run rental-demand tailwind backs the buy-and-hold thesis.
- By year 2, paydown + projected appreciation supports a ~$72k cash-out refi (75% LTV) — recoverable capital for the next deal without selling this one.
Negotiation context
- It's been on market 170 days — a 12% lower offer ($369k) is reasonable based on typical stale-listing flexibility.
- 4 sale attempts since 5y ago; this cycle's ask has dropped $31k (7%) from the opening price — seller is motivated, your offer sets the floor, not the list.
- Current owner paid $330k; 27% above their basis — modest negotiation headroom, anchor on the comps not their cost.
Questions for the listing agent
- What do current leases actually rent for vs. the listed asking? Can we see a recent rent roll and the last 12 months of T-12 income?
- It's been on market 170 days. Have you received any prior offers? Is the seller open to a 36% concession, seller financing, or rate buy-down credit?
- Why hasn't it sold? Are there any deal-killer items the seller is aware of (foundation, flood, title, zoning, code violations)?
- Is there a deadline driving the sale (1031 exchange, divorce, estate, relocation)? That informs how much negotiation room exists.
- Schools are F-rated, which usually means shorter tenancies and higher turnover. Who's the typical renter profile here, and what's been the actual vacancy rate?
- The area grade is low — what's the realistic commute time and amenity access for the typical tenant pool here? Any planned neighborhood developments (good or bad) we should know about?
- What's the average days-on-market for RENTAL listings here right now (not sales)? A rising rental-DOM trend means longer vacancies and softer asking-rent achievability than the comps imply.
- What's the recent tenant-quality profile in this submarket — average credit score on applications, eviction rate, late-payment / NSF rate, and stable-employment percentage? A property-management company in the area should have these aggregated.
- How much new for-sale + rental construction is in the pipeline within 1–3 miles? Heavy new supply typically softens prices + rents 12–24 months out; constrained supply supports both.
Investment metrics
- 1% rule
- 0.64% ✗
- Cap rate
- 4.89%
- Cash-on-cash
- -5.01%
- DSCR
- 0.78
- GRM
- 13.1
CMA / ARV
- ARV (on-the-fly)
- $501,984
- Comps found
- 3
Show comp detail 3 sales within ~0.75 mi
| Address | Dist | Beds/Ba | Sqft | Sold | Price | $/sf | Match |
|---|---|---|---|---|---|---|---|
| 4716 Fir Dr | 0.00mi | 3/2.0 | 1,512 (0%) | 0mo | $419,000 | $277 | 100 |
| 4739 Alderson Rd | 0.06mi | 3/2.0 | 1,354 (-10%) | 11mo | $450,000 | $332 | 70 |
| 7459 Sunset Dr | 0.49mi | 2/2.0 (-1) | 1,674 (+11%) | 14mo | $559,000 | $334 | 42 |
Match score weights: distance 35% · size 25% · config 20% · recency 20%. Top-matched comps best support the ARV.
Projected returns pro-forma
10.0% appreciation · 3.1% rent growth · sell at horizon
- IRR
- 20.7%
- Equity multiple
- 2.68×
- Total profit
- $197,153
- Equity at exit
- $377,468
- IRR
- 18.9%
- Equity multiple
- 6.16×
- Total profit
- $605,359
- Equity at exit
- $814,025
Cash invested: $117,320 (down + closing). Projections, not guarantees.
Landlord ↔ Tenant lean methodology
- Overall (STATE)
- 28 Tenant-Leaning
- State Washington
- 28 Tenant-Leaning · D+8
- County
- — inherits STATE
- City
- — inherits STATE
ZIP-level market 98230
- Home prices YoY
- 14.0%
- Rents YoY
- 3.1%
- Active inventory
- 461
- Price-to-rent
- 13.1×
Monthly cashflow live
- Estimated rent
- $2,668 medium interval (Pro) →
- Mortgage (P&I)
- −$2,197
- Tax from tax record
- −$225 /mo · $2,702/yr
- Insurance
- −$175
- HOA
- −$0
- Vacancy / Maint / Mgmt
- −$560
- Net cashflow
- $-489
Break-even live
Sensitivity live
| Price | -10% $-252 | -5% $-371 | +0% $-489 | +5% $-608 | +10% $-727 |
|---|---|---|---|---|---|
| Rent | -10% $-700 | -5% $-595 | +0% $-489 | +5% $-384 | +10% $-279 |
| Rate | -1.0pp $-278 | -0.5pp $-383 | base $-489 | +0.5pp $-598 | +1.0pp $-708 |
UW: 25.0% down · 7.5% · 30yr · 1.5% tax · 5.0% vac · 8.0% maint · 8.0% mgmt
Financing live
Cash to close
- Down payment
- $104,750
- Closing costs
- $12,570
- Reserves months
- —
- Total cash needed
- —
Loan-product check · same deal, 3 products live
Conventional
25% down · 7.5% · 30yr
- Down + closing
- —
- Monthly P&I
- —
- Monthly cashflow
- —
- DSCR
- —
- Eligible?
- —
Personal DTI + credit; lowest rate.
DSCR
20% down · 8.5% · 30yr
- Down + closing
- —
- Monthly P&I
- —
- Monthly cashflow
- —
- DSCR
- —
- Eligible?
- —
No personal income docs; deal must DSCR.
Hard money
10% down · 12.0% · 12mo
- Down + closing
- —
- Monthly P&I
- —
- Monthly cashflow
- —
- DSCR
- —
- Eligible?
- —
Short-term bridge; refi at stabilization.
Listing history 11 events
-
2026-04-30status Pending
-
2026-02-14price $419,000
-
2026-01-06price $435,000
-
2025-11-11$450,000 Active
-
2021-12-01soldstatus $330,000 Closed
-
2021-10-12status Pending
-
2021-10-08status Active
-
2021-09-26status Pending
-
2021-09-23status Active
-
2021-09-21status Pending
-
2021-09-14$315,000 Active
ⓘ Source: listings_history table (triggers on properties + properties_extension) + one-shot
backfill from property_details.listing_events for pre-trigger history.
Tax reassessment forecast WA · Resets to sale price
- Current annual tax
- $2,702 · $225/mo
- Projected year-2 tax
- $4,106 · $342/mo
- Expected delta
- +$1,405/yr (+$117/mo · 52.0%)
ⓘ Screening estimate from a state-policy table — verify with the county assessor before closing.
Climate risk First Street
- Flood 1/10 Low FEMA zone X (unshaded) · 0% chance over 30 yrs
- Wildfire 3/10 Moderate
- Heat 2/10 Low 7 d/yr ≥81°F today · 18 d/yr by 30 yrs out
- Wind 1/10 Low
- Air quality 6/10 Major 7 unhealthy d/yr today · 10 by 30 yrs out
Nearby sold comps map
Loading sold comps map…
Walkable amenities ~0.75 mi
Loading nearby amenities…
Taxation est. · year 1
- Rental income
- $32,014
- − Mortgage interest
- −$23,471
- − Property taxes
- −$2,702
- − Insurance
- −$2,095
- − Repairs & maintenance
- −$2,561
- − Management
- −$2,561
- − Depreciation
- −$12,189
- Taxable loss
- −$13,564
- Est. tax savings @ 24.0%
- +$3,255
- After-tax cash flow
- $-2,617/yr
For passive investors: Depreciation is non-cash, so a rental often shows a tax loss while cash-flowing — sheltering income. Rental losses are passive: they offset passive income freely, and up to $25,000/yr can offset ordinary (W-2) income if you actively participate and your MAGI is under $100k (phasing out to $0 by $150k); unused losses carry forward. On sale, claimed depreciation is recaptured at up to 25%, and gains may owe capital-gains tax (a 1031 exchange can defer both). Figures are a year-1 estimate at your 24.0% rate — not tax advice; consult a CPA.
Schools (NCES district)
- District
- Blaine School District
- NCES district ID
- 5300570
- Math proficiency
- 49% ▼ -1.00%
- Reading proficiency
- 55% ▼ -2.00%
- Median HH income
- $57,085
- Composite
- 47.05/100
- National rank
- #5128
- State rank
- #120 of 291 in WA
Livability — Birch Bay
- Score
- 62/100
- State rank
- #406
- US rank
- #16180
Category grades
Schools grade is shown separately in the Schools card above.
Census & demographics
- Census place
- Birch Bay, WA
- County
- Whatcom County · 209,776 people
- Metro
- Bellingham, WA
- Population (ZIP)
- 18,744
- Household income
- $86,623
- Rent vs Own
- Severe rent burden
- 454.0
Population outlook (Whatcom County) Hauer SSP2
- Today (2025)
- 240,408 people
- By 2030
- 254,667 · +5.9%
- By 2040
- 281,365 · +17.0%
- By 2050
- 307,592 · +27.9%
- By 2075
- 375,576 · +56.2%
- By 2100
- 421,637 · +75.4%
Race, ethnicity, and origin ACS 2023
- Neighborhood character
- Predominantly White (77%)
- Race & ethnicity
- White 77% Two or more races 11% Hispanic / Latino 9% Asian 3% Pacific Islander 2% Black 1%
- Hispanic origin (detail)
- Mexican 5%
- Common ancestry
- Portuguese 6% Iranian 4% Lithuanian 3%
- Foreign-born
- 13% · Canada, China
- Languages at home
- 89% English-only · Spanish 4% Russian/Polish/Slavic 1% Other Indo-European 1%
Political lean MEDSL · Whatcom
- 2024 margin
- Strong D (+24.9) · D 60.8% · R 35.9% · Other 3.3%
- 2008→2024 swing
- +6.9pp toward D · 2008: 18.0pp · 2024: 24.9pp
- All cycles
- 2024: D+24.9 2020: D+23.9 2016: D+17.7 2012: D+12.1 2008: D+18.0
Not yet ingested
- Civics
- —
Market trends
- HPI YoY
- ▲ 106.58%
- Current HPI
- 868.68
- Rent YoY
- ▲ 3.10%
- Metro
- Bellingham, WA
- State GDP YoY
- ▲ 4.65%
- F500 in state
- 22
Industry mix (Fortune 500 HQ in WA)
| Industry | F500 HQs | Revenue |
|---|---|---|
| Retail | 2 | $269B |
|
||
| Technology / Retail | 1 | $638B |
|
||
| Technology | 1 | $245B |
|
||
| Telecommunications | 1 | $38B |
|
||
| Food / Beverage | 1 | $36B |
|
||
| Automotive / Trucks | 1 | $34B |
|
||
Price history
+33.0% since first listed11 events — show timeline
- 2026-04-30 Pending — NWMLS as Distributed by MLS Grid
- 2026-02-14 Price Changed $419,000 NWMLS as Distributed by MLS Grid
- 2026-01-06 Price Changed $435,000 NWMLS as Distributed by MLS Grid
- 2025-11-11 Listed $450,000 NWMLS as Distributed by MLS Grid
- 2021-12-01 Sold (MLS) $330,000 NWMLS as Distributed by MLS Grid
- 2021-10-12 Pending — NWMLS as Distributed by MLS Grid
- 2021-10-08 Relisted — NWMLS as Distributed by MLS Grid
- 2021-09-26 Pending — NWMLS as Distributed by MLS Grid
- 2021-09-23 Relisted — NWMLS as Distributed by MLS Grid
- 2021-09-21 Pending — NWMLS as Distributed by MLS Grid
- 2021-09-14 Listed $315,000 NWMLS as Distributed by MLS Grid
Property tax history
+5.0%/yrLatest (2026): $2,702 · +2.1% YoY. Source: county tax records.
Cash-flow waterfall
monthlySold comps — $/sqft
last 12 mo · ≤1 miLoading sold comps…