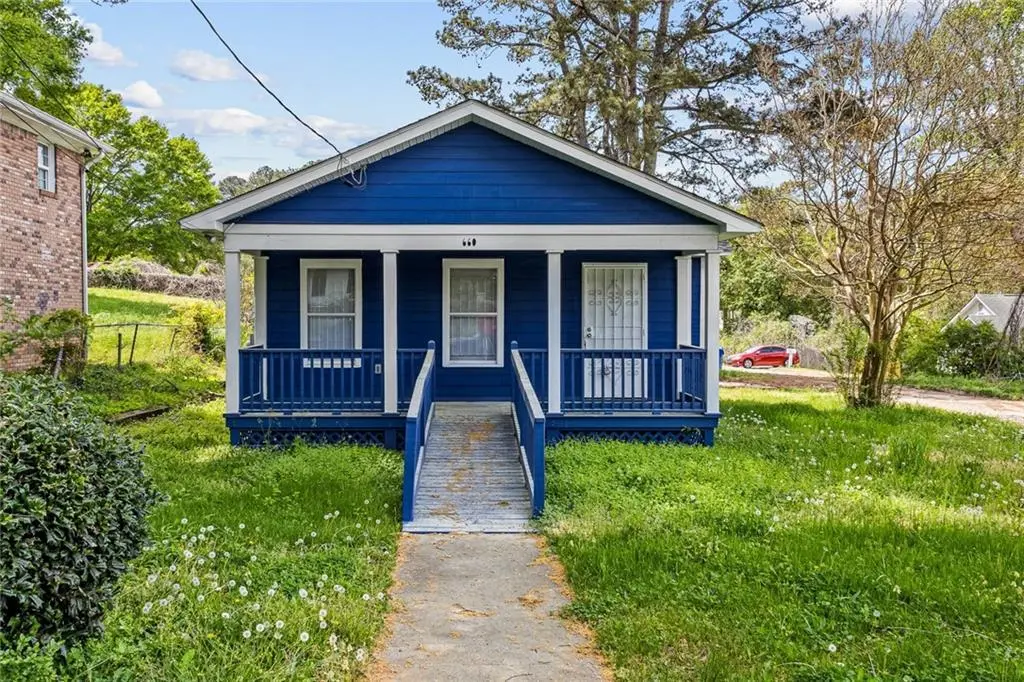
660 Cedar Ave NW · Atlanta, GA
Flood risk 1/10 · Minimal
- FEMA flood zone
- X (unshaded)
- Chance of flooding over 30 yrs
- 0.0%
- Est. flood insurance / yr
- $473 – $860
Fire risk 2/10 · Minimal
- Est. fire insurance / yr
- $963 – $1,789
Heat risk 5/10 · Moderate
- Hot days now (above 103°F)
- 7 days/yr
- Hot days in 30 yrs
- 18 days/yr
Wind risk 6/10 · Moderate
- Chance of severe wind over 30 yrs
- 27.0%
Air-quality risk 4/10 · Minor
- Unhealthy air days now
- 3 days/yr
- Unhealthy air days in 30 yrs
- 5 days/yr
Risk factors via First Street. Map © Google.
Why this score? — see what drove the D grade
The composite is a weighted blend of 9 inputs, each scored 0–100. Each bar is that input's sub-score; the figure is the points it added to the 100-point composite (weight × sub-score).
- ARV discount +15.0/15.0
- Cash flow +8.1/30.0
- Livability +4.2/5.0
- Rent growth +3.3/5.0
- Schools +2.7/10.0
- 1% rule +2.6/10.0
- Condition / age +2.5/5.0
- DSCR +2.1/10.0
- Appreciation +0.0/10.0
$259,999
🖨 Deal sheet (PDF) 📄 Offer letter ✓ Due diligence
Listing remarks MLS
Updated Westside Atlanta opportunity on a corner lot! This 3-bedroom, 1-bath home features fresh paint inside and out, new flooring, and an updated kitchen-making it move-in ready for a homeowner or a solid addition to a rental portfolio. Located in an area seeing ongoing growth and revitalization, this property offers both immediate livability and long-term upside. Ideal for buyers looking to get in at an accessible price point or investors seeking strong rental potential. Sold as-is.
Key facts
- Fresh paint
- New flooring
- Updated kitchen
Tags
Neighborhood map
What this means for you Summary
Snapshot
- This is a 3-bed/1.5-bath single-family listed at $260k.
Deal economics
- At list price, monthly cash flow is $-253 ($-3k/yr) — negative.
- To cash-flow at today's rent, offer at most $215k (17.2% below list).
- To meet the 1% rule (rent ≥ 1% of price), the offer needs to be $198k (23.7% below list).
- Recommended offer: $198k (23.7% below list) — sets the bar for 1% rule.
- Cap rate 5.1% vs local median 3.1% in Atlanta — top-decile yield for the area; either an underpriced asset or a hidden risk that comps aren't pricing in. Stress-test before assuming the spread holds.
Location & tenants
- Location reads 83/100 on livability (#6 in GA, #919 nationally) — a professional / high-income tenant draw. Strengths: amenities A+, commute A+, housing A+; Watch: cost of living C-.
- Atlanta Public Schools (urban): math 28% / reading 35% proficiency, ranked #80 of 174 in GA (top 46%) — families likely to look elsewhere, expect single-tenant / working-renter base with shorter leases; 71% free/reduced lunch — lower-income household profile, screen leases tightly.
- Zoned schools: Kipp Ways Primary Charter School (math 5% / reading 5%, grade F, #1,160 of 1,228 statewide, top 98%, 477 students, 100% FRL, charter); Frederick Douglass High School (math 24%, 1,112 students, 100% FRL) — zoned schools average 100% FRL vs 71% district-wide (29 pts higher); higher-poverty schools than district average — tighter screening recommended.
- Zoned-school proficiency averages 5% at this address vs 32% district-wide (-26 pts) — the specific schools serving this property underperform the Atlanta Public Schools average; the district grade overstates school quality for this exact location.
- Market conditions: Rents rising (+3.3%/yr); 732 active listings in the ZIP; 40 comparable units currently listed for rent nearby; rentals at typical pace (median 26d on market — plan ~3-4 weeks tenant-placement turnaround); solid renter incomes; 11,565 units permitted in Fulton County in 2024 (8,159 in 5+ unit buildings).
Forward outlook
- Local home prices are declining (-3.0%/yr); year-one equity from $2k of loan paydown is wiped out by about $8k of value loss. Plan a longer hold.
- Fulton County population projected at +38% by 2050 — long-run rental-demand tailwind backs the buy-and-hold thesis.
Negotiation context
- It's been on market 79 days — a 6% lower offer ($244k) is reasonable based on typical stale-listing flexibility.
- 5 sale attempts since 4y ago; this cycle's ask has dropped $40k (13%) from the opening price — seller is motivated, your offer sets the floor, not the list.
- Current owner paid $170k; list at $260k implies a 53% gain — meaningful room to come down on a strong offer.
Risks & watch-outs
- Climate carrying-cost: major wind risk, 27% chance of damaging wind over 30y; extreme-heat days projected 7→18/yr by 2055 (HVAC capex compounding) — expect insurance premiums to compound above CPI over the hold.
Questions for the listing agent
- What do current leases actually rent for vs. the listed asking? Can we see a recent rent roll and the last 12 months of T-12 income?
- It's been on market 79 days. Have you received any prior offers? Is the seller open to a 24% concession, seller financing, or rate buy-down credit?
- Why hasn't it sold? Are there any deal-killer items the seller is aware of (foundation, flood, title, zoning, code violations)?
- Is there a deadline driving the sale (1031 exchange, divorce, estate, relocation)? That informs how much negotiation room exists.
- The area grade is low — what's the realistic commute time and amenity access for the typical tenant pool here? Any planned neighborhood developments (good or bad) we should know about?
- What's the average days-on-market for RENTAL listings here right now (not sales)? A rising rental-DOM trend means longer vacancies and softer asking-rent achievability than the comps imply.
- What's the recent tenant-quality profile in this submarket — average credit score on applications, eviction rate, late-payment / NSF rate, and stable-employment percentage? A property-management company in the area should have these aggregated.
- How much new for-sale + rental construction is in the pipeline within 1–3 miles? Heavy new supply typically softens prices + rents 12–24 months out; constrained supply supports both.
Investment metrics
- 1% rule
- 0.76% ✗
- Cap rate
- 5.12%
- Cash-on-cash
- -4.17%
- DSCR
- 0.81
- GRM
- 10.9
CMA / ARV
- ARV (median comp)
- $328,431
- List price
- $259,999
- Delta
- -20.84%
- Verdict
- UNDERPRICED
- Comps
- 20 within 1.0 mi
Show comp detail 12 sales within ~0.75 mi
| Address | Dist | Beds/Ba | Sqft | Sold | Price | $/sf | Match |
|---|---|---|---|---|---|---|---|
| 540 Hamilton E Holmes Dr NW | 0.47mi | 3/1.0 | 1,140 (-0%) | 3mo | $125,000 | $110 | 73 |
| 705 S Grand Ave NW | 0.21mi | 2/2.0 (-1) | 1,228 (+7%) | 2mo | $265,000 | $216 | 70 |
| 2600 NW Baker Rd | 0.55mi | 3/2.0 | 1,135 (-1%) | 4mo | $122,600 | $108 | 68 |
| 477 Center Hill Ave NW | 0.35mi | 3/1.5 | 1,040 (-9%) | 3mo | $159,600 | $153 | 66 |
| 623 Hamilton E Holmes Dr NW | 0.42mi | 3/2.0 | 1,225 (+7%) | 4mo | $324,900 | $265 | 63 |
| 563 Center Hill Ave NW | 0.20mi | 4/2.0 (+1) | 1,015 (-11%) | 4mo | $195,000 | $192 | 62 |
| 2294 Hill St NW | 0.48mi | 3/2.0 | 1,040 (-9%) | 2mo | $307,500 | $296 | 58 |
| 672 Commercial Ave NW | 0.33mi | 3/2.0 | 1,297 (+13%) | 4mo | $364,900 | $281 | 57 |
| 620 Hamilton E Holmes Dr NW | 0.46mi | 3/2.0 | 1,286 (+12%) | 4mo | $302,120 | $235 | 52 |
| 673 Lyric Way NW | 0.64mi | 3/1.5 | 1,272 (+11%) | 3mo | $154,370 | $121 | 49 |
| 2105 Baker Rd NW | 0.56mi | 3/2.0 | 974 (-15%) | 2mo | $93,000 | $95 | 46 |
| 2541 Santa Barbara Dr NW | 0.60mi | 4/2.0 (+1) | 1,300 (+14%) | 0mo | $265,000 | $204 | 42 |
Match score weights: distance 35% · size 25% · config 20% · recency 20%. Top-matched comps best support the ARV.
Projected returns pro-forma
-3.0% appreciation · 3.26% rent growth · sell at horizon
- IRR
- -23.0%
- Equity multiple
- 0.21×
- Total profit
- $-57,691
- Equity at exit
- $38,767
- IRR
- -16.8%
- Equity multiple
- 0.06×
- Total profit
- $-68,673
- Equity at exit
- $22,480
Cash invested: $72,800 (down + closing). Projections, not guarantees.
Landlord ↔ Tenant lean methodology
- Overall (STATE)
- 90 Strongly Landlord-Friendly
- State Georgia
- 90 Strongly Landlord-Friendly · R+3
- County
- — inherits STATE
- City
- — inherits STATE
ZIP-level market 30318
- Rents YoY
- 3.3%
- Active inventory
- 732
- Price-to-rent
- 10.9×
Monthly cashflow live
- Estimated rent
- $1,983 high interval (Pro) →
- Mortgage (P&I)
- −$1,363
- Tax from tax record
- −$348 /mo · $4,178/yr
- Insurance
- −$108
- HOA
- −$0
- Vacancy / Maint / Mgmt
- −$416
- Net cashflow
- $-253
Break-even live
Sensitivity live
| Price | -10% $-106 | -5% $-180 | +0% $-253 | +5% $-327 | +10% $-400 |
|---|---|---|---|---|---|
| Rent | -10% $-410 | -5% $-332 | +0% $-253 | +5% $-175 | +10% $-96 |
| Rate | -1.0pp $-122 | -0.5pp $-187 | base $-253 | +0.5pp $-321 | +1.0pp $-389 |
UW: 25.0% down · 7.5% · 30yr · 1.5% tax · 5.0% vac · 8.0% maint · 8.0% mgmt
Financing live
Cash to close
- Down payment
- $65,000
- Closing costs
- $7,800
- Reserves months
- —
- Total cash needed
- —
Loan-product check · same deal, 3 products live
Conventional
25% down · 7.5% · 30yr
- Down + closing
- —
- Monthly P&I
- —
- Monthly cashflow
- —
- DSCR
- —
- Eligible?
- —
Personal DTI + credit; lowest rate.
DSCR
20% down · 8.5% · 30yr
- Down + closing
- —
- Monthly P&I
- —
- Monthly cashflow
- —
- DSCR
- —
- Eligible?
- —
No personal income docs; deal must DSCR.
Hard money
10% down · 12.0% · 12mo
- Down + closing
- —
- Monthly P&I
- —
- Monthly cashflow
- —
- DSCR
- —
- Eligible?
- —
Short-term bridge; refi at stabilization.
Rent comps 40 comps
| Address | Beds | Baths | Sqft | Rent | $/sqft | DOM | Units | Dist |
|---|---|---|---|---|---|---|---|---|
| 2364 Cross St NW Atlanta, GA | 3.0 | 1.0 | 1168 | $1,500 | $1.28 | 18d | 1 | 0.10mi |
| 717 Church St NW Atlanta, GA | 4.0 | 2.0 | 1328 | $2,000 | $1.51 | 26d | 1 | 0.14mi |
| 556 Church St NW Atlanta, GA | 2.0 | 2.0 | 1432 | $2,200 | $1.54 | 9d | 1 | 0.20mi |
| 2705 Lincoln Ct NW Atlanta, GA | 3.0 | 2.0 | 1134 | $2,050 | $1.81 | 19d | 1 | 0.32mi |
| 838 Ridge Ave NW Atlanta, GA | 3.0 | 2.5 | 1452 | $1,953 | $1.35 | 26d | 1 | 0.33mi |
| 2662 Hood Ave NW Atlanta, GA | 3.0 | 2.0 | 1450 | $2,000 | $1.38 | 26d | 1 | 0.35mi |
| 488 Park Valley Dr NW Atlanta, GA | 3.0 | 1.0 | 840 | $2,500 | $2.98 | 26d | 1 | 0.37mi |
| 848 Ridge Ave NW Unit A Atlanta, GA | 3.0 | 2.5 | 1410 | $1,875 | $1.33 | 26d | 1 | 0.38mi |
| 646 Robert St NW Atlanta, GA | 3.0 | 2.0 | 1374 | $2,400 | $1.75 | 20d | 1 | 0.38mi |
| 624 Robert St NW Atlanta, GA | 3.0 | 2.0 | 1221 | $3,000 | $2.46 | 26d | 1 | 0.39mi |
| 854 N Grand Ave NW Atlanta, GA | 4.0 | 2.5 | 1436 | $1,824 | $1.27 | 26d | 1 | 0.42mi |
| 874 Center Hill Ave NW Atlanta, GA | 3.0 | 2.0 | 1176 | $1,695 | $1.44 | 26d | 1 | 0.44mi |
| 2355 Hill St NW Atlanta, GA | 3.0 | 3.0 | 1320 | $1,700 | $1.29 | 26d | 1 | 0.49mi |
| 929 N Grand Ave NW Atlanta, GA | 3.0 | 2.0 | 1100 | $2,500 | $2.27 | 26d | 1 | 0.56mi |
| 991 Ada Ave NW Atlanta, GA | 4.0 | 2.0 | 1458 | $2,450 | $1.68 | 26d | 1 | 0.60mi |
| 2060 Baker Rd NW Atlanta, GA | 2.0 | 2.0 | 1436 | $2,100 | $1.46 | 5d | 1 | 0.66mi |
| 2740 Oldknow Dr NW Unit A Atlanta, GA | 2.0 | 2.0 | 1100 | $2,050 | $1.86 | 26d | 1 | 0.66mi |
| 24 S Eugenia Pl NW Atlanta, GA | 4.0 | 2.5 | 1410 | $1,725 | $1.22 | 26d | 1 | 0.71mi |
| 2762 Oldknow Dr NW Atlanta, GA | 2.0 | 1.0 | 880 | $1,600 | $1.82 | 26d | 1 | 0.71mi |
| 2732 Baker Ridge Dr NW Atlanta, GA | 3.0 | 1.5 | 1322 | $1,750 | $1.32 | 26d | 1 | 0.73mi |
| 2059 Detroit Ave NW Atlanta, GA | 2.0 | 1.0 | 750 | $1,340 | $1.79 | 23d | 1 | 0.75mi |
| 2595 Elliott St NW Atlanta, GA | 4.0 | 2.0 | 1101 | $1,900 | $1.73 | 12d | 1 | 0.75mi |
| 714 Emily Pl NW Atlanta, GA | 3.0 | 2.0 | 1492 | $2,700 | $1.81 | 4d | 1 | 0.79mi |
| 1958 Maywood Pl NW Atlanta, GA | 2.0 | 1.0 | 829 | $1,425 | $1.72 | 7d | 1 | 0.80mi |
| 1006 Hightower Rd NW Atlanta, GA | 3.0 | 2.0 | 1320 | $2,065 | $1.56 | 15d | 1 | 0.80mi |
| 38 Hollywood Dr NW Atlanta, GA | 4.0 | 2.0 | 1400 | $2,200 | $1.57 | 26d | 1 | 0.85mi |
| 511 Emily Pl NW Atlanta, GA | 3.0 | 1.0 | 1101 | $1,745 | $1.58 | 26d | 1 | 0.89mi |
| 2199 Tiger Flowers Dr NW Atlanta, GA | 3.0 | 1.0 | 936 | $1,325 | $1.42 | 26d | 1 | 0.90mi |
| 1948 Detroit Ave NW Unit A Atlanta, GA | 3.0 | 2.5 | 1205 | $1,900 | $1.58 | 26d | 1 | 0.97mi |
| 1026 Sims Ave NW Unit B Atlanta, GA | 4.0 | 3.0 | 1492 | $2,842 | $1.90 | 26d | 1 | 1.01mi |
| 156 Fairfield Pl NW Unit B-9 Atlanta, GA | 2.0 | 1.0 | 750 | $1,199 | $1.60 | 26d | 1 | 1.01mi |
| 1894 North Ave NW Atlanta, GA | 2.0 | 1.5 | 1098 | $1,995 | $1.82 | 26d | 1 | 1.01mi |
| 2590 Godfrey Dr NW Atlanta, GA | 3.0 | 2.0 | 1308 | $1,995 | $1.53 | 17d | 1 | 1.02mi |
| 1110 Cato St NW Atlanta, GA | 3.0 | 1.0 | 1050 | $1,400 | $1.33 | 26d | 1 | 1.03mi |
| 2284 Alvin Dr NW Unit B 1 Atlanta, GA | 3.0 | 1.0 | 875 | $1,025 | $1.17 | 4d | 1 | 1.03mi |
| 2284 Alvin Dr NW Unit B 1 Atlanta, GA | 3.0 | 1.0 | 875 | $1,025 | $1.17 | 0d | 1 | 1.03mi |
| 2284 Alvin Dr NW Unit D Atlanta, GA | 2.0 | 1.0 | 868 | $995 | $1.15 | 0d | 1 | 1.03mi |
| 2284 Alvin Dr NW Unit D Atlanta, GA | 2.0 | 1.0 | 868 | $995 | $1.15 | 4d | 1 | 1.03mi |
| 273 Wadley St NW Atlanta, GA | 3.0 | 2.0 | 1406 | $1,990 | $1.42 | 26d | 1 | 1.05mi |
| 308 Anderson Ave NW Unit A Atlanta, GA | 4.0 | 3.0 | 1250 | $2,200 | $1.76 | 26d | 1 | 1.06mi |
Listing history 34 events
-
2026-06-21days on market $259,999 Active 79 DOM
-
2026-06-18days on market $259,999 Active 76 DOM
-
2026-06-17days on market $259,999 Active 75 DOM
-
2026-06-16days on market $259,999 Active 74 DOM
-
2026-06-15days on market $259,999 Active 73 DOM
-
2026-06-13days on market $259,999 Active 71 DOM
-
2026-06-13days on market $259,999 Active 70 DOM
-
2026-06-09days on market $259,999 Active 67 DOM
-
2026-06-08days on market $259,999 Active 66 DOM
-
2026-06-07days on market $259,999 Active 65 DOM
-
2026-06-04days on market $259,999 Active 62 DOM
-
2026-06-03days on market $259,999 Active 61 DOM
-
2026-06-02days on market $259,999 Active 60 DOM
-
2026-06-01days on market $259,999 Active 59 DOM
-
2026-05-31days on market $259,999 Active 58 DOM
-
2026-05-12price $259,999 490-char remark
Show marketing remark (669 chars)
Ask about up to $20,000 in homebuyer grant funds and 100% financing options (no down payment & no PMI) available for qualified buyers through preferred lender programs. Updated Westside Atlanta opportunity on a corner lot! This 3-bedroom, 1-bath home features fresh paint inside and out, new flooring, and an updated kitchen—making it move-in ready for a homeowner or a solid addition to a rental portfolio. Located in an area seeing ongoing growth and revitalization, this property offers both immediate livability and long-term upside. Ideal for buyers looking to get in at an accessible price point or investors seeking strong rental potential. Sold as-is.
-
2026-05-12price $259,999 669-char remark
Show marketing remark (669 chars)
Ask about up to $20,000 in homebuyer grant funds and 100% financing options (no down payment & no PMI) available for qualified buyers through preferred lender programs. Updated Westside Atlanta opportunity on a corner lot! This 3-bedroom, 1-bath home features fresh paint inside and out, new flooring, and an updated kitchen—making it move-in ready for a homeowner or a solid addition to a rental portfolio. Located in an area seeing ongoing growth and revitalization, this property offers both immediate livability and long-term upside. Ideal for buyers looking to get in at an accessible price point or investors seeking strong rental potential. Sold as-is.
-
2026-03-31$300,000 New 490-char remark
Show marketing remark (669 chars)
Ask about up to $20,000 in homebuyer grant funds and 100% financing options (no down payment & no PMI) available for qualified buyers through preferred lender programs. Updated Westside Atlanta opportunity on a corner lot! This 3-bedroom, 1-bath home features fresh paint inside and out, new flooring, and an updated kitchen—making it move-in ready for a homeowner or a solid addition to a rental portfolio. Located in an area seeing ongoing growth and revitalization, this property offers both immediate livability and long-term upside. Ideal for buyers looking to get in at an accessible price point or investors seeking strong rental potential. Sold as-is.
-
2026-03-31$300,000 Active 669-char remark
Show marketing remark (669 chars)
Ask about up to $20,000 in homebuyer grant funds and 100% financing options (no down payment & no PMI) available for qualified buyers through preferred lender programs. Updated Westside Atlanta opportunity on a corner lot! This 3-bedroom, 1-bath home features fresh paint inside and out, new flooring, and an updated kitchen—making it move-in ready for a homeowner or a solid addition to a rental portfolio. Located in an area seeing ongoing growth and revitalization, this property offers both immediate livability and long-term upside. Ideal for buyers looking to get in at an accessible price point or investors seeking strong rental potential. Sold as-is.
-
2026-02-11soldstatus $170,000
-
2026-01-29status Pending
-
2026-01-28historical Active Under Contract
-
2026-01-27soldstatus $145,000 Closed
-
2026-01-15status Pending
-
2026-01-13historical Active Under Contract
-
2025-12-27$187,000 Active
-
2023-01-04soldstatus $160,000
-
2022-12-13soldstatus $160,000 Sold
-
2022-12-13soldstatus $160,000 Closed
-
2022-11-20status Pending
-
2022-11-20status Under Contract
-
2022-11-06$175,000 Active
-
2022-11-05$175,000 New
-
1999-08-06soldstatus $63,620
ⓘ Source: listings_history table (triggers on properties + properties_extension) + one-shot
backfill from property_details.listing_events for pre-trigger history.
Tax reassessment forecast GA · Resets to sale price
- Current annual tax
- $4,178 · $348/mo
- Projected year-2 tax
- $4,178 · $348/mo
- Expected delta
- $0/yr ($0/mo · 0.0%)
ⓘ Screening estimate from a state-policy table — verify with the county assessor before closing.
Climate risk First Street
- Flood 1/10 Low FEMA zone X (unshaded) · 0% chance over 30 yrs
- Wildfire 2/10 Low
- Heat 5/10 Major 7 d/yr ≥103°F today · 18 d/yr by 30 yrs out
- Wind 6/10 Major 27% chance of damaging wind over 30 yrs
- Air quality 4/10 Moderate 3 unhealthy d/yr today · 5 by 30 yrs out
Nearby sold comps map
Loading sold comps map…
Walkable amenities ~0.75 mi
Loading nearby amenities…
Taxation est. · year 1
- Rental income
- $23,799
- − Mortgage interest
- −$14,564
- − Property taxes
- −$4,178
- − Insurance
- −$1,300
- − Repairs & maintenance
- −$1,904
- − Management
- −$1,904
- − Depreciation
- −$7,564
- Taxable loss
- −$7,614
- Est. tax savings @ 24.0%
- +$1,827
- After-tax cash flow
- $-1,211/yr
For passive investors: Depreciation is non-cash, so a rental often shows a tax loss while cash-flowing — sheltering income. Rental losses are passive: they offset passive income freely, and up to $25,000/yr can offset ordinary (W-2) income if you actively participate and your MAGI is under $100k (phasing out to $0 by $150k); unused losses carry forward. On sale, claimed depreciation is recaptured at up to 25%, and gains may owe capital-gains tax (a 1031 exchange can defer both). Figures are a year-1 estimate at your 24.0% rate — not tax advice; consult a CPA.
Schools (NCES district)
- District
- Atlanta Public Schools
- NCES district ID
- 1300120
- Math proficiency
- 28% ▼ -6.00%
- Reading proficiency
- 35% ▼ -2.00%
- Median HH income
- $48,306
- Composite
- 27.27/100
- National rank
- #7006
- State rank
- #80 of 174 in GA
Livability — Atlanta
- Score
- 83/100
- State rank
- #6
- US rank
- #919
Category grades
Schools grade is shown separately in the Schools card above.
Census & demographics
- Census place
- Atlanta, GA
- County
- Fulton County · 1,094,430 people
- City population
- 629,525
- Metro
- Atlanta-Sandy Springs-Alpharetta, GA
- Population (ZIP)
- 59,609
- Household income
- $83,116
- Rent vs Own
- Severe rent burden
- 4182.0
Population outlook (Fulton County) Hauer SSP2
- Today (2025)
- 1,203,707 people
- By 2030
- 1,299,706 · +8.0%
- By 2040
- 1,488,256 · +23.6%
- By 2050
- 1,664,580 · +38.3%
- By 2075
- 2,036,072 · +69.2%
- By 2100
- 2,222,402 · +84.6%
Race, ethnicity, and origin ACS 2023
- Neighborhood character
- Diverse neighborhood (Simpson 0.63)
- Race & ethnicity
- Black 49% White 35% Hispanic / Latino 7% Two or more races 6% Asian 5%
- Hispanic origin (detail)
- Mexican 2% Puerto Rican 1%
- Common ancestry
- Lithuanian 2% Slovak 2% Romanian 1%
- Foreign-born
- 8% · Canada, China, South Korea
- Languages at home
- 88% English-only · Spanish 4% Other Indo-European 2% Other Asian/Pacific 1%
Political lean MEDSL · Fulton
- 2024 margin
- Solid D (+44.9) · D 71.9% · R 27.0% · Other 1.1%
- 2008→2024 swing
- +9.8pp toward D · 2008: 35.0pp · 2024: 44.9pp
- All cycles
- 2024: D+44.9 2020: D+46.4 2016: D+42.1 2012: D+29.6 2008: D+35.0
Not yet ingested
- Civics
- —
Market trends
- HPI YoY
- ▼ -470.82%
- Current HPI
- 224.1493
- Rent YoY
- ▲ 3.26%
- Metro
- Atlanta-Sandy Springs-Alpharetta, GA
- State GDP YoY
- ▲ 2.66%
- F500 in state
- 28
Industry mix (Fortune 500 HQ in GA)
| Industry | F500 HQs | Revenue |
|---|---|---|
| Paper / Packaging | 2 | $29B |
|
||
| Retail | 1 | $160B |
|
||
| Transportation / Logistics | 1 | $91B |
|
||
| Airlines | 1 | $62B |
|
||
| Consumer Goods | 1 | $47B |
|
||
| Utilities | 1 | $25B |
|
||
Price history
+308.7% since first listed19 events — show timeline
- 2026-05-12 Price Changed $259,999 GAMLS
- 2026-05-12 Price Changed $259,999 FMLS
- 2026-03-31 Listed $300,000 FMLS
- 2026-03-31 Listed $300,000 GAMLS
- 2026-02-11 Sold (Public Records) $170,000 Public Records
- 2026-01-29 Pending — FMLS
- 2026-01-28 Contingent — FMLS
- 2026-01-27 Sold (MLS) $145,000 FMLS
- 2026-01-15 Pending — FMLS
- 2026-01-13 Contingent — FMLS
- 2025-12-27 Listed $187,000 FMLS
- 2023-01-04 Sold (Public Records) $160,000 Public Records
- 2022-12-13 Sold (MLS) $160,000 FMLS
- 2022-12-13 Sold (MLS) $160,000 GAMLS
- 2022-11-20 Pending — FMLS
- 2022-11-20 Pending — GAMLS
- 2022-11-06 Listed $175,000 FMLS
- 2022-11-05 Listed $175,000 GAMLS
- 1999-08-06 Sold (Public Records) $63,620 Public Records
Property tax history
+14.5%/yrLatest (2025): $4,178 · +172.4% YoY. Source: county tax records.
Cash-flow waterfall
monthlySold comps — $/sqft
last 12 mo · ≤1 miLoading sold comps…