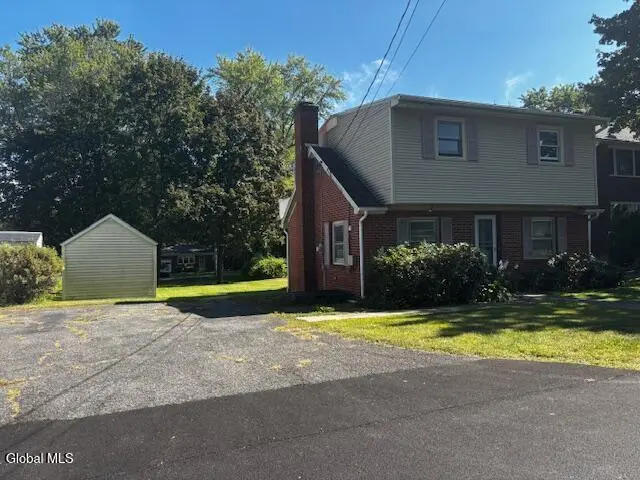
6 Pine St · Albany, NY
Flood risk 1/10 · Minimal
- FEMA flood zone
- X (unshaded)
- Chance of flooding over 30 yrs
- 0.0%
- Est. flood insurance / yr
- $507 – $1,088
Fire risk 1/10 · Minimal
- Est. fire insurance / yr
- $691 – $1,283
Heat risk 4/10 · Minor
- Hot days now (above 98°F)
- 7 days/yr
- Hot days in 30 yrs
- 16 days/yr
Wind risk 3/10 · Minor
- Chance of severe wind over 30 yrs
- 6.0%
Air-quality risk 1/10 · Minimal
- Unhealthy air days now
- 0 days/yr
- Unhealthy air days in 30 yrs
- 0 days/yr
Risk factors via First Street. Map © Google.
Why this score? — see what drove the C+ grade
The composite is a weighted blend of 9 inputs, each scored 0–100. Each bar is that input's sub-score; the figure is the points it added to the 100-point composite (weight × sub-score).
- Cash flow +20.9/30.0
- ARV discount +15.0/15.0
- DSCR +6.7/10.0
- Schools +5.7/10.0
- 1% rule +4.6/10.0
- Livability +4.0/5.0
- Rent growth +3.0/5.0
- Condition / age +2.5/5.0
- Appreciation +0.0/10.0
$220,000
🖨 Deal sheet 📄 Offer letter ✓ Due diligence
Listing remarks
PRIME LOCATION & AWESOME OPPORTUNITY TO PUT YOUR FINAL PERSONAL TOUCHES ON THIS 2-3 BEDROOM 2 FULL BATH HOME. HOME FEATURES: LARGE KITCHEN & DINING, LIVING ROOM, FIRST FLOOR FULL BATH & COMBINED 1ST FLOOR LAUNDRY, WASHER & DRYER INCLUDED, 2-3 BEDROOMS ON THE 2ND FLOOR W FULL BATH. THAT INCLUDES A PRIMARY BEDROOM THAT LEADS TO A BEAUTIFUL WALK OUT COMPOSITE DECK TO ENJOY, NEWER CUSTOM SHED OUT BACK INCLUDED THAT INCLUDES A NICE YARD TO ENJOY. AMPLE PARKING OUTFRONT, STAY COOL DURING SUMMER MONTHS WITH CENTRAL AIR. HOME IS CLOSE TO SCHOOLS, STUYVESANT PLAZA, CROSSGATES MALL, HIGHWAY ACCESS, PARKS, LOCAL RESTUARANTS & SHOPPING. AWESOME OPPORTUNITY TO PUT YOUR FINA
Key facts
- Ample parking
- Large kitchen
- Central air
Tags
Neighborhood map
What this means for you Summary
Snapshot
- This is a 3-bed/1.5-bath single-family listed at $220k.
Deal economics
- At list price, monthly cash flow is $308 ($4k/yr) — positive.
- The deal already cash-flows at list — no discount required.
- To meet the 1% rule (rent ≥ 1% of price), the offer needs to be $212k (3.7% below list).
- Recommended offer: $212k (3.7% below list) — sets the bar for 1% rule.
- Cap rate 8.0% vs local median 5.7% in Albany — top-decile yield for the area; either an underpriced asset or a hidden risk that comps aren't pricing in. Stress-test before assuming the spread holds.
Location & tenants
- Location reads 79/100 on livability (#129 in NY, #2,083 nationally) — a middle-class / working-renter tenant base. Strengths: amenities A+, commute A+, housing A+; Watch: employment C-, crime F.
- Guilderland Central School District (suburban): math 61% / reading 68% proficiency, ranked #166 of 590 in NY (top 28%) — acceptable for families but not a draw, mixed tenant base, ~2y average lease; only 10% free/reduced lunch — higher-income household profile.
- Zoned schools: Guilderland Elementary School (math 62% / reading 67%, grade B, #591 of 2,108 statewide, top 31%, 475 students, 22% FRL); Guilderland High School (math 97% / reading 82%, grade A+, #265 of 1,100 statewide, top 26%, 1,462 students, 23% FRL).
- Zoned-school proficiency averages 77% at this address vs 64% district-wide (+12 pts) — the actual schools serving this property are materially stronger than the Guilderland Central School District average implies; a family-tenant draw the district grade alone would hide.
- Market conditions: Rents rising (+1.9%/yr); 124 active listings in the ZIP; 9 comparable units currently listed for rent nearby; rentals at typical pace (median 14d on market — plan ~3-4 weeks tenant-placement turnaround); solid renter incomes; 675 units permitted in Albany County in 2024 (451 in 5+ unit buildings).
- This rent runs 31% of the median local income ($83k/yr) — at the standard rent-burdened threshold; future hikes will face affordability resistance.
Forward outlook
- Local home prices are declining (-3.0%/yr); year-one equity from $2k of loan paydown is wiped out by about $7k of value loss. Plan a longer hold.
- Albany County population projected at +9% by 2050 — modest demand growth; plan on rents tracking national, not racing it.
Negotiation context
- Only 6 days on market — expect competitive offers; lowballing is unlikely to land.
- 9 sale attempts since 25y ago with the ask held roughly flat each time — persistent listings suggest the price (not the market) is what's stuck; bring a comps-based counter.
- Current owner paid $76k; list at $220k implies a 189% gain — meaningful room to come down on a strong offer.
Risks & watch-outs
- Watch-outs: built in 1940 — expect roof / HVAC / electrical / plumbing capex.
Questions for the listing agent
- Built in 1940 — when were the roof, HVAC, electrical panel, plumbing, and water heater last replaced?
- Is there a deadline driving the sale (1031 exchange, divorce, estate, relocation)? That informs how much negotiation room exists.
- Crime grade is F in this area — have there been break-ins, vandalism, or insurance claims at this property in the last 3 years? What carrier currently insures it and at what premium?
- What's the average days-on-market for RENTAL listings here right now (not sales)? A rising rental-DOM trend means longer vacancies and softer asking-rent achievability than the comps imply.
- What's the recent tenant-quality profile in this submarket — average credit score on applications, eviction rate, late-payment / NSF rate, and stable-employment percentage? A property-management company in the area should have these aggregated.
- How much new for-sale + rental construction is in the pipeline within 1–3 miles? Heavy new supply typically softens prices + rents 12–24 months out; constrained supply supports both.
Investment metrics
- 1% rule
- 0.96% ✗
- Cap rate
- 7.97%
- Cash-on-cash
- 5.99%
- DSCR
- 1.27
- GRM
- 8.7
CMA / ARV
- ARV (on-the-fly)
- $279,480
- Comps found
- 12
Show comp detail 12 sales within ~0.75 mi
| Address | Dist | Beds/Ba | Sqft | Sold | Price | $/sf | Match |
|---|---|---|---|---|---|---|---|
| 442 Russell Rd | 0.18mi | 2/1.0 (-1) | 1,102 (+0%) | 1mo | $341,237 | $310 | 83 |
| 6 Monroe Ave | 0.18mi | 3/1.0 | 1,009 (-8%) | 8mo | $250,000 | $248 | 70 |
| 462 Russell Rd | 0.20mi | 3/1.5 | 1,216 (+11%) | 7mo | $310,000 | $255 | 67 |
| 5 Tryon Ct | 0.46mi | 2/1.5 (-1) | 1,107 (+1%) | 6mo | $270,000 | $244 | 67 |
| 39 Taft Ave | 0.66mi | 3/1.0 | 1,150 (+5%) | 0mo | $292,000 | $254 | 58 |
| 45 Fountain Ave | 0.45mi | 2/1.0 (-1) | 1,160 (+6%) | 6mo | $215,000 | $185 | 57 |
| 36 Fay St | 0.38mi | 3/2.0 | 1,232 (+12%) | 6mo | $332,500 | $270 | 54 |
| 12 Gage Ave | 0.41mi | 3/1.5 | 936 (-15%) | 6mo | $260,000 | $278 | 52 |
| 96 Hazelhurst Ave | 0.56mi | 4/1.0 (+1) | 1,188 (+8%) | 5mo | $255,000 | $215 | 49 |
| 32 Homestead St | 0.56mi | 2/1.0 (-1) | 981 (-10%) | 5mo | $219,900 | $224 | 45 |
| 36 Edenburg Ave | 0.59mi | 2/1.0 (-1) | 936 (-15%) | 4mo | $245,000 | $262 | 38 |
| 99 Vaughn Dr | 0.71mi | 3/2.5 | 1,255 (+14%) | 7mo | $339,000 | $270 | 33 |
Match score weights: distance 35% · size 25% · config 20% · recency 20%. Top-matched comps best support the ARV.
Projected returns pro-forma
-3.0% appreciation · 1.85% rent growth · sell at horizon
- IRR
- -8.3%
- Equity multiple
- 0.70×
- Total profit
- $-18,547
- Equity at exit
- $32,803
- IRR
- -0.2%
- Equity multiple
- 0.99×
- Total profit
- $-900
- Equity at exit
- $19,022
Cash invested: $61,600 (down + closing). Projections, not guarantees.
Landlord ↔ Tenant lean methodology
- Overall (STATE)
- 15 Strongly Tenant-Friendly
- State New York
- 15 Strongly Tenant-Friendly · D+10
- County
- — inherits STATE
- City
- — inherits STATE
ZIP-level market 12203
- Home prices YoY
- -31.0%
- Rents YoY
- 1.9%
- Active inventory
- 124
- Price-to-rent
- 8.7×
Monthly cashflow live
- Estimated rent
- $2,119 high interval (Pro) →
- Mortgage (P&I)
- −$1,154
- Tax from tax record
- −$121 /mo · $1,449/yr
- Insurance
- −$92
- HOA
- −$0
- Vacancy / Maint / Mgmt
- −$445
- Net cashflow
- $308
Break-even live
UW: 25.0% down · 7.5% · 30yr · 1.5% tax · 5.0% vac · 8.0% maint · 8.0% mgmt
Financing live
Cash to close
- Down payment
- $55,000
- Closing costs
- $6,600
- Reserves months
- —
- Total cash needed
- —
Loan-product check · same deal, 3 products live
Conventional
25% down · 7.5% · 30yr
- Down + closing
- —
- Monthly P&I
- —
- Monthly cashflow
- —
- DSCR
- —
- Eligible?
- —
Personal DTI + credit; lowest rate.
DSCR
20% down · 8.5% · 30yr
- Down + closing
- —
- Monthly P&I
- —
- Monthly cashflow
- —
- DSCR
- —
- Eligible?
- —
No personal income docs; deal must DSCR.
Hard money
10% down · 12.0% · 12mo
- Down + closing
- —
- Monthly P&I
- —
- Monthly cashflow
- —
- DSCR
- —
- Eligible?
- —
Short-term bridge; refi at stabilization.
Rent comps 9 comps
| Address | Beds | Baths | Sqft | Rent | $/sqft | DOM | Units | Dist |
|---|---|---|---|---|---|---|---|---|
| 23 The Concourse Unit 21 Albany, NY | 2.0 | 1.0 | 1200 | $2,000 | $1.67 | 13d | 1 | 0.28mi |
| 32 Moreland Ave Unit NA Albany, NY | 3.0 | 1.5 | 1500 | $2,300 | $1.53 | 21d | 1 | 0.31mi |
| 416 Greenhill Ct Albany, NY | 2.0 | 1.5 | 1350 | $2,200 | $1.63 | 43d | 1 | 0.42mi |
| 2 Friebel Rd Albany, NY | 3.0 | 2.0 | 1392 | $2,200 | $1.58 | 13d | 1 | 0.98mi |
| 1 Colatosti Pl Albany, NY | 2.0 | 1.0 | 1000 | $1,595 | $1.59 | 14d | 1 | 1.00mi |
| 55 Woodlake Rd Albany, NY | 1.0–2.0 | 1.0–2.0 | 903 | $2,050 | $2.27 | 13d | 1 | 1.06mi |
| 845 New Scotland Ave Unit 4 Albany, NY | 2.0 | 1.0 | 800 | $1,450 | $1.81 | 43d | 1 | 1.15mi |
| 9 Circle Ln Albany, NY | 2.0 | 1.0 | 771 | $1,805 | $2.34 | 14d | 1 | 1.18mi |
| 53 Greenway N Albany, NY | 3.0 | 2.0 | 1500 | $2,600 | $1.73 | 23d | 1 | 1.44mi |
Listing history 23 events
-
2026-04-22status Pending
-
2026-04-16$220,000 Active
-
2026-03-10price $225,000
-
2026-03-09status Active
-
2026-02-05status Pending
-
2026-02-05historical
-
2026-01-18status Active
-
2025-12-11status Pending
-
2025-12-03price $235,000
-
2025-10-09price $245,000
-
2025-09-10$260,000 Active
-
2024-10-13historical $900
-
2024-10-07$900
-
2024-09-19historical $1,100
-
2024-09-12$1,100
-
2019-02-04historical
-
2018-12-01$546,000 New
-
2002-04-11soldstatus $76,000
-
2002-04-08soldstatus $76,000
-
2002-01-28soldstatus $98,000
-
2001-12-05$75,900
-
2001-08-13historical
-
2001-04-30$125,000
ⓘ Source: listings_history table (triggers on properties + properties_extension) + one-shot
backfill from property_details.listing_events for pre-trigger history.
Tax reassessment forecast NY · Partial reset (capped growth)
- Current annual tax
- $1,449 · $121/mo
- Projected year-2 tax
- $2,583 · $215/mo
- Expected delta
- +$1,135/yr (+$95/mo · 78.3%)
ⓘ Screening estimate from a state-policy table — verify with the county assessor before closing.
Climate risk First Street
- Flood 1/10 Low FEMA zone X (unshaded) · 0% chance over 30 yrs
- Wildfire 1/10 Low
- Heat 4/10 Moderate 7 d/yr ≥98°F today · 16 d/yr by 30 yrs out
- Wind 3/10 Moderate 6% chance of damaging wind over 30 yrs
- Air quality 1/10 Low 0 unhealthy d/yr today · 0 by 30 yrs out
Nearby sold comps map
Loading sold comps map…
Walkable amenities ~0.75 mi
Loading nearby amenities…
Taxation est. · year 1
- Rental income
- $25,423
- − Mortgage interest
- −$12,323
- − Property taxes
- −$1,449
- − Insurance
- −$1,100
- − Repairs & maintenance
- −$2,034
- − Management
- −$2,034
- − Depreciation
- −$6,400
- Taxable income
- $83
- Est. tax owed @ 24.0%
- −$20
- After-tax cash flow
- $3,671/yr
For passive investors: Depreciation is non-cash, so a rental often shows a tax loss while cash-flowing — sheltering income. Rental losses are passive: they offset passive income freely, and up to $25,000/yr can offset ordinary (W-2) income if you actively participate and your MAGI is under $100k (phasing out to $0 by $150k); unused losses carry forward. On sale, claimed depreciation is recaptured at up to 25%, and gains may owe capital-gains tax (a 1031 exchange can defer both). Figures are a year-1 estimate at your 24.0% rate — not tax advice; consult a CPA.
Schools (NCES district)
- District
- Guilderland Central School District
- NCES district ID
- 3613080
- Math proficiency
- 61% ▼ -8.00%
- Reading proficiency
- 68% ▲ 5.00%
- Median HH income
- $75,669
- Composite
- 57.24/100
- National rank
- #1093
- State rank
- #166 of 590 in NY
Livability — Albany
- Score
- 79/100
- State rank
- #129
- US rank
- #2083
Category grades
Schools grade is shown separately in the Schools card above.
Census & demographics
- County
- Albany County · 196,626 people
- City population
- 116,921
- Metro
- Albany-Schenectady-Troy, NY
- Population (ZIP)
- 30,771
- Household income
- $83,147
- Rent vs Own
- Severe rent burden
- 1704.0
Population outlook (Albany County) Hauer SSP2
- Today (2025)
- 320,794 people
- By 2030
- 327,401 · +2.1%
- By 2040
- 338,218 · +5.4%
- By 2050
- 348,467 · +8.6%
- By 2075
- 381,693 · +19.0%
- By 2100
- 393,809 · +22.8%
Race, ethnicity, and origin ACS 2023
- Neighborhood character
- Predominantly White (69%)
- Race & ethnicity
- White 69% Black 10% Asian 8% Hispanic / Latino 7% Two or more races 7%
- Hispanic origin (detail)
- Mexican 2% Puerto Rican 2%
- Common ancestry
- Romanian 5% Lithuanian 3% Slovak 2%
- Foreign-born
- 16% · Canada, China, South Korea
- Languages at home
- 82% English-only · Other Indo-European 6% Spanish 3% Russian/Polish/Slavic 2%
Political lean MEDSL · Albany
- 2024 margin
- Strong D (+25.8) · D 62.9% · R 37.1%
- 2008→2024 swing
- -3.6pp toward R · 2008: 29.4pp · 2024: 25.8pp
- All cycles
- 2024: D+25.8 2020: D+31.4 2016: D+24.3 2012: D+31.0 2008: D+29.4
Not yet ingested
- Civics
- —
Market trends
- HPI YoY
- ▼ -133.05%
- Current HPI
- 296.0467
- Rent YoY
- ▲ 1.85%
- Metro
- Albany-Schenectady-Troy, NY
- State GDP YoY
- ▲ 2.60%
- F500 in state
- 92
Industry mix (Fortune 500 HQ in NY)
| Industry | F500 HQs | Revenue |
|---|---|---|
| Financial Services | 10 | $950B |
|
||
| Consumer Goods | 9 | $162B |
|
||
| Insurance | 4 | $225B |
|
||
| Telecommunications | 2 | $144B |
|
||
| Pharmaceuticals | 2 | $112B |
|
||
| Media / Entertainment | 2 | $69B |
|
||
Price history
+76.0% since first listed23 events — show timeline
- 2026-04-22 Pending — Global MLS
- 2026-04-16 Listed $220,000 Global MLS
- 2026-03-10 Price Changed $225,000 Global MLS
- 2026-03-09 Relisted — Global MLS
- 2026-02-05 Pending — Global MLS
- 2026-02-05 Listing Removed — Global MLS
- 2026-01-18 Relisted — Global MLS
- 2025-12-11 Pending — Global MLS
- 2025-12-03 Price Changed $235,000 Global MLS
- 2025-10-09 Price Changed $245,000 Global MLS
- 2025-09-10 Listed $260,000 Global MLS
- 2024-10-13 Rental Removed $900 LEASESTAR
- 2024-10-07 Listed for Rent $900 LEASESTAR
- 2024-09-19 Rental Removed $1,100 LEASESTAR
- 2024-09-12 Listed for Rent $1,100 LEASESTAR
- 2019-02-04 Listing Removed — Global MLS
- 2018-12-01 Listed $546,000 Global MLS
- 2002-04-11 Sold (Public Records) $76,000 Public Records
- 2002-04-08 Sold (MLS) $76,000 Global MLS
- 2002-01-28 Sold (MLS) $98,000 Global MLS
- 2001-12-05 Listed $75,900 Global MLS
- 2001-08-13 Listing Removed — Global MLS
- 2001-04-30 Listed $125,000 Global MLS
Property tax history
-0.9%/yrLatest (2025): $1,449 · +3.0% YoY. Source: county tax records.
Cash-flow waterfall
monthlySold comps — $/sqft
last 12 mo · ≤1 miLoading sold comps…