207 Lindale St Unit A · Clinton, MS
Flood risk 1/10 · Minimal
- FEMA flood zone
- X (unshaded)
- Chance of flooding over 30 yrs
- 0.0%
- Est. flood insurance / yr
- $507 – $1,088
Fire risk 1/10 · Minimal
- Est. fire insurance / yr
- $1,241 – $2,305
Heat risk 7/10 · Major
- Hot days now (above 109°F)
- 7 days/yr
- Hot days in 30 yrs
- 21 days/yr
Wind risk 8/10 · Major
- Chance of severe wind over 30 yrs
- 80.0%
Air-quality risk 1/10 · Minimal
- Unhealthy air days now
- 0 days/yr
- Unhealthy air days in 30 yrs
- 0 days/yr
Risk factors via First Street. Map © Google.
Why this score? — see what drove the B+ grade
The composite is a weighted blend of 9 inputs, each scored 0–100. Each bar is that input's sub-score; the figure is the points it added to the 100-point composite (weight × sub-score).
- Cash flow +30.0/30.0
- ARV discount +15.0/15.0
- 1% rule +10.0/10.0
- DSCR +10.0/10.0
- Schools +4.8/10.0
- Livability +3.5/5.0
- Condition / age +2.2/5.0
- Rent growth +1.6/5.0
- Appreciation +0.0/10.0
$75,000
🖨 Deal sheet 📄 Offer letter ✓ Due diligence
Listing remarks MLS
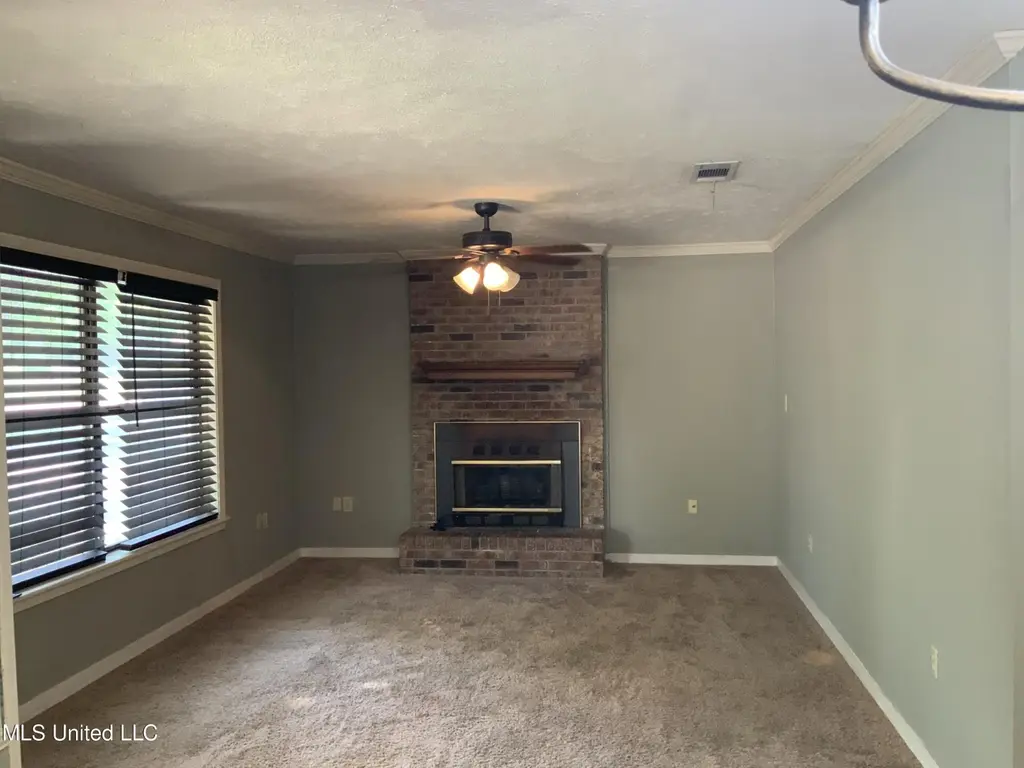
Great home need a a little TLC
Key facts
- 6,969 sq ft lot
- Garage
- Built 1978
Neighborhood map
What this means for you Summary
Snapshot
- This is a 3-bed/2.0-bath single-family listed at $75k. Condition is rated fair.
Deal economics
- At list price, monthly cash flow is $777 ($9k/yr) — positive.
- The deal already cash-flows at list — no discount required.
- Meets the 1% rule at list price ($2k rent vs $75k).
- Recommended offer: $70k (6.0% below list) — sets the bar for market timing.
- Cap rate 18.7% vs local median 4.3% in Clinton — top-decile yield for the area; either an underpriced asset or a hidden risk that comps aren't pricing in. Stress-test before assuming the spread holds.
Location & tenants
- Location reads 69/100 on livability (#49 in MS) — a middle-class / working-renter tenant base. Strengths: crime A+, cost of living A+, housing A+; Watch: amenities F, commute F, health & safety F.
- Clinton Public School District (rural): math 58% / reading 53% proficiency, ranked #4 of 130 in MS (top 3%) — acceptable for families but not a draw, mixed tenant base, ~2y average lease.
- Market conditions: Rents falling (-3.7%/yr); 233 active listings in the ZIP; 7 comparable units currently listed for rent nearby; rentals at typical pace (median 14d on market — plan ~3-4 weeks tenant-placement turnaround); solid renter incomes; 167 units permitted in Hinds County in 2024 (0 in 5+ unit buildings).
Forward outlook
- Local home prices are declining (-3.0%/yr); year-one equity from $519 of loan paydown is wiped out by about $2k of value loss. Plan a longer hold.
- Hinds County population projected to shrink 6% by 2050 — rents likely to lag national; underwrite the cash flow, not the appreciation.
- At projected returns (-3.0% appreciation + 0.0% rent growth), your $21k cash investment doubles in ~3 years — after that, you're playing with house money.
Negotiation context
- It's been on market 80 days — a 6% lower offer ($70k) is reasonable based on typical stale-listing flexibility.
- 3 sale attempts since 25y ago; this cycle's ask has dropped $15k (17%) from the opening price — seller is motivated, your offer sets the floor, not the list.
Risks & watch-outs
- Climate carrying-cost: severe wind risk, 80% chance of damaging wind over 30y; extreme-heat days projected 7→21/yr by 2055 (HVAC capex compounding) — expect insurance premiums to compound above CPI over the hold.
Questions for the listing agent
- It's been on market 80 days. Have you received any prior offers? Is the seller open to a 6% concession, seller financing, or rate buy-down credit?
- Have any recent inspections been done? Can we get a copy of the seller's disclosures and any deferred-maintenance estimates?
- Built in 1978 — when were the roof, HVAC, electrical panel, plumbing, and water heater last replaced?
- Why hasn't it sold? Are there any deal-killer items the seller is aware of (foundation, flood, title, zoning, code violations)?
- Is there a deadline driving the sale (1031 exchange, divorce, estate, relocation)? That informs how much negotiation room exists.
- Schools are B-rated — typically a magnet for longer-tenancy family renters. What's the average tenant stay here, and is there a school-zone premium baked into asking?
- What's the average days-on-market for RENTAL listings here right now (not sales)? A rising rental-DOM trend means longer vacancies and softer asking-rent achievability than the comps imply.
- What's the recent tenant-quality profile in this submarket — average credit score on applications, eviction rate, late-payment / NSF rate, and stable-employment percentage? A property-management company in the area should have these aggregated.
- How much new for-sale + rental construction is in the pipeline within 1–3 miles? Heavy new supply typically softens prices + rents 12–24 months out; constrained supply supports both.
Investment metrics
- 1% rule
- 2.19% ✓
- Cap rate
- 18.72%
- Cash-on-cash
- 44.39%
- DSCR
- 2.97
- GRM
- 3.8
CMA / ARV
- ARV (median comp)
- $122,027
- List price
- $75,000
- Delta
- -38.54%
- Verdict
- UNDERPRICED
- Comps
- 1 within 2.0 mi
Show comp detail 7 sales within ~0.75 mi
| Address | Dist | Beds/Ba | Sqft | Sold | Price | $/sf | Match |
|---|---|---|---|---|---|---|---|
| 222 N Shadow Lake Dr | 0.11mi | 2/2.0 (-1) | 1,181 (-2%) | 9mo | $118,000 | $100 | 80 |
| 1110 Post Rd | 0.63mi | 3/2.0 | 1,350 (+12%) | 1mo | $185,000 | $137 | 49 |
| 800 Longwood Pl | 0.67mi | 3/2.0 | 1,326 (+10%) | 6mo | $188,000 | $142 | 46 |
| 213 W Lakeview Dr | 0.51mi | 3/1.5 | 1,360 (+13%) | 8mo | $165,000 | $121 | 46 |
| 1001 Arlington St | 0.67mi | 3/2.0 | 1,312 (+9%) | 18mo | $140,000 | $107 | 38 |
| 918 Post Rd | 0.63mi | 3/2.0 | 1,336 (+11%) | 21mo | $182,000 | $136 | 34 |
| 1007 Amherst St | 0.74mi | 3/2.0 | 1,370 (+14%) | 23mo | $215,000 | $157 | 22 |
Match score weights: distance 35% · size 25% · config 20% · recency 20%. Top-matched comps best support the ARV.
Projected returns pro-forma
-3.0% appreciation · 0.0% rent growth · sell at horizon
- IRR
- 37.9%
- Equity multiple
- 2.55×
- Total profit
- $32,540
- Equity at exit
- $11,183
- IRR
- 43.0%
- Equity multiple
- 4.50×
- Total profit
- $73,573
- Equity at exit
- $6,485
Cash invested: $21,000 (down + closing). Projections, not guarantees.
Landlord ↔ Tenant lean methodology
- Overall (STATE)
- 90 Strongly Landlord-Friendly
- State Mississippi
- 90 Strongly Landlord-Friendly · R+11
- County
- — inherits STATE
- City
- — inherits STATE
ZIP-level market 39056
- Rents YoY
- -3.7%
- Active inventory
- 233
- Price-to-rent
- 3.8×
Monthly cashflow live
- Estimated rent
- $1,639 high interval (Pro) →
- Mortgage (P&I)
- −$393
- Tax est. 1.5%
- −$94 /mo · $1,125/yr
- Insurance
- −$31
- HOA
- −$0
- Vacancy / Maint / Mgmt
- −$344
- Net cashflow
- $777
Break-even live
UW: 25.0% down · 7.5% · 30yr · 1.5% tax · 5.0% vac · 8.0% maint · 8.0% mgmt
Financing live
Cash to close
- Down payment
- $18,750
- Closing costs
- $2,250
- Reserves months
- —
- Total cash needed
- —
Loan-product check · same deal, 3 products live
Conventional
25% down · 7.5% · 30yr
- Down + closing
- —
- Monthly P&I
- —
- Monthly cashflow
- —
- DSCR
- —
- Eligible?
- —
Personal DTI + credit; lowest rate.
DSCR
20% down · 8.5% · 30yr
- Down + closing
- —
- Monthly P&I
- —
- Monthly cashflow
- —
- DSCR
- —
- Eligible?
- —
No personal income docs; deal must DSCR.
Hard money
10% down · 12.0% · 12mo
- Down + closing
- —
- Monthly P&I
- —
- Monthly cashflow
- —
- DSCR
- —
- Eligible?
- —
Short-term bridge; refi at stabilization.
Rent comps 7 comps
| Address | Beds | Baths | Sqft | Rent | $/sqft | DOM | Units | Dist |
|---|---|---|---|---|---|---|---|---|
| 210 McRee Dr Clinton, MS | 3.0 | 2.0 | 1200 | $1,600 | $1.33 | 21d | 1 | 0.53mi |
| 5551 Shaw Rd Jackson, MS | 1.0–3.0 | 1.0–2.0 | 1153 | $1,225 | $1.06 | 14d | 8 | 1.12mi |
| 131 Woodchase Park Dr Clinton, MS | 2.0–3.0 | 2.0 | 1229 | $1,949 | $1.59 | 14d | 7 | 1.31mi |
| 112 E Sproles St Clinton, MS | 2.0 | 1.0 | 1068 | $1,500 | $1.40 | 14d | 1 | 1.41mi |
| 5501 US-80 Jackson, MS | 2.0 | 2.0 | 1089 | $1,073 | $0.99 | 43d | 1 | 1.47mi |
| 5501 US-80 Jackson, MS | 3.0 | 2.0 | 1349 | $1,231 | $0.91 | 14d | 1 | 1.47mi |
| 5501 US-80 Jackson, MS | 3.0 | 2.0 | 1349 | $1,231 | $0.91 | 44d | 1 | 1.47mi |
Listing history 22 events
-
2026-06-18days on market $75,000 Active 80 DOM
-
2026-06-17days on market $75,000 Active 79 DOM
-
2026-06-16days on market $75,000 Active 78 DOM
-
2026-06-15days on market $75,000 Active 77 DOM
-
2026-06-14days on market $75,000 Active 75 DOM
-
2026-06-13days on market $75,000 Active 74 DOM
-
2026-06-10days on market $75,000 Active 72 DOM
-
2026-06-09days on market $75,000 Active 71 DOM
-
2026-06-08days on market $75,000 Active 70 DOM
-
2026-06-07days on market $75,000 Active 69 DOM
-
2026-06-05days on market $75,000 Active 66 DOM
-
2026-06-03days on market $75,000 Active 65 DOM
-
2026-06-02days on market $75,000 Active 64 DOM
-
2026-06-01days on market $75,000 Active 63 DOM
-
2026-05-31days on market $75,000 Active 62 DOM
-
2026-05-30days on market $75,000 Active 61 DOM
-
2026-03-30$90,000 Active 30-char remark
Show marketing remark (30 chars)
Great home need a a little TLC
-
2022-10-23historical
-
2022-08-23price $110,000
-
2022-07-09$115,000 Active
-
2004-11-20historical
-
2001-08-04$43,920
ⓘ Source: listings_history table (triggers on properties + properties_extension) + one-shot
backfill from property_details.listing_events for pre-trigger history.
Climate risk First Street
- Flood 1/10 Low FEMA zone X (unshaded) · 0% chance over 30 yrs
- Wildfire 1/10 Low
- Heat 7/10 Severe 7 d/yr ≥109°F today · 21 d/yr by 30 yrs out
- Wind 8/10 Severe 80% chance of damaging wind over 30 yrs
- Air quality 1/10 Low 0 unhealthy d/yr today · 0 by 30 yrs out
Nearby sold comps map
Loading sold comps map…
Walkable amenities ~0.75 mi
Loading nearby amenities…
Taxation est. · year 1
- Rental income
- $19,672
- − Mortgage interest
- −$4,201
- − Property taxes
- −$1,125
- − Insurance
- −$375
- − Repairs & maintenance
- −$1,574
- − Management
- −$1,574
- − Depreciation
- −$2,182
- Taxable income
- $8,641
- Est. tax owed @ 24.0%
- −$2,074
- After-tax cash flow
- $7,247/yr
For passive investors: Depreciation is non-cash, so a rental often shows a tax loss while cash-flowing — sheltering income. Rental losses are passive: they offset passive income freely, and up to $25,000/yr can offset ordinary (W-2) income if you actively participate and your MAGI is under $100k (phasing out to $0 by $150k); unused losses carry forward. On sale, claimed depreciation is recaptured at up to 25%, and gains may owe capital-gains tax (a 1031 exchange can defer both). Figures are a year-1 estimate at your 24.0% rate — not tax advice; consult a CPA.
Condition & rehab AI · 12 photos
The home requires moderate renovations to update the kitchen and bathrooms, replace flooring, and paint interior walls. These updates will significantly increase its resale and rental value.
Repairs flagged
- Moderate kitchen cabinets — dated and worn
- Moderate kitchen countertops — dated and worn
- Moderate kitchen appliances — dated and worn
- Moderate bathroom fixtures — dated and worn
- Moderate bathroom tile — dated and worn
- Moderate flooring — carpeted and worn
Value-add opportunities
- Both kitchen renovation — modernizing kitchen will appeal to buyers and renters
- Both bathroom renovation — modernizing bathrooms will appeal to buyers and renters
- Both flooring replacement — new flooring will improve appearance and functionality
- Both paint interior walls — fresh paint will improve appearance and appeal
Renovation cost estimate screening
| Repair item | Severity | Est. cost |
|---|---|---|
| kitchen cabinets · dated and worn | Moderate | $3,000–15,000 |
| kitchen countertops · dated and worn | Moderate | $3,000–15,000 |
| kitchen appliances · dated and worn | Moderate | $3,000–15,000 |
| bathroom fixtures · dated and worn | Moderate | $3,000–15,000 |
| bathroom tile · dated and worn | Moderate | $3,000–15,000 |
| flooring · carpeted and worn | Moderate | $3,000–15,000 |
| Total estimated repair cost · 6 items | $18,000–90,000 |
Value-add ROI direction
- Both kitchen renovation — modernizing kitchen will appeal to buyers and renters ↑
- Both bathroom renovation — modernizing bathrooms will appeal to buyers and renters ↑
- Both flooring replacement — new flooring will improve appearance and functionality ↑
- Both paint interior walls — fresh paint will improve appearance and appeal ↑
ⓘ Cost ranges are severity-bucket heuristics (US national rule-of-thumb). Get contractor quotes + a written scope before underwriting a rehab budget.
Schools (NCES district)
- District
- Clinton Public School District
- NCES district ID
- 2801090
- Math proficiency
- 58% ▼ -9.00%
- Reading proficiency
- 53% ▼ -7.00%
- Median HH income
- $55,993
- Composite
- 47.95/100
- National rank
- #2205
- State rank
- #4 of 130 in MS
Livability — Clinton
- Score
- 69/100
- State rank
- #49
- US rank
- #8341
Category grades
Schools grade is shown separately in the Schools card above.
Census & demographics
- Census place
- Clinton, MS
- County
- Hinds County · 167,040 people
- City population
- 26,836
- Metro
- Jackson, MS
- Population (ZIP)
- 26,836
- Household income
- $75,110
- Rent vs Own
- Severe rent burden
- 780.0
Population outlook (Hinds County) Hauer SSP2
- Today (2025)
- 242,528 people
- By 2030
- 241,113 · -0.6%
- By 2040
- 235,557 · -2.9%
- By 2050
- 226,946 · -6.4%
- By 2075
- 199,995 · -17.5%
- By 2100
- 164,165 · -32.3%
Race, ethnicity, and origin ACS 2023
- Neighborhood character
- Diverse neighborhood (Simpson 0.58)
- Race & ethnicity
- White 50% Black 40% Asian 4% Two or more races 3% Hispanic / Latino 2%
- Common ancestry
- Slovak 4% Italian 2% Serbian 1%
- Foreign-born
- 6% · Canada, Vietnam, China
- Languages at home
- 92% English-only · Other Indo-European 2% Spanish 1% Vietnamese 1%
Political lean MEDSL · Hinds
- 2024 margin
- Solid D (+46.1) · D 72.4% · R 26.3% · Other 1.4%
- 2008→2024 swing
- +7.1pp toward D · 2008: 39.0pp · 2024: 46.1pp
- All cycles
- 2024: D+46.1 2020: D+48.3 2016: D+43.7 2012: D+45.1 2008: D+39.0
Not yet ingested
- Civics
- —
Market trends
- HPI YoY
- ▼ -148.13%
- Current HPI
- 176.266
- Rent YoY
- ▼ -3.70%
- Metro
- Jackson, MS
- State GDP YoY
- —
- F500 in state
- 0
Price history
+104.9% since first listed6 events — show timeline
- 2026-03-30 Listed $90,000 MLSU
- 2022-10-23 Listing Removed — MLSU
- 2022-08-23 Price Changed $110,000 MLSU
- 2022-07-09 Listed $115,000 MLSU
- 2004-11-20 Listing Removed — MLSU
- 2001-08-04 Listed $43,920 MLSU
Cash-flow waterfall
monthlySold comps — $/sqft
last 12 mo · ≤1 miLoading sold comps…