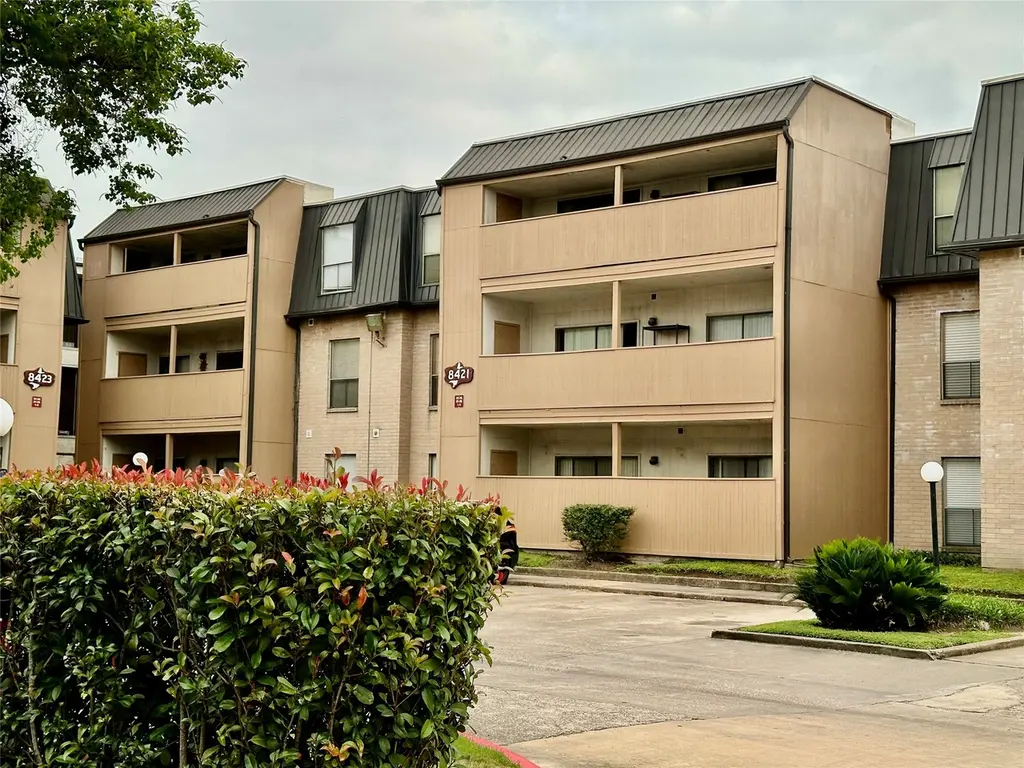
8421 Hearth Dr #24 · Houston, TX
Flood risk 8/10 · Major
- FEMA flood zone
- X (unshaded)
- Chance of flooding over 30 yrs
- 0.99%
- Est. flood insurance / yr
- $507 – $1,088
Fire risk 1/10 · Minimal
- Est. fire insurance / yr
- $1,222 – $2,270
Heat risk 9/10 · Severe
- Hot days now (above 109°F)
- 7 days/yr
- Hot days in 30 yrs
- 25 days/yr
Wind risk 9/10 · Severe
- Chance of severe wind over 30 yrs
- 99.0%
Air-quality risk 2/10 · Minimal
- Unhealthy air days now
- 2 days/yr
- Unhealthy air days in 30 yrs
- 2 days/yr
Risk factors via First Street. Map © Google.
Why this score? — see what drove the B- grade
The composite is a weighted blend of 9 inputs, each scored 0–100. Each bar is that input's sub-score; the figure is the points it added to the 100-point composite (weight × sub-score).
- Cash flow +26.7/30.0
- 1% rule +10.0/10.0
- DSCR +9.1/10.0
- ARV discount +7.5/15.0
- Condition / age +3.8/5.0
- Livability +3.7/5.0
- Appreciation +2.7/10.0
- Schools +2.7/10.0
- Rent growth +1.8/5.0
$72,000
🖨 Deal sheet 📄 Offer letter ✓ Due diligence
Listing remarks
You'll love the stylish laminate flooring throughout this 3-bed, 2-bath second-floor condo in gated Hearthwood. The kitchen comes with newer appliances — Whirlpool range (2024), GE washer (2023), Whirlpool dryer (2022), and a brand-new LG refrigerator (2025). Full-size washer/dryer stay. The A/C was freshly recharged with refrigerant this year, and the air ducts were professionally cleaned earlier this year — perfect for clean, cool comfort in Houston summers. Community pools, tennis court, and on-site security. Easy access to Medical Center & Beltway 8. Communiy no pet. Come see it for yourself!
Key facts
- On-site security
- Easy access
- Community has pools
Tags
Property features AI
Finance
- Financial info: Lease not considered
- HOA & community: Hearth Wood Association with gated access; Monthly association fee of $569; HOA covers common areas, insurance, grounds maintenance, sewer, trash and water; Community pool
Exterior
- Parking: Carport; Detached carport; Additional parking
- Security: Smoke detectors
- Utilities: Public water; Public sewer; Electric service
- Home design: Residential property; Single-story; Built in 1979; Slab foundation; Composition roof
- Construction: Construction materials: Unknown
- Exterior features: Balcony; Exterior storage
Interior
- Kitchen: Dishwasher; Electric oven; Electric range; Free-standing range; Microwave; Oven; Refrigerator; Disposal
- Bedrooms: 3 possible bedrooms
- Flooring: Laminate
- Bathrooms: 2 full bathrooms
- Heating & cooling: Central heating (electric); Central air conditioning (electric)
- Interior features: Soaking tub; Tub with shower; Combined living and dining area; 5 total rooms
- Laundry & utility: Washer; Dryer; Electric dryer hookup
Neighborhood map
What this means for you Summary
Snapshot
- This is a 3-bed/2.0-bath condo listed at $72k. Condition is rated good.
Deal economics
- At list price, monthly cash flow is $128 ($2k/yr) — positive.
- The deal already cash-flows at list — no discount required.
- Meets the 1% rule at list price ($2k rent vs $72k).
- Cap rate 9.5% vs local median 3.2% in Houston — top-decile yield for the area; either an underpriced asset or a hidden risk that comps aren't pricing in. Stress-test before assuming the spread holds.
Location & tenants
- Location reads 74/100 on livability (#184 in TX, #4,771 nationally) — a middle-class / working-renter tenant base. Strengths: amenities A+, cost of living A+, housing A+; Watch: crime F.
- Houston ISD (urban): math 27% / reading 35% proficiency, ranked #593 of 826 in TX (top 72%) — families likely to look elsewhere, expect single-tenant / working-renter base with shorter leases; 71% free/reduced lunch — lower-income household profile, screen leases tightly.
- Zoned schools: Longfellow El (math 12% / reading 27%, grade F, #3,583 of 4,322 statewide, top 86%, 682 students, 75% FRL); Pershing Middle (math 36% / reading 49%, grade D-, #553 of 1,662 statewide, top 34%, 1,390 students, 60% FRL); Bellaire H S (math 45% / reading 62%, grade C-, #428 of 1,632 statewide, top 27%, 3,170 students, 48% FRL).
- Market conditions: Rents soft (-2.8%/yr); 268 active listings in the ZIP; 40 comparable units currently listed for rent nearby; rentals leasing fast (median 12d on market — plan ~1-2 weeks tenant-placement turnaround); 29,883 units permitted in Harris County in 2024 (8,621 in 5+ unit buildings).
- This rent runs 31% of the median local income ($62k/yr) — at the standard rent-burdened threshold; future hikes will face affordability resistance.
Forward outlook
- Local home prices are declining (-3.0%/yr); year-one equity from $498 of loan paydown is wiped out by about $2k of value loss. Plan a longer hold.
- Harris County population projected at +47% by 2050 — long-run rental-demand tailwind backs the buy-and-hold thesis.
Negotiation context
- Only 13 days on market — expect competitive offers; lowballing is unlikely to land.
Risks & watch-outs
- Watch-outs: flood insurance adds $66/mo; HOA is 36% of rent.
- Climate carrying-cost: severe flood risk; severe wind risk, 99% chance of damaging wind over 30y; extreme-heat days projected 7→25/yr by 2055 (HVAC capex compounding) — expect insurance premiums to compound above CPI over the hold.
Questions for the listing agent
- Built in 1979 — when were the roof, HVAC, electrical panel, plumbing, and water heater last replaced?
- What's the actual annual flood-insurance premium (NFIP or private), and is the property in a SFHA with mandatory coverage?
- What does the HOA fee cover, when was the last increase, and are there any pending special assessments or reserve-fund shortfalls?
- Any open or pending special assessments — roof, HVAC, plumbing, elevator, façade? What's the per-unit balance and payoff schedule, and is the seller paying it off at close or rolling it to the buyer?
- Is there a deadline driving the sale (1031 exchange, divorce, estate, relocation)? That informs how much negotiation room exists.
- Schools are D-rated, which usually means shorter tenancies and higher turnover. Who's the typical renter profile here, and what's been the actual vacancy rate?
- Crime grade is F in this area — have there been break-ins, vandalism, or insurance claims at this property in the last 3 years? What carrier currently insures it and at what premium?
- What's the average days-on-market for RENTAL listings here right now (not sales)? A rising rental-DOM trend means longer vacancies and softer asking-rent achievability than the comps imply.
- What's the recent tenant-quality profile in this submarket — average credit score on applications, eviction rate, late-payment / NSF rate, and stable-employment percentage? A property-management company in the area should have these aggregated.
- How much new apartment / multifamily construction is in the pipeline within 1–3 miles? Heavy new supply (>2% of stock underway) typically softens rents 12–24 months out; light construction supports rent growth.
Investment metrics
- 1% rule
- 2.22% ✓
- Cap rate
- 9.53%
- Cash-on-cash
- 11.57%
- DSCR
- 1.51
- GRM
- 3.8
CMA / ARV
No comps found within radius.
Projected returns pro-forma
-3.0% appreciation · 0.0% rent growth · sell at horizon
- IRR
- -11.3%
- Equity multiple
- 0.61×
- Total profit
- $-7,786
- Equity at exit
- $10,735
- IRR
- -15.9%
- Equity multiple
- 0.37×
- Total profit
- $-12,685
- Equity at exit
- $6,225
Cash invested: $20,160 (down + closing). Projections, not guarantees.
Landlord ↔ Tenant lean methodology
- Overall (STATE)
- 87 Strongly Landlord-Friendly
- State Texas
- 87 Strongly Landlord-Friendly · R+5
- County
- — inherits STATE
- City
- — inherits STATE
ZIP-level market 77054
- Home prices YoY
- -2.6%
- Rents YoY
- -2.8%
- Active inventory
- 268
- Price-to-rent
- 3.8×
Monthly cashflow live
- Estimated rent
- $1,596 high interval (Pro) →
- Mortgage (P&I)
- −$378
- Tax est. 1.5%
- −$90 /mo · $1,080/yr
- Insurance
- −$30
- Flood insurance flood zone
- −$66 /mo · $798/yr
- HOA
- −$569
- Vacancy / Maint / Mgmt
- −$335
- Net cashflow
- $128
Break-even live
UW: 25.0% down · 7.5% · 30yr · 1.5% tax · 5.0% vac · 8.0% maint · 8.0% mgmt
Financing live
Cash to close
- Down payment
- $18,000
- Closing costs
- $2,160
- Reserves months
- —
- Total cash needed
- —
Loan-product check · same deal, 3 products live
Conventional
25% down · 7.5% · 30yr
- Down + closing
- —
- Monthly P&I
- —
- Monthly cashflow
- —
- DSCR
- —
- Eligible?
- —
Personal DTI + credit; lowest rate.
DSCR
20% down · 8.5% · 30yr
- Down + closing
- —
- Monthly P&I
- —
- Monthly cashflow
- —
- DSCR
- —
- Eligible?
- —
No personal income docs; deal must DSCR.
Hard money
10% down · 12.0% · 12mo
- Down + closing
- —
- Monthly P&I
- —
- Monthly cashflow
- —
- DSCR
- —
- Eligible?
- —
Short-term bridge; refi at stabilization.
Rent comps 40 comps
| Address | Beds | Baths | Sqft | Rent | $/sqft | DOM | Units | Dist |
|---|---|---|---|---|---|---|---|---|
| 8415 Hearth Dr Unit 1019639P Houston, TX | 3.0 | 2.0 | 1496 | $5,258 | $3.51 | 5d | 1 | 0.01mi |
| 8415 Hearth Dr #25 Houston, TX | 3.0 | 2.0 | 1500 | $3,950 | $2.63 | 43d | 1 | 0.01mi |
| 8521 Hearth Dr Houston, TX | 2.0 | 2.0 | 1092 | $1,195 | $1.09 | 43d | 1 | 0.03mi |
| 2801 S Bartell Dr Houston, TX | 2.0 | 2.0 | 1289 | $1,808 | $1.40 | 11d | 1 | 0.08mi |
| 8435 Hearth Dr Houston, TX | 2.0 | 2.0 | 1040 | $950 | $0.91 | 43d | 1 | 0.08mi |
| 2501 Westridge St Unit 424 Houston, TX | 2.0 | 2.0 | 1005 | $1,239 | $1.23 | 5d | 1 | 0.11mi |
| 2501 Westridge St Unit 422 Houston, TX | 2.0 | 2.0 | 1005 | $1,239 | $1.23 | 7d | 1 | 0.11mi |
| 2501 Westridge St Unit 2558 Houston, TX | 2.0 | 2.0 | 1005 | $1,231 | $1.22 | 2d | 1 | 0.11mi |
| 2501 Westridge St Unit 2047 Houston, TX | 2.0 | 2.0 | 1005 | $1,274 | $1.27 | 10d | 1 | 0.15mi |
| 8800 Lakes at 610 Dr Houston, TX | 2.0 | 2.0 | 951 | $1,280 | $1.35 | 24d | 1 | 0.18mi |
| 2407 Westridge St Houston, TX | 2.0 | 2.0 | 975 | $1,199 | $1.23 | 43d | 1 | 0.20mi |
| 2600 Westridge St Houston, TX | 1.0–2.0 | 1.0–2.0 | 790 | $1,349 | $1.71 | 1d | 73 | 0.20mi |
| 8410 W Bartell Dr Unit 2047 Houston, TX | 2.0 | 2.0 | 892 | $1,069 | $1.20 | 10d | 1 | 0.22mi |
| 8416 W Bartell Dr Houston, TX | 2.0 | 2.0 | 892 | $1,195 | $1.34 | 24d | 1 | 0.24mi |
| 8410 W Bartell Dr Unit 2187 Houston, TX | 2.0 | 2.0 | 892 | $1,026 | $1.15 | 2d | 1 | 0.28mi |
| 8410 W Bartell Dr Unit 422 Houston, TX | 2.0 | 2.0 | 892 | $1,034 | $1.16 | 7d | 1 | 0.28mi |
| 8410 W Bartell Dr Unit 421 Houston, TX | 2.0 | 2.0 | 892 | $1,034 | $1.16 | 5d | 1 | 0.28mi |
| 8900 Lakes at 610 Dr Houston, TX | 1.0–2.0 | 1.0–2.0 | 981 | $1,810 | $1.84 | 43d | 35 | 0.31mi |
| 8900 Lakes at 610 Dr Houston, TX | 1.0–2.0 | 1.0–2.0 | 981 | $1,920 | $1.96 | 1d | 27 | 0.31mi |
| 8877 Lakes At 610 Dr Houston, TX | 1.0–2.0 | 1.0–2.0 | 964 | $1,808 | $1.87 | 2d | 3 | 0.31mi |
| 8877 Lakes At 610 Dr Houston, TX | 1.0–2.0 | 1.0–2.0 | 964 | $1,808 | $1.87 | 11d | 2 | 0.31mi |
| 8877 Lakes At 610 Dr Houston, TX | 1.0–2.0 | 1.0–2.0 | 1005 | $1,808 | $1.80 | 7d | 3 | 0.31mi |
| 8877 Lakes at 610 Dr Unit RAMC4 Houston, TX | 2.0 | 1.0 | 1035 | $1,497 | $1.45 | 43d | 1 | 0.32mi |
| 8877 Lakes at 610 Dr Unit RAMC3 Houston, TX | 2.0 | 2.0 | 1289 | $1,808 | $1.40 | 43d | 1 | 0.32mi |
| 8877 Lakes at 610 Dr Unit RAMC2 Houston, TX | 2.0 | 2.0 | 1122 | $1,595 | $1.42 | 43d | 1 | 0.32mi |
| 8877 Lakes at 610 Dr Unit 8914 Houston, TX | 2.0 | 2.0 | 1035 | $1,569 | $1.52 | 11d | 1 | 0.34mi |
| 8877 Lakes at 610 Dr Unit 425 Houston, TX | 2.0 | 2.0 | 1035 | $1,564 | $1.51 | 7d | 1 | 0.34mi |
| 8877 Lakes at 610 Dr Unit 2174 Houston, TX | 2.0 | 2.0 | 1035 | $1,558 | $1.51 | 10d | 1 | 0.34mi |
| 2686 Murworth Dr Houston, TX | 1.0–2.0 | 1.0–2.0 | 791 | $1,475 | $1.86 | 2d | 12 | 0.35mi |
| 2989 Westridge St Houston, TX | 2.0 | 2.0 | 1108 | $1,639 | $1.48 | 11d | 1 | 0.36mi |
| 2692 Murworth Dr Houston, TX | 2.0 | 2.0 | 1000 | $1,349 | $1.35 | 43d | 1 | 0.38mi |
| 9330 Main St Houston, TX | 1.0–2.0 | 1.0–2.0 | 915 | $2,460 | $2.69 | 1d | 51 | 0.43mi |
| 9955 Buffalo Speedway Houston, TX | 1.0–3.0 | 1.0–2.0 | 874 | $1,949 | $2.23 | 1d | 18 | 0.45mi |
| 9330 S Main St Houston, TX | 1.0–2.0 | 1.0–2.0 | 942 | $2,415 | $2.56 | 14d | 53 | 0.45mi |
| 9426 S Main St Houston, TX | 2.0 | 2.0 | 1264 | $2,040 | $1.61 | 43d | 1 | 0.46mi |
| 2801 Broadmead Dr Unit 1008 Houston, TX | 2.0 | 2.0 | 965 | $1,200 | $1.24 | 43d | 1 | 0.49mi |
| 2701 W Bellfort Blvd Houston, TX | 1.0–2.0 | 1.0–2.0 | 697 | $1,299 | $1.86 | 1d | 13 | 0.51mi |
| 2801 Broadmead Dr Houston, TX | 2.0 | 2.0 | 965 | $1,480 | $1.53 | 43d | 1 | 0.51mi |
| 3000 Murworth Dr Houston, TX | 1.0–2.0 | 1.0–2.0 | 865 | $1,299 | $1.50 | 2d | 34 | 0.52mi |
| 3006 Murworth Dr Houston, TX | 2.0 | 2.0 | 1052 | $1,253 | $1.19 | 43d | 1 | 0.60mi |
HOA detail condo
- Monthly dues
- $569 · $6,828/yr
- Likely covers
- poolsecurity
- Assessments
- None detected in remarks — confirm with the listing agent.
Listing history 2 events
-
2026-05-16status Pending 622-char remark
-
2026-05-06$72,000 Active 622-char remark
ⓘ Source: listings_history table (triggers on properties + properties_extension) + one-shot
backfill from property_details.listing_events for pre-trigger history.
Climate risk First Street
- Flood 8/10 Severe FEMA zone X (unshaded) · 99% chance over 30 yrs
- Wildfire 1/10 Low
- Heat 9/10 Extreme 7 d/yr ≥109°F today · 25 d/yr by 30 yrs out
- Wind 9/10 Extreme 99% chance of damaging wind over 30 yrs
- Air quality 2/10 Low 2 unhealthy d/yr today · 2 by 30 yrs out
Nearby sold comps map
Loading sold comps map…
Walkable amenities ~0.75 mi
Loading nearby amenities…
Taxation est. · year 1
- Rental income
- $19,153
- − Mortgage interest
- −$4,033
- − Property taxes
- −$1,080
- − Insurance
- −$1,158
- − Repairs & maintenance
- −$1,532
- − Management
- −$1,532
- − HOA
- −$6,828
- − Depreciation
- −$2,095
- Taxable income
- $895
- Est. tax owed @ 24.0%
- −$215
- After-tax cash flow
- $1,320/yr
For passive investors: Depreciation is non-cash, so a rental often shows a tax loss while cash-flowing — sheltering income. Rental losses are passive: they offset passive income freely, and up to $25,000/yr can offset ordinary (W-2) income if you actively participate and your MAGI is under $100k (phasing out to $0 by $150k); unused losses carry forward. On sale, claimed depreciation is recaptured at up to 25%, and gains may owe capital-gains tax (a 1031 exchange can defer both). Figures are a year-1 estimate at your 24.0% rate — not tax advice; consult a CPA.
Condition & rehab AI · 7 photos
This 3-bedroom, 2-bath townhouse is in good condition with recent updates and maintenance. It offers a good return on investment with potential for further value increases through cosmetic upgrades.
Value-add opportunities
- Both Paint interior walls — Fresh paint enhances curb appeal and interior aesthetics.
- Both Replace countertops — Modern countertops can increase both resale and rental value.
- Both Install new flooring — New flooring can significantly boost both resale and rental value.
- Both Upgrade appliances — Upgrading to more modern and energy-efficient appliances can increase both resale and rental value.
Renovation cost estimate screening
Value-add ROI direction
- Both Paint interior walls — Fresh paint enhances curb appeal and interior aesthetics. ↑
- Both Replace countertops — Modern countertops can increase both resale and rental value. ↑
- Both Install new flooring — New flooring can significantly boost both resale and rental value. ↑
- Both Upgrade appliances — Upgrading to more modern and energy-efficient appliances can increase both resale and rental value. ↑
ⓘ Cost ranges are severity-bucket heuristics (US national rule-of-thumb). Get contractor quotes + a written scope before underwriting a rehab budget.
Schools (NCES district)
- District
- Houston ISD
- NCES district ID
- 4823640
- Math proficiency
- 27% ▼ -18.00%
- Reading proficiency
- 35% ▼ -6.00%
- Median HH income
- $46,054
- Composite
- 26.63/100
- National rank
- #7173
- State rank
- #593 of 826 in TX
Livability — Houston
- Score
- 74/100
- State rank
- #184
- US rank
- #4771
Category grades
Schools grade is shown separately in the Schools card above.
Census & demographics
- Census place
- Houston, TX
- County
- Harris County · 4,702,590 people
- City population
- 3,226,434
- Metro
- Houston-The Woodlands-Sugar Land, TX
- Population (ZIP)
- 28,272
- Household income
- $62,106
- Rent vs Own
- Severe rent burden
- 2814.0
Population outlook (Harris County) Hauer SSP2
- Today (2025)
- 5,571,493 people
- By 2030
- 6,089,821 · +9.3%
- By 2040
- 7,142,806 · +28.2%
- By 2050
- 8,185,864 · +46.9%
- By 2075
- 10,574,329 · +89.8%
- By 2100
- 12,109,958 · +117.4%
Race, ethnicity, and origin ACS 2023
- Neighborhood character
- Highly diverse neighborhood (Simpson 0.72)
- Race & ethnicity
- Black 41% Asian 22% White 20% Hispanic / Latino 14% Two or more races 10%
- Hispanic origin (detail)
- Mexican 7%
- Common ancestry
- Slovak 2% Romanian 1% Italian 1%
- Foreign-born
- 29% · China, Canada, Jamaica
- Languages at home
- 67% English-only · Spanish 9% Chinese 7% Other Indo-European 5%
Political lean MEDSL · Harris
- 2024 margin
- Lean D (+5.5) · D 52.0% · R 46.4% · Other 1.6%
- 2008→2024 swing
- +3.9pp toward D · 2008: 1.6pp · 2024: 5.5pp
- All cycles
- 2024: D+5.5 2020: D+13.3 2016: D+12.4 2012: D+0.1 2008: D+1.6
Not yet ingested
- Civics
- —
Market trends
- HPI YoY
- ▼ -4.51%
- Current HPI
- 170.4017
- Rent YoY
- ▼ -2.82%
- Metro
- Houston-The Woodlands-Sugar Land, TX
- State GDP YoY
- ▲ 3.95%
- F500 in state
- 110
Industry mix (Fortune 500 HQ in TX)
| Industry | F500 HQs | Revenue |
|---|---|---|
| Energy | 16 | $1,198B |
|
||
| Technology | 5 | $198B |
|
||
| Engineering / Construction | 4 | $72B |
|
||
| Energy Services | 3 | $60B |
|
||
| Utilities | 3 | $41B |
|
||
| Healthcare | 2 | $330B |
|
||
Price history
4 events — show timeline
- 2026-05-29 Sold (MLS) — HARMLS
- 2026-05-19 Pending — HARMLS
- 2026-05-16 Pending — HARMLS
- 2026-05-06 Listed $72,000 HARMLS
Cash-flow waterfall
monthlySold comps — $/sqft
last 12 mo · ≤1 miLoading sold comps…