 10-Plex
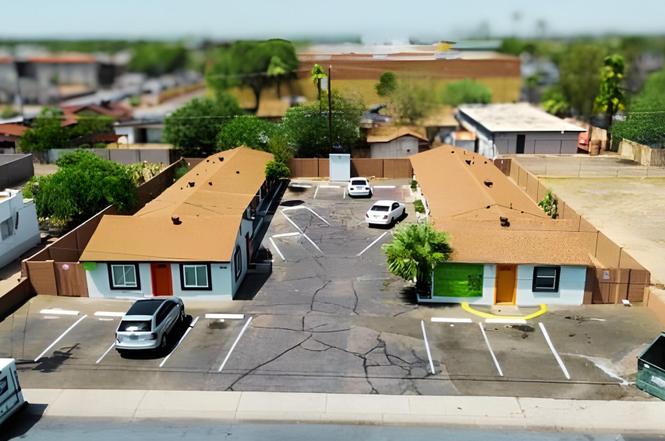
8910-8912 N 3rd St · Phoenix, AZ
Flood risk 1/10 · Minimal
- FEMA flood zone
- X (shaded)
- Chance of flooding over 30 yrs
- 0.0%
- Est. flood insurance / yr
- $507 – $1,088
Fire risk 3/10 · Minor
- Est. fire insurance / yr
- $610 – $1,132
Heat risk 9/10 · Severe
- Hot days now (above 112°F)
- 7 days/yr
- Hot days in 30 yrs
- 19 days/yr
Wind risk 1/10 · Minimal
- Chance of severe wind over 30 yrs
- —
Air-quality risk 3/10 · Minor
- Unhealthy air days now
- 3 days/yr
- Unhealthy air days in 30 yrs
- 4 days/yr
Risk factors via First Street. Map © Google.
Why this score? — see what drove the C- grade
The composite is a weighted blend of 9 inputs, each scored 0–100. Each bar is that input's sub-score; the figure is the points it added to the 100-point composite (weight × sub-score).
- Cash flow +21.9/30.0
- ARV discount +7.5/15.0
- DSCR +7.0/10.0
- 1% rule +5.8/10.0
- Livability +3.8/5.0
- Condition / age +2.5/5.0
- Schools +2.3/10.0
- Rent growth +2.1/5.0
- Appreciation +0.0/10.0
$1,500,000
🖨 Deal sheet (PDF) 📄 Offer letter ✓ Due diligence
Multi-family units
County records classify this as Multi-Family (5+ Unit). Listing-text estimate: 10 units. confirmed
5+ unit building — per-unit beds/baths from public records are typically unavailable; the breakdown below (if shown) is an estimate from the listing text.
Listing remarks MLS
5 unit property in great location. Great opportunity to add value. All month to month leases. Cash flowing property with lots of potential in a great location. Property for sale as a 5 unit or as a 10 unit including property adjacent. Do not disturb tenants.
Key facts
- 0.29 acre lot
- 10 parking spots
- Built 1945
Property features AI
Finance
- Financial info: Unit rents shown (example unit listed at $1,195)
- HOA & community: No community pool
Exterior
- Parking: Paved parking; About 10 open parking spaces (more than 1 space per unit)
- Utilities: City water (City Franchise); Public sewer; APS electric service
- Home design: Fee simple ownership; One building on the property
- Construction: Brick veneer and block construction; Composition roof
- Exterior features: Brick veneer and painted block exterior; Composition roof; Asphalt road access; Lot approximately 100 x 125; Additional parcels included
Interior
- Kitchen: Appliances listed in remarks
- Bedrooms: Units with 2 bedrooms
- Flooring: Vinyl flooring; Concrete flooring
- Bathrooms: Units with 1 bathroom
- Heating & cooling: Central air; Ceiling fans; Window/wall units; Electric and natural gas heating
- Interior features: Vinyl and concrete flooring; See remarks for included appliances
- Laundry & utility: Individual electric meters
Neighborhood map
What this means for you Summary
Snapshot
- This is a 10 × 10-bed/10.0-bath units multifamily listed at $1.50M.
Deal economics
- At list price, monthly cash flow is $2k ($28k/yr) — positive. Per door: $237/mo.
- The deal already cash-flows at list — no discount required.
- Meets the 1% rule at list price ($16k rent vs $1.50M).
- Recommended offer: $1.32M (12.0% below list) — sets the bar for market timing.
- Cap rate 8.2% vs local median 3.3% in Phoenix — top-decile yield for the area; either an underpriced asset or a hidden risk that comps aren't pricing in. Stress-test before assuming the spread holds.
Location & tenants
- Location reads 75/100 on livability (#16 in AZ, #3,924 nationally) — a middle-class / working-renter tenant base. Strengths: amenities A+, commute A+, housing A+; Watch: health & safety C-, crime F.
- Glendale Union High School District (4285) (urban): math 23% / reading 31% proficiency, ranked #130 of 249 in AZ (top 52%) — low school quality limits family demand, transient renter base, plan for 1-2y turnover.
- Zoned schools: Sunnyslope High School (math 32% / reading 41%, grade F, #88 of 381 statewide, top 24%, 2,281 students, 41% FRL).
- Market conditions: Rents soft (-1.8%/yr); 288 active listings in the ZIP; solid renter incomes; 36,011 units permitted in Maricopa County in 2024 (12,801 in 5+ unit buildings).
- At $16,126/mo this rent would consume 231% of the median local household income ($84k/yr) (locally 2104% of renters already pay >50% of income on rent) — very limited rent-growth headroom before tenants either downsize or default.
Forward outlook
- Local home prices are declining (-3.0%/yr); year-one equity from $10k of loan paydown is wiped out by about $45k of value loss. Plan a longer hold.
- Maricopa County population projected at +38% by 2050 — long-run rental-demand tailwind backs the buy-and-hold thesis.
Negotiation context
- It's been on market 204 days — a 12% lower offer ($1.32M) is reasonable based on typical stale-listing flexibility.
- 8 sale attempts since 22y ago; this cycle's ask has dropped $390k (21%) from the opening price — seller is motivated, your offer sets the floor, not the list.
- Current owner paid $632k; list at $1.50M implies a 137% gain — meaningful room to come down on a strong offer.
Risks & watch-outs
- Watch-outs: built in 1945 — expect roof / HVAC / electrical / plumbing capex.
- Climate carrying-cost: extreme-heat days projected 7→19/yr by 2055 (HVAC capex compounding) — expect insurance premiums to compound above CPI over the hold.
Questions for the listing agent
- It's been on market 204 days. Have you received any prior offers? Is the seller open to a 12% concession, seller financing, or rate buy-down credit?
- Can we see the unit-by-unit rent roll, current vacancy, and any below-market leases? What's the average tenancy length?
- What capital expenditures (roof, boiler, parking lot, exteriors) have been made in the last 5 years, and what's planned in the next 2?
- Built in 1945 — when were the roof, HVAC, electrical panel, plumbing, and water heater last replaced?
- Why hasn't it sold? Are there any deal-killer items the seller is aware of (foundation, flood, title, zoning, code violations)?
- Is there a deadline driving the sale (1031 exchange, divorce, estate, relocation)? That informs how much negotiation room exists.
- Crime grade is F in this area — have there been break-ins, vandalism, or insurance claims at this property in the last 3 years? What carrier currently insures it and at what premium?
- What's the average days-on-market for RENTAL listings here right now (not sales)? A rising rental-DOM trend means longer vacancies and softer asking-rent achievability than the comps imply.
- What's the recent tenant-quality profile in this submarket — average credit score on applications, eviction rate, late-payment / NSF rate, and stable-employment percentage? A property-management company in the area should have these aggregated.
- How much new apartment / multifamily construction is in the pipeline within 1–3 miles? Heavy new supply (>2% of stock underway) typically softens rents 12–24 months out; light construction supports rent growth.
Investment metrics
- 1% rule
- 1.08% ✓
- Cap rate
- 8.19%
- Cash-on-cash
- 6.78%
- DSCR
- 1.30
- GRM
- 7.8
CMA / ARV
No comps found within radius.
Projected returns pro-forma
-3.0% appreciation · 0.0% rent growth · sell at horizon
- IRR
- -9.3%
- Equity multiple
- 0.67×
- Total profit
- $-138,918
- Equity at exit
- $223,655
- IRR
- -4.5%
- Equity multiple
- 0.74×
- Total profit
- $-107,972
- Equity at exit
- $129,693
Cash invested: $420,000 (down + closing). Projections, not guarantees.
Landlord ↔ Tenant lean methodology
- Overall (STATE)
- 87 Strongly Landlord-Friendly
- State Arizona
- 87 Strongly Landlord-Friendly · R+3
- County
- — inherits STATE
- City
- — inherits STATE
ZIP-level market 85020
- Rents YoY
- -1.8%
- Active inventory
- 288
- Price-to-rent
- 77.5×
Monthly cashflow live
- Estimated rent
- $16,126 medium interval (Pro) →
- Mortgage (P&I)
- −$7,866
- Tax est. 1.5%
- −$1,875 /mo · $22,500/yr
- Insurance
- −$625
- HOA
- −$0
- Vacancy / Maint / Mgmt
- −$3,386
- Net cashflow
- $2,373
Break-even live
Sensitivity live
| Price | -10% $3,410 | -5% $2,892 | +0% $2,373 | +5% $1,855 | +10% $1,337 |
|---|---|---|---|---|---|
| Rent | -10% $1,099 | -5% $1,736 | +0% $2,373 | +5% $3,010 | +10% $3,647 |
| Rate | -1.0pp $3,129 | -0.5pp $2,755 | base $2,373 | +0.5pp $1,985 | +1.0pp $1,589 |
10-unit breakdown (identical units grouped — click to expand)
| Units | Beds | Baths | Est. rent |
|---|---|---|---|
| 10× units | 10 | 10 | $16,130 |
| #1 | 10 | 10 | $1,613 |
| #2 | 10 | 10 | $1,613 |
| #3 | 10 | 10 | $1,613 |
| #4 | 10 | 10 | $1,613 |
| #5 | 10 | 10 | $1,613 |
| #6 | 10 | 10 | $1,613 |
| #7 | 10 | 10 | $1,613 |
| #8 | 10 | 10 | $1,613 |
| #9 | 10 | 10 | $1,613 |
| #10 | 10 | 10 | $1,613 |
| Total (10 units) | $16,126 | ||
UW: 25.0% down · 7.5% · 30yr · 1.5% tax · 5.0% vac · 8.0% maint · 8.0% mgmt
Financing live
Cash to close
- Down payment
- $375,000
- Closing costs
- $45,000
- Reserves months
- —
- Total cash needed
- —
Loan-product check · same deal, 3 products live
Conventional
25% down · 7.5% · 30yr
- Down + closing
- —
- Monthly P&I
- —
- Monthly cashflow
- —
- DSCR
- —
- Eligible?
- —
Personal DTI + credit; lowest rate.
DSCR
20% down · 8.5% · 30yr
- Down + closing
- —
- Monthly P&I
- —
- Monthly cashflow
- —
- DSCR
- —
- Eligible?
- —
No personal income docs; deal must DSCR.
Hard money
10% down · 12.0% · 12mo
- Down + closing
- —
- Monthly P&I
- —
- Monthly cashflow
- —
- DSCR
- —
- Eligible?
- —
Short-term bridge; refi at stabilization.
Listing history 42 events
-
2026-06-18days on market $1,500,000 Active 204 DOM
-
2026-06-17days on market $1,500,000 Active 203 DOM
-
2026-06-16days on market $1,500,000 Active 202 DOM
-
2026-06-15days on market $1,500,000 Active 201 DOM
-
2026-06-13days on market $1,500,000 Active 199 DOM
-
2026-06-09days on market $1,500,000 Active 195 DOM
-
2026-06-08days on market $1,500,000 Active 194 DOM
-
2026-06-07days on market $1,500,000 Active 193 DOM
-
2026-06-04days on market $1,500,000 Active 190 DOM
-
2026-06-03days on market $1,500,000 Active 189 DOM
-
2026-06-02days on market $1,500,000 Active 188 DOM
-
2026-06-01days on market $1,500,000 Active 187 DOM
-
2026-05-31days on market $1,500,000 Active 186 DOM
-
2026-04-21price $1,600,000
-
2026-03-06price $1,750,000
-
2025-11-26$1,890,000 Active
-
2024-01-26soldstatus $632,500 Closed 258-char remark
Show marketing remark (258 chars)
5 unit property in great location. Great opportunity to add value. All month to month leases. Cash flowing property with lots of potential in a great location. Property for sale as a 5 unit or as a 10 unit including property adjacent. Do not disturb tenants.
-
2024-01-26soldstatus $1,265,000
Show marketing remark (258 chars)
5 unit property in great location. Great opportunity to add value. All month to month leases. Cash flowing property with lots of potential in a great location. Property for sale as a 5 unit or as a 10 unit including property adjacent. Do not disturb tenants.
-
2024-01-06historical Under Contract Accepting Backups 258-char remark
Show marketing remark (258 chars)
5 unit property in great location. Great opportunity to add value. All month to month leases. Cash flowing property with lots of potential in a great location. Property for sale as a 5 unit or as a 10 unit including property adjacent. Do not disturb tenants.
-
2023-12-14$700,000 Active 258-char remark
Show marketing remark (258 chars)
5 unit property in great location. Great opportunity to add value. All month to month leases. Cash flowing property with lots of potential in a great location. Property for sale as a 5 unit or as a 10 unit including property adjacent. Do not disturb tenants.
-
2017-01-09soldstatus $143,000
-
2015-03-20historical
-
2014-10-20$130,000 Active
-
2014-08-21historical
-
2014-06-02$130,000 Active
-
2014-05-05historical
-
2013-11-05$130,000 Active
-
2004-09-30soldstatus $190,000
-
2004-09-16soldstatus $190,000
-
2004-06-17historical
-
2004-06-10$190,000
-
2004-04-30soldstatus $175,000
-
2004-03-12historical
-
2004-03-09$175,000
-
2004-01-29historical
-
2004-01-01$175,000
-
2002-05-14soldstatus $275,000
-
2001-02-16soldstatus $150,000
-
2001-02-16soldstatus $165,000
-
1990-04-20soldstatus $80,000
-
1990-04-20soldstatus $80,000
-
1988-03-09soldstatus $140,000
ⓘ Source: listings_history table (triggers on properties + properties_extension) + one-shot
backfill from property_details.listing_events for pre-trigger history.
Climate risk First Street
- Flood 1/10 Low FEMA zone X (shaded) · 0% chance over 30 yrs
- Wildfire 3/10 Moderate
- Heat 9/10 Extreme 7 d/yr ≥112°F today · 19 d/yr by 30 yrs out
- Wind 1/10 Low
- Air quality 3/10 Moderate 3 unhealthy d/yr today · 4 by 30 yrs out
Nearby sold comps map
Loading sold comps map…
Walkable amenities ~0.75 mi
Loading nearby amenities…
Taxation est. · year 1
- Rental income
- $193,512
- − Mortgage interest
- −$84,023
- − Property taxes
- −$22,500
- − Insurance
- −$7,500
- − Repairs & maintenance
- −$15,481
- − Management
- −$15,481
- − Depreciation
- −$43,636
- Taxable income
- $4,890
- Est. tax owed @ 24.0%
- −$1,174
- After-tax cash flow
- $27,307/yr
For passive investors: Depreciation is non-cash, so a rental often shows a tax loss while cash-flowing — sheltering income. Rental losses are passive: they offset passive income freely, and up to $25,000/yr can offset ordinary (W-2) income if you actively participate and your MAGI is under $100k (phasing out to $0 by $150k); unused losses carry forward. On sale, claimed depreciation is recaptured at up to 25%, and gains may owe capital-gains tax (a 1031 exchange can defer both). Figures are a year-1 estimate at your 24.0% rate — not tax advice; consult a CPA.
Schools (NCES district)
- District
- Glendale Union High School District (4285)
- NCES district ID
- 0403450
- Math proficiency
- 23% ▼ -38.00%
- Reading proficiency
- 31% ▼ -19.00%
- Median HH income
- $40,846
- Composite
- 22.81/100
- National rank
- #8020
- State rank
- #130 of 249 in AZ
Livability — Phoenix
- Score
- 75/100
- State rank
- #16
- US rank
- #3924
Category grades
Schools grade is shown separately in the Schools card above.
Census & demographics
- Census place
- Phoenix, AZ
- County
- Maricopa County · 4,537,380 people
- City population
- 1,500,198
- Metro
- Phoenix-Mesa-Chandler, AZ
- Population (ZIP)
- 34,916
- Household income
- $83,735
- Rent vs Own
- Severe rent burden
- 2104.0
Population outlook (Maricopa County) Hauer SSP2
- Today (2025)
- 4,979,203 people
- By 2030
- 5,378,229 · +8.0%
- By 2040
- 6,156,598 · +23.6%
- By 2050
- 6,872,376 · +38.0%
- By 2075
- 8,401,270 · +68.7%
- By 2100
- 9,247,439 · +85.7%
Race, ethnicity, and origin ACS 2023
- Neighborhood character
- Diverse neighborhood (Simpson 0.57)
- Race & ethnicity
- White 60% Hispanic / Latino 26% Two or more races 12% Native American 5% Black 3% Asian 3%
- Hispanic origin (detail)
- Mexican 23%
- Common ancestry
- Romanian 4% Slovak 2% Portuguese 2%
- Foreign-born
- 13% · Canada, Guatemala, China
- Languages at home
- 79% English-only · Spanish 17% Other Indo-European 1% German/W. Germanic 1%
Political lean MEDSL · Maricopa
- 2024 margin
- Toss-up / Even · D 47.7% · R 51.2% · Other 1.1%
- 2008→2024 swing
- +7.1pp toward D · 2008: -10.6pp · 2024: -3.5pp
- All cycles
- 2024: R+3.5 2020: D+2.2 2016: R+3.5 2012: R+12.0 2008: R+10.6
Not yet ingested
- Civics
- —
Market trends
- HPI YoY
- ▼ -484.20%
- Current HPI
- 305.8855
- Rent YoY
- ▼ -1.77%
- Metro
- Phoenix-Mesa-Chandler, AZ
- State GDP YoY
- ▲ 4.54%
- F500 in state
- 20
Industry mix (Fortune 500 HQ in AZ)
| Industry | F500 HQs | Revenue |
|---|---|---|
| Technology | 2 | $13B |
|
||
| Mining / Metals | 1 | $23B |
|
||
| Environmental Services | 1 | $16B |
|
||
| Metals / Steel | 1 | $14B |
|
||
| Technology Distribution | 1 | $9B |
|
||
| Homebuilding | 1 | $8B |
|
||
Price history
+1042.9% since first listed29 events — show timeline
- 2026-04-21 Price Changed $1,600,000 ARMLS
- 2026-03-06 Price Changed $1,750,000 ARMLS
- 2025-11-26 Listed $1,890,000 ARMLS
- 2024-01-26 Sold (Public Records) $1,265,000 Public Records
- 2024-01-26 Sold (MLS) $632,500 ARMLS
- 2024-01-06 Contingent — ARMLS
- 2023-12-14 Listed $700,000 ARMLS
- 2017-01-09 Sold (Public Records) $143,000 Public Records
- 2015-03-20 Listing Removed — ARMLS
- 2014-10-20 Listed $130,000 ARMLS
- 2014-08-21 Listing Removed — ARMLS
- 2014-06-02 Listed $130,000 ARMLS
- 2014-05-05 Listing Removed — ARMLS
- 2013-11-05 Listed $130,000 ARMLS
- 2004-09-30 Sold (MLS) $190,000 ARMLS
- 2004-09-16 Sold (Public Records) $190,000 Public Records
- 2004-06-17 Listing Removed — ARMLS
- 2004-06-10 Listed $190,000 ARMLS
- 2004-04-30 Sold (MLS) $175,000 ARMLS
- 2004-03-12 Listing Removed — ARMLS
- 2004-03-09 Listed $175,000 ARMLS
- 2004-01-29 Listing Removed — ARMLS
- 2004-01-01 Listed $175,000 ARMLS
- 2002-05-14 Sold (Public Records) $275,000 Public Records
- 2001-02-16 Sold (Public Records) $165,000 Public Records
- 2001-02-16 Sold (Public Records) $150,000 Public Records
- 1990-04-20 Sold (Public Records) $80,000 Public Records
- 1990-04-20 Sold (Public Records) $80,000 Public Records
- 1988-03-09 Sold (Public Records) $140,000 Public Records
Property tax history
-2.8%/yrLatest (2025): $1,445 · +3.9% YoY. Source: county tax records.
Cash-flow waterfall
monthlySold comps — $/sqft
last 12 mo · ≤1 miLoading sold comps…