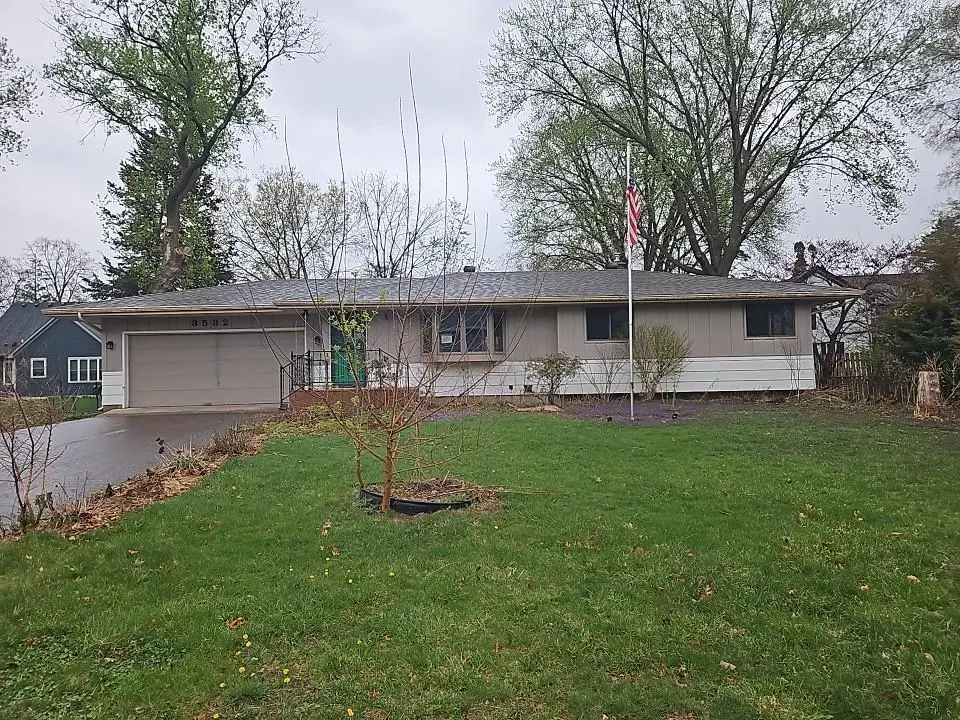
3532 Jerry St · White Bear Lake, MN
Flood risk 1/10 · Minimal
- FEMA flood zone
- X (unshaded)
- Chance of flooding over 30 yrs
- 0.0%
- Est. flood insurance / yr
- $473 – $860
Fire risk 1/10 · Minimal
- Est. fire insurance / yr
- $888 – $1,650
Heat risk 2/10 · Minimal
- Hot days now (above 99°F)
- 7 days/yr
- Hot days in 30 yrs
- 14 days/yr
Wind risk 2/10 · Minimal
- Chance of severe wind over 30 yrs
- —
Air-quality risk 3/10 · Minor
- Unhealthy air days now
- 2 days/yr
- Unhealthy air days in 30 yrs
- 2 days/yr
Risk factors via First Street. Map © Google.
Why this score? — see what drove the D+ grade
The composite is a weighted blend of 9 inputs, each scored 0–100. Each bar is that input's sub-score; the figure is the points it added to the 100-point composite (weight × sub-score).
- ARV discount +14.6/15.0
- Cash flow +12.1/30.0
- Schools +4.6/10.0
- Livability +3.9/5.0
- 1% rule +3.8/10.0
- DSCR +3.6/10.0
- Rent growth +3.2/5.0
- Condition / age +2.5/5.0
- Appreciation +0.0/10.0
$277,500
🖨 Deal sheet 📄 Offer letter ✓ Due diligence
Listing remarks MLS
This White Bear Lake one-story home offers a patio, and a two-car garage. This home has been virtually staged to illustrate its potential.
Key facts
- Close to schools
- Attached garage
- Large living room
Tags
Property features AI
Exterior
- Parking: Attached garage; 2 garage spaces; Asphalt driveway
- Utilities: City water (connected); City sewer (connected); Natural gas; Electric service with circuit breakers
- Home design: Residential property; One level; Above- and below-grade finished living space
- Construction: Block and frame construction; Asphalt pitched roof; Foundation: Other
- Exterior features: Deck; Wood exterior; Storage shed; Irregular lot; Publicly maintained road
Interior
- Kitchen: Cooktop; Wall oven; Dishwasher; Refrigerator
- Bedrooms: 3 bedrooms (all on the main level)
- Bathrooms: 1 full bath on the main level; 1 three-quarter bath in the basement
- Heating & cooling: Forced air heating; Central air conditioning
- Interior features: Finished basement; Kitchen and dining combined
- Laundry & utility: Washer hookup; Dryer; Laundry sink (lower level)
Neighborhood map
What this means for you Summary
Snapshot
- This is a 3-bed/2.0-bath single-family listed at $278k.
Deal economics
- At list price, monthly cash flow is $-59 ($-704/yr) — negative.
- To cash-flow at today's rent, offer at most $267k (3.7% below list).
- To meet the 1% rule (rent ≥ 1% of price), the offer needs to be $243k (12.3% below list).
- Recommended offer: $243k (12.3% below list) — sets the bar for 1% rule.
- Cap rate 6.0% vs local median 3.6% in White Bear Lake — top-decile yield for the area; either an underpriced asset or a hidden risk that comps aren't pricing in. Stress-test before assuming the spread holds.
Location & tenants
- Location reads 77/100 on livability (#124 in MN, #2,842 nationally) — a middle-class / working-renter tenant base. Strengths: crime A+, commute A+, housing A+; Watch: amenities F, health & safety F.
- White Bear Lake School District (suburban): math 45% / reading 57% proficiency, ranked #83 of 301 in MN (top 28%) — acceptable for families but not a draw, mixed tenant base, ~2y average lease.
- Market conditions: Rents rising (+2.8%/yr); 182 active listings in the ZIP; 5 comparable units currently listed for rent nearby; rentals leasing fast (median 2d on market — plan ~1-2 weeks tenant-placement turnaround); solid renter incomes; 1,202 units permitted in Ramsey County in 2024 (880 in 5+ unit buildings).
Forward outlook
- Local home prices are declining (-3.0%/yr); year-one equity from $2k of loan paydown is wiped out by about $8k of value loss. Plan a longer hold.
- Ramsey County population projected at +27% by 2050 — long-run rental-demand tailwind backs the buy-and-hold thesis.
Negotiation context
- It's been on market 15 days — a 2% lower offer ($273k) is reasonable based on typical stale-listing flexibility.
- 4 sale attempts since 4y ago with the ask held roughly flat each time — persistent listings suggest the price (not the market) is what's stuck; bring a comps-based counter.
Questions for the listing agent
- What do current leases actually rent for vs. the listed asking? Can we see a recent rent roll and the last 12 months of T-12 income?
- Built in 1968 — when were the roof, HVAC, electrical panel, plumbing, and water heater last replaced?
- Is there a deadline driving the sale (1031 exchange, divorce, estate, relocation)? That informs how much negotiation room exists.
- Schools are B-rated — typically a magnet for longer-tenancy family renters. What's the average tenant stay here, and is there a school-zone premium baked into asking?
- The area grade is low — what's the realistic commute time and amenity access for the typical tenant pool here? Any planned neighborhood developments (good or bad) we should know about?
- What's the average days-on-market for RENTAL listings here right now (not sales)? A rising rental-DOM trend means longer vacancies and softer asking-rent achievability than the comps imply.
- What's the recent tenant-quality profile in this submarket — average credit score on applications, eviction rate, late-payment / NSF rate, and stable-employment percentage? A property-management company in the area should have these aggregated.
- How much new for-sale + rental construction is in the pipeline within 1–3 miles? Heavy new supply typically softens prices + rents 12–24 months out; constrained supply supports both.
Investment metrics
- 1% rule
- 0.88% ✗
- Cap rate
- 6.04%
- Cash-on-cash
- -0.91%
- DSCR
- 0.96
- GRM
- 9.5
CMA / ARV
- ARV (median comp)
- $329,184
- List price
- $277,500
- Delta
- -15.70%
- Verdict
- UNDERPRICED
- Comps
- 4 within 1.0 mi
Projected returns pro-forma
-3.0% appreciation · 2.82% rent growth · sell at horizon
- IRR
- -18.0%
- Equity multiple
- 0.37×
- Total profit
- $-49,066
- Equity at exit
- $41,376
- IRR
- -10.5%
- Equity multiple
- 0.37×
- Total profit
- $-49,025
- Equity at exit
- $23,993
Cash invested: $77,700 (down + closing). Projections, not guarantees.
Landlord ↔ Tenant lean methodology
- Overall (STATE)
- 46 Balanced
- State Minnesota
- 46 Balanced · D+2
- County
- — inherits STATE
- City
- — inherits STATE
ZIP-level market 55110
- Rents YoY
- 2.8%
- Active inventory
- 182
- Price-to-rent
- 9.5×
Monthly cashflow live
- Estimated rent
- $2,434 high interval (Pro) →
- Mortgage (P&I)
- −$1,455
- Tax from tax record
- −$411 /mo · $4,932/yr
- Insurance
- −$116
- HOA
- −$0
- Vacancy / Maint / Mgmt
- −$511
- Net cashflow
- $-59
Break-even live
UW: 25.0% down · 7.5% · 30yr · 1.5% tax · 5.0% vac · 8.0% maint · 8.0% mgmt
Financing live
Cash to close
- Down payment
- $69,375
- Closing costs
- $8,325
- Reserves months
- —
- Total cash needed
- —
Loan-product check · same deal, 3 products live
Conventional
25% down · 7.5% · 30yr
- Down + closing
- —
- Monthly P&I
- —
- Monthly cashflow
- —
- DSCR
- —
- Eligible?
- —
Personal DTI + credit; lowest rate.
DSCR
20% down · 8.5% · 30yr
- Down + closing
- —
- Monthly P&I
- —
- Monthly cashflow
- —
- DSCR
- —
- Eligible?
- —
No personal income docs; deal must DSCR.
Hard money
10% down · 12.0% · 12mo
- Down + closing
- —
- Monthly P&I
- —
- Monthly cashflow
- —
- DSCR
- —
- Eligible?
- —
Short-term bridge; refi at stabilization.
Rent comps 5 comps
| Address | Beds | Baths | Sqft | Rent | $/sqft | DOM | Units | Dist |
|---|---|---|---|---|---|---|---|---|
| 1711 County Road E E Saint Paul, MN | 2.0 | 1.0–2.0 | 904 | $2,610 | $2.89 | 1d | 15 | 0.66mi |
| 3600 Hoffman Rd Saint Paul, MN | 2.0 | 1.0–2.0 | 807 | $2,440 | $3.02 | 1d | 22 | 0.75mi |
| 3185 Karth Rd Saint Paul, MN | 2.0 | 2.0 | 1045 | $1,832 | $1.75 | 1d | 5 | 0.77mi |
| 2299 Randy Ave Saint Paul, MN | 3.0 | 2.0 | 1558 | $2,350 | $1.51 | 1d | 1 | 1.01mi |
| 2515 Jansen Ave White Bear Lake, MN | 3.0 | 3.0 | 1742 | $3,400 | $1.95 | 1d | 1 | 1.06mi |
Listing history 13 events
-
2026-05-18status Pending 539-char remark
-
2026-05-16historical Contingent - Inspection 539-char remark
-
2026-05-03$277,500 Active 539-char remark
-
2025-06-05historical
-
2025-03-28status Active
-
2025-02-08price $390,000
-
2025-01-17$399,000 Active
-
2025-01-15historical
-
2022-06-09soldstatus $342,000
-
2022-06-08soldstatus $342,000 Sold
Show marketing remark (138 chars)
This White Bear Lake one-story home offers a patio, and a two-car garage. This home has been virtually staged to illustrate its potential.
-
2022-04-30status Pending
Show marketing remark (138 chars)
This White Bear Lake one-story home offers a patio, and a two-car garage. This home has been virtually staged to illustrate its potential.
-
2022-04-20$342,000 Active
Show marketing remark (138 chars)
This White Bear Lake one-story home offers a patio, and a two-car garage. This home has been virtually staged to illustrate its potential.
-
2022-03-23soldstatus $324,000
ⓘ Source: listings_history table (triggers on properties + properties_extension) + one-shot
backfill from property_details.listing_events for pre-trigger history.
Tax reassessment forecast MN · Partial reset (capped growth)
- Current annual tax
- $4,932 · $411/mo
- Projected year-2 tax
- $4,932 · $411/mo
- Expected delta
- $0/yr ($0/mo · 0.0%)
ⓘ Screening estimate from a state-policy table — verify with the county assessor before closing.
Climate risk First Street
- Flood 1/10 Low FEMA zone X (unshaded) · 0% chance over 30 yrs
- Wildfire 1/10 Low
- Heat 2/10 Low 7 d/yr ≥99°F today · 14 d/yr by 30 yrs out
- Wind 2/10 Low
- Air quality 3/10 Moderate 2 unhealthy d/yr today · 2 by 30 yrs out
Nearby sold comps map
Loading sold comps map…
Walkable amenities ~0.75 mi
Loading nearby amenities…
Taxation est. · year 1
- Rental income
- $29,214
- − Mortgage interest
- −$15,544
- − Property taxes
- −$4,932
- − Insurance
- −$1,388
- − Repairs & maintenance
- −$2,337
- − Management
- −$2,337
- − Depreciation
- −$8,073
- Taxable loss
- −$5,397
- Est. tax savings @ 24.0%
- +$1,295
- After-tax cash flow
- $592/yr
For passive investors: Depreciation is non-cash, so a rental often shows a tax loss while cash-flowing — sheltering income. Rental losses are passive: they offset passive income freely, and up to $25,000/yr can offset ordinary (W-2) income if you actively participate and your MAGI is under $100k (phasing out to $0 by $150k); unused losses carry forward. On sale, claimed depreciation is recaptured at up to 25%, and gains may owe capital-gains tax (a 1031 exchange can defer both). Figures are a year-1 estimate at your 24.0% rate — not tax advice; consult a CPA.
Schools (NCES district)
- District
- White Bear Lake School District
- NCES district ID
- 2742360
- Math proficiency
- 45% ▼ -18.00%
- Reading proficiency
- 57% ▼ -8.00%
- Median HH income
- $73,051
- Composite
- 45.78/100
- National rank
- #2564
- State rank
- #83 of 301 in MN
Livability — White Bear Lake
- Score
- 77/100
- State rank
- #124
- US rank
- #2842
Category grades
Schools grade is shown separately in the Schools card above.
Census & demographics
- Census place
- White Bear Lake, MN
- County
- Ramsey County · 542,837 people
- City population
- 37,305
- Metro
- Minneapolis-St. Paul-Bloomington, MN-WI
- Population (ZIP)
- 37,305
- Household income
- $101,296
- Rent vs Own
- Severe rent burden
- 867.0
Population outlook (Ramsey County) Hauer SSP2
- Today (2025)
- 603,431 people
- By 2030
- 636,459 · +5.5%
- By 2040
- 700,596 · +16.1%
- By 2050
- 765,819 · +26.9%
- By 2075
- 929,297 · +54.0%
- By 2100
- 1,053,924 · +74.7%
Race, ethnicity, and origin ACS 2023
- Neighborhood character
- Predominantly White (84%)
- Race & ethnicity
- White 84% Hispanic / Latino 5% Two or more races 5% Asian 3% Black 2%
- Hispanic origin (detail)
- Mexican 4%
- Common ancestry
- Portuguese 10% Romanian 5% Lithuanian 4%
- Foreign-born
- 5% · Canada, Vietnam
- Languages at home
- 94% English-only · Spanish 3% Other Asian/Pacific 2% German/W. Germanic 0%
Political lean MEDSL · Ramsey
- 2024 margin
- Solid D (+43.3) · D 70.5% · R 27.2% · Other 2.3%
- 2008→2024 swing
- +9.4pp toward D · 2008: 33.9pp · 2024: 43.3pp
- All cycles
- 2024: D+43.3 2020: D+45.4 2016: D+39.4 2012: D+35.3 2008: D+33.9
Not yet ingested
- Civics
- —
Market trends
- HPI YoY
- ▼ -296.94%
- Current HPI
- 237.0992
- Rent YoY
- ▲ 2.82%
- Metro
- Minneapolis-St. Paul-Bloomington, MN-WI
- State GDP YoY
- ▲ 2.41%
- F500 in state
- 34
Industry mix (Fortune 500 HQ in MN)
| Industry | F500 HQs | Revenue |
|---|---|---|
| Healthcare | 2 | $407B |
|
||
| Retail | 2 | $150B |
|
||
| Consumer Goods | 2 | $32B |
|
||
| Industrial Machinery | 2 | $6B |
|
||
| Agriculture | 1 | $40B |
|
||
| Healthcare / Medical Devices | 1 | $32B |
|
||
Price history
-7.4% since first listed14 events — show timeline
- 2026-06-12 Sold (MLS) $300,000 NORTHSTARMLS as Distributed by MLS Grid
- 2026-05-18 Pending — NORTHSTARMLS as Distributed by MLS Grid
- 2026-05-16 Contingent — NORTHSTARMLS as Distributed by MLS Grid
- 2026-05-03 Listed $277,500 NORTHSTARMLS as Distributed by MLS Grid
- 2025-06-05 Listing Removed — NORTHSTARMLS as Distributed by MLS Grid
- 2025-03-28 Relisted — NORTHSTARMLS as Distributed by MLS Grid
- 2025-02-08 Price Changed $390,000 NORTHSTARMLS as Distributed by MLS Grid
- 2025-01-17 Listed $399,000 NORTHSTARMLS as Distributed by MLS Grid
- 2025-01-15 Coming Soon — NORTHSTARMLS as Distributed by MLS Grid
- 2022-06-09 Sold (Public Records) $342,000 Public Records
- 2022-06-08 Sold (MLS) $342,000 NORTHSTARMLS as Distributed by MLS Grid
- 2022-04-30 Pending — NORTHSTARMLS as Distributed by MLS Grid
- 2022-04-20 Listed $342,000 NORTHSTARMLS as Distributed by MLS Grid
- 2022-03-23 Sold (Public Records) $324,000 Public Records
Property tax history
+6.5%/yrLatest (2025): $4,932 · +10.6% YoY. Source: county tax records.
Cash-flow waterfall
monthlySold comps — $/sqft
last 12 mo · ≤1 miLoading sold comps…