 Duplex
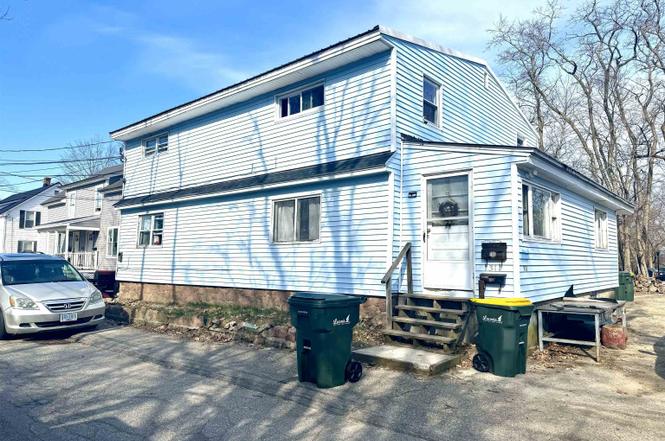
31-33 Howard St · Laconia, NH
Flood risk 8/10 · Major
- FEMA flood zone
- AE
- Chance of flooding over 30 yrs
- 0.78%
- Est. flood insurance / yr
- $2,026 – $9,024
Fire risk 1/10 · Minimal
- Est. fire insurance / yr
- $507 – $941
Heat risk 3/10 · Minor
- Hot days now (above 91°F)
- 7 days/yr
- Hot days in 30 yrs
- 16 days/yr
Wind risk 4/10 · Minor
- Chance of severe wind over 30 yrs
- 9.0%
Air-quality risk 2/10 · Minimal
- Unhealthy air days now
- 1 days/yr
- Unhealthy air days in 30 yrs
- 1 days/yr
Risk factors via First Street. Map © Google.
Why this score? — see what drove the B- grade
The composite is a weighted blend of 9 inputs, each scored 0–100. Each bar is that input's sub-score; the figure is the points it added to the 100-point composite (weight × sub-score).
- Cash flow +27.4/30.0
- DSCR +9.6/10.0
- ARV discount +7.5/15.0
- 1% rule +7.1/10.0
- Rent growth +5.0/5.0
- Livability +4.0/5.0
- Condition / age +2.5/5.0
- Schools +2.4/10.0
- Appreciation +0.0/10.0
$420,000
🖨 Deal sheet (PDF) 📄 Offer letter ✓ Due diligence
Multi-family units
County records classify this as Multi-Family (2-4 Unit). Listing-text estimate: 2 units. confirmed
Listing remarks MLS
Great investment opportunity to own this fully occupied 3-unit property located in a neighborhood and close to all the Lakes Region has to offer: Restaurants, shopping, beaches, schools, hospital and downtown. Unit A consists of 2 levels, 3 bedrooms, enclosed porch and is fully renovated. Unit B is a 1st floor unit and has 2 bedrooms. Unit C is located on the 2nd floor, has 2 bedrooms and is fully renovated. Some newer windows, newer furnace and hot water heater, large back yard and plenty of parking. Financials and additional details available upon request.
Key facts
- New plumbing systems
- Fully renovated
- Newer windows
Tags
Property features AI
Exterior
- Parking: Paved driveway
- Utilities: Public water; Public sewer; Circuit breaker electrical service; Cable available on site; High-speed internet available
- Home design: Multi-family property; Existing construction
- Construction: Vinyl siding; Metal and asphalt shingle roof; Built in 1850
- Exterior features: Level lot; Near shopping and neighborhood amenities; Close to hospital; Paved driveway; Roads are paved and publicly maintained; Located in a flood zone
Interior
- Bedrooms: Three-unit building with two 2-bedroom units and one 3+ bedroom unit
- Heating & cooling: Oil heating; No central cooling
- Interior features: Basement present with walk-up access; Basement has dirt floor
Neighborhood map
What this means for you Summary
Snapshot
- This is a 2 × 4-bed/?-bath units multifamily listed at $420k.
Deal economics
- At list price, monthly cash flow is $774 ($9k/yr) — positive. Per door: $387/mo.
- The deal already cash-flows at list — no discount required.
- Meets the 1% rule at list price ($5k rent vs $420k).
- Cap rate 9.8% vs local median 1.8% in Laconia — top-decile yield for the area; either an underpriced asset or a hidden risk that comps aren't pricing in. Stress-test before assuming the spread holds.
Location & tenants
- Location reads 79/100 on livability (#20 in NH, #2,314 nationally) — a middle-class / working-renter tenant base. Strengths: cost of living A+, housing A+, health & safety A+; Watch: schools D, commute F.
- Laconia School District (town): math 24% / reading 31% proficiency, ranked #89 of 98 in NH (top 91%) — low school quality limits family demand, transient renter base, plan for 1-2y turnover.
- Market conditions: Rents rising fast (+21.6%/yr); 188 active listings in the ZIP; 301 units permitted in Belknap County in 2024 (32 in 5+ unit buildings).
- At $5,070/mo this rent would consume 83% of the median local household income ($73k/yr) (locally 722% of renters already pay >50% of income on rent) — very limited rent-growth headroom before tenants either downsize or default.
Forward outlook
- Local home prices are declining (-3.0%/yr); year-one equity from $3k of loan paydown is wiped out by about $13k of value loss. Plan a longer hold.
- Belknap County population projected at -10% by 2050 — secular population decline; favor cash flow + early exit over multi-decade hold.
- At projected returns (-3.0% appreciation + 8.0% rent growth), your $118k cash investment doubles in ~8 years — after that, you're playing with house money.
Negotiation context
- Only 2 days on market — expect competitive offers; lowballing is unlikely to land.
- 5 sale attempts since 29y ago with the ask held roughly flat each time — persistent listings suggest the price (not the market) is what's stuck; bring a comps-based counter.
Risks & watch-outs
- Watch-outs: flood insurance adds $460/mo; built in 1850 — expect roof / HVAC / electrical / plumbing capex.
- Climate carrying-cost: in FEMA flood zone AE (mandatory federal flood insurance) — expect insurance premiums to compound above CPI over the hold.
Questions for the listing agent
- Can we see the unit-by-unit rent roll, current vacancy, and any below-market leases? What's the average tenancy length?
- What capital expenditures (roof, boiler, parking lot, exteriors) have been made in the last 5 years, and what's planned in the next 2?
- Built in 1850 — when were the roof, HVAC, electrical panel, plumbing, and water heater last replaced?
- What's the actual annual flood-insurance premium (NFIP or private), and is the property in a SFHA with mandatory coverage?
- Is there a deadline driving the sale (1031 exchange, divorce, estate, relocation)? That informs how much negotiation room exists.
- Schools are D-rated, which usually means shorter tenancies and higher turnover. Who's the typical renter profile here, and what's been the actual vacancy rate?
- What's the average days-on-market for RENTAL listings here right now (not sales)? A rising rental-DOM trend means longer vacancies and softer asking-rent achievability than the comps imply.
- What's the recent tenant-quality profile in this submarket — average credit score on applications, eviction rate, late-payment / NSF rate, and stable-employment percentage? A property-management company in the area should have these aggregated.
- How much new apartment / multifamily construction is in the pipeline within 1–3 miles? Heavy new supply (>2% of stock underway) typically softens rents 12–24 months out; light construction supports rent growth.
Investment metrics
- 1% rule
- 1.21% ✓
- Cap rate
- 9.82%
- Cash-on-cash
- 12.59%
- DSCR
- 1.56
- GRM
- 6.9
CMA / ARV
No comps found within radius.
Projected returns pro-forma
-3.0% appreciation · 8.0% rent growth · sell at horizon
- IRR
- 1.7%
- Equity multiple
- 1.07×
- Total profit
- $8,297
- Equity at exit
- $62,623
- IRR
- 16.1%
- Equity multiple
- 2.65×
- Total profit
- $193,765
- Equity at exit
- $36,314
Cash invested: $117,600 (down + closing). Projections, not guarantees.
Landlord ↔ Tenant lean methodology
- Overall (STATE)
- 56 Moderately Landlord-Leaning
- State New Hampshire
- 56 Moderately Landlord-Leaning · D+1
- County
- — inherits STATE
- City
- — inherits STATE
ZIP-level market 03246
- Home prices YoY
- -19.8%
- Rents YoY
- 21.6%
- Active inventory
- 188
- Price-to-rent
- 13.8×
Monthly cashflow live
- Estimated rent
- $5,070 medium interval (Pro) →
- Mortgage (P&I)
- −$2,203
- Tax from tax record
- −$394 /mo · $4,723/yr
- Insurance
- −$175
- Flood insurance flood zone
- −$460 /mo · $5,525/yr
- HOA
- −$0
- Vacancy / Maint / Mgmt
- −$1,065
- Net cashflow
- $774
Break-even live
Sensitivity live
| Price | -10% $1,012 | -5% $893 | +0% $774 | +5% $655 | +10% $536 |
|---|---|---|---|---|---|
| Rent | -10% $373 | -5% $574 | +0% $774 | +5% $974 | +10% $1,174 |
| Rate | -1.0pp $985 | -0.5pp $881 | base $774 | +0.5pp $665 | +1.0pp $554 |
2-unit breakdown (identical units grouped — click to expand)
| Units | Beds | Baths | Est. rent |
|---|---|---|---|
| 2× units | 4 | — | $5,070 |
| #1 | 4 | — | $2,535 |
| #2 | 4 | — | $2,535 |
| Total (2 units) | $5,070 | ||
UW: 25.0% down · 7.5% · 30yr · 1.5% tax · 5.0% vac · 8.0% maint · 8.0% mgmt
Financing live
Cash to close
- Down payment
- $105,000
- Closing costs
- $12,600
- Reserves months
- —
- Total cash needed
- —
Loan-product check · same deal, 3 products live
Conventional
25% down · 7.5% · 30yr
- Down + closing
- —
- Monthly P&I
- —
- Monthly cashflow
- —
- DSCR
- —
- Eligible?
- —
Personal DTI + credit; lowest rate.
DSCR
20% down · 8.5% · 30yr
- Down + closing
- —
- Monthly P&I
- —
- Monthly cashflow
- —
- DSCR
- —
- Eligible?
- —
No personal income docs; deal must DSCR.
Hard money
10% down · 12.0% · 12mo
- Down + closing
- —
- Monthly P&I
- —
- Monthly cashflow
- —
- DSCR
- —
- Eligible?
- —
Short-term bridge; refi at stabilization.
Listing history 3 events
-
2026-06-19days on market $420,000 Active 2 DOM
-
2026-06-17remarks 699-char remark
-
2026-06-17$420,000 Active 1 DOM
ⓘ Source: listings_history table (triggers on properties + properties_extension) + one-shot
backfill from property_details.listing_events for pre-trigger history.
Tax reassessment forecast NH · Partial reset (capped growth)
- Current annual tax
- $4,723 · $394/mo
- Projected year-2 tax
- $6,940 · $578/mo
- Expected delta
- +$2,216/yr (+$185/mo · 46.9%)
ⓘ Screening estimate from a state-policy table — verify with the county assessor before closing.
Climate risk First Street
- Flood 8/10 Severe FEMA zone AE · 78% chance over 30 yrs
- Wildfire 1/10 Low
- Heat 3/10 Moderate 7 d/yr ≥91°F today · 16 d/yr by 30 yrs out
- Wind 4/10 Moderate 9% chance of damaging wind over 30 yrs
- Air quality 2/10 Low 1 unhealthy d/yr today · 1 by 30 yrs out
Nearby sold comps map
Loading sold comps map…
Walkable amenities ~0.75 mi
Loading nearby amenities…
Taxation est. · year 1
- Rental income
- $60,840
- − Mortgage interest
- −$23,527
- − Property taxes
- −$4,723
- − Insurance
- −$7,625
- − Repairs & maintenance
- −$4,867
- − Management
- −$4,867
- − Depreciation
- −$12,218
- Taxable income
- $3,013
- Est. tax owed @ 24.0%
- −$723
- After-tax cash flow
- $8,562/yr
For passive investors: Depreciation is non-cash, so a rental often shows a tax loss while cash-flowing — sheltering income. Rental losses are passive: they offset passive income freely, and up to $25,000/yr can offset ordinary (W-2) income if you actively participate and your MAGI is under $100k (phasing out to $0 by $150k); unused losses carry forward. On sale, claimed depreciation is recaptured at up to 25%, and gains may owe capital-gains tax (a 1031 exchange can defer both). Figures are a year-1 estimate at your 24.0% rate — not tax advice; consult a CPA.
Schools (NCES district)
- District
- Laconia School District
- NCES district ID
- 3304140
- Math proficiency
- 24% ▼ -8.00%
- Reading proficiency
- 31% ▼ -7.00%
- Median HH income
- $49,155
- Composite
- 24.03/100
- National rank
- #7770
- State rank
- #89 of 98 in NH
Livability — Laconia
- Score
- 79/100
- State rank
- #20
- US rank
- #2314
Category grades
Schools grade is shown separately in the Schools card above.
Census & demographics
- Census place
- Laconia, NH
- County
- Belknap County · 17,103 people
- City population
- 17,103
- Metro
- Laconia, NH
- Population (ZIP)
- 17,103
- Household income
- $73,241
- Rent vs Own
- Severe rent burden
- 722.0
Population outlook (Belknap County) Hauer SSP2
- Today (2025)
- 60,702 people
- By 2030
- 60,353 · -0.6%
- By 2040
- 58,264 · -4.0%
- By 2050
- 54,533 · -10.2%
- By 2075
- 45,622 · -24.8%
- By 2100
- 33,772 · -44.4%
Race, ethnicity, and origin ACS 2023
- Neighborhood character
- Predominantly White (90%)
- Race & ethnicity
- White 90% Two or more races 4% Hispanic / Latino 3% Asian 1%
- Common ancestry
- Lithuanian 17% Slovak 2% Romanian 2%
- Foreign-born
- 3% · Canada
- Languages at home
- 95% English-only · Spanish 2% French/Haitian/Cajun 2% Other Indo-European 1%
Political lean MEDSL · Belknap
- 2024 margin
- R (+13.1) · D 43.1% · R 56.1%
- 2008→2024 swing
- -14.2pp toward R · 2008: 1.2pp · 2024: -13.1pp
- All cycles
- 2024: R+13.1 2020: R+10.4 2016: R+16.8 2012: R+5.0 2008: D+1.2
Not yet ingested
- Civics
- —
Market trends
- HPI YoY
- ▼ -96.22%
- Current HPI
- 389.8118
- Rent YoY
- ▲ 21.59%
- Metro
- Laconia, NH
- State GDP YoY
- —
- F500 in state
- 0
Price history
+613.1% since first listed13 events — show timeline
- 2026-06-17 Listed $420,000 PrimeMLS
- 2024-06-20 Sold (Public Records) $385,000 Public Records
- 2024-06-20 Listed $345,000 PrimeMLS
- 2024-06-20 Sold (MLS) $385,000 PrimeMLS
- 2024-06-19 Sold (MLS) $385,000 MLS PIN
- 2024-03-20 Pending — MLS PIN
- 2024-03-14 Listed $349,900 MLS PIN
- 2022-03-25 Sold (MLS) $192,969 PrimeMLS
- 2021-09-24 Contingent — PrimeMLS
- 2021-09-20 Listed $199,900 PrimeMLS
- 1997-12-01 Sold (Public Records) $58,900 Public Records
- 1997-11-25 Sold (MLS) $58,900 PrimeMLS
- 1997-09-30 Listed $58,900 PrimeMLS
Property tax history
+8.5%/yrLatest (2025): $4,723 · +0.1% YoY. Source: county tax records.
Cash-flow waterfall
monthlySold comps — $/sqft
last 12 mo · ≤1 miLoading sold comps…