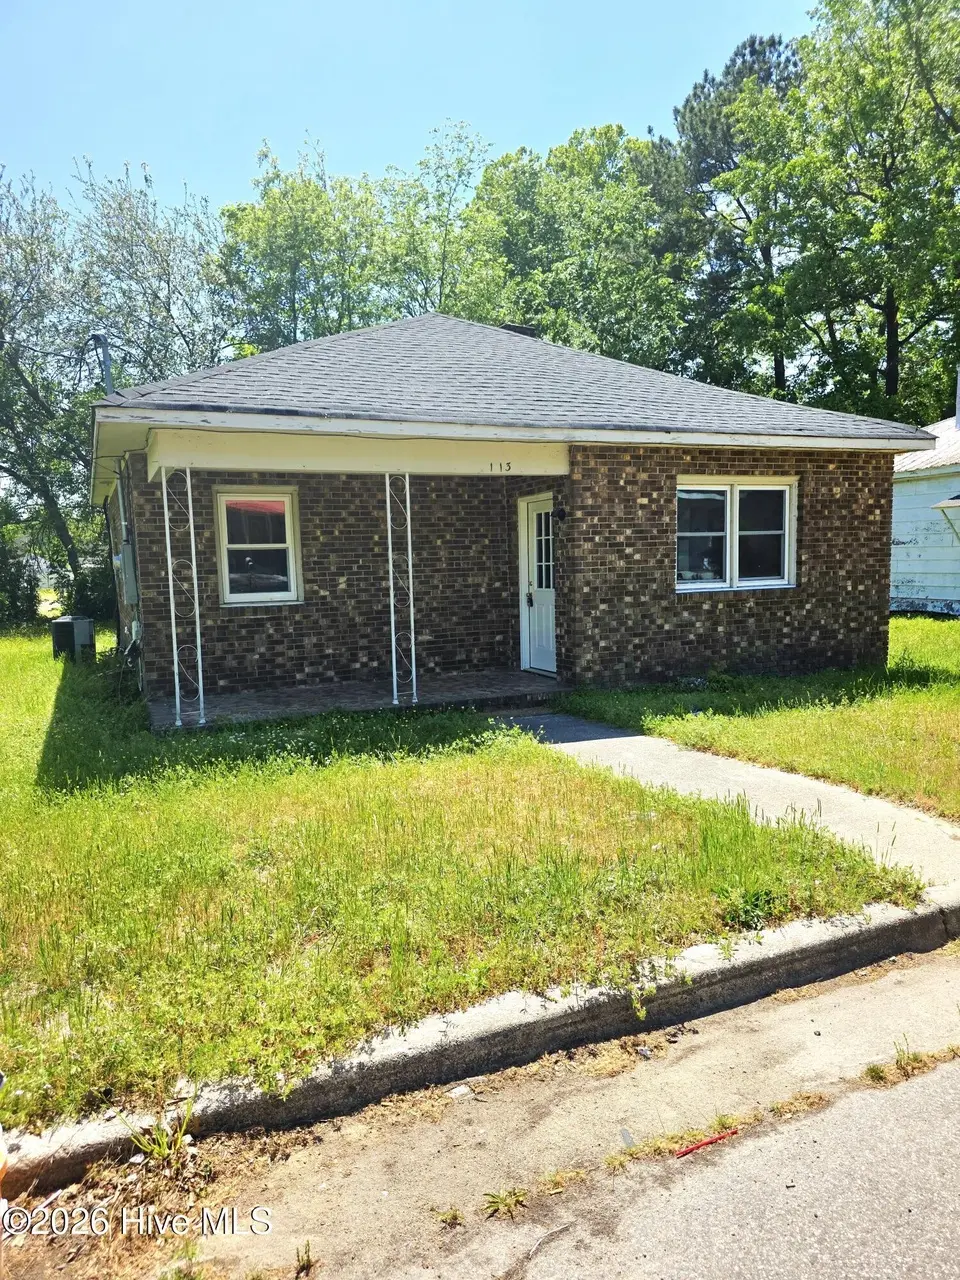
113 Cedar St · Rocky Mount, NC
Flood risk 7/10 · Major
- FEMA flood zone
- X (shaded)
- Chance of flooding over 30 yrs
- 0.76%
- Est. flood insurance / yr
- $507 – $1,088
Fire risk 3/10 · Minor
- Est. fire insurance / yr
- $906 – $1,684
Heat risk 8/10 · Major
- Hot days now (above 107°F)
- 7 days/yr
- Hot days in 30 yrs
- 16 days/yr
Wind risk 6/10 · Moderate
- Chance of severe wind over 30 yrs
- 68.0%
Air-quality risk 2/10 · Minimal
- Unhealthy air days now
- 1 days/yr
- Unhealthy air days in 30 yrs
- 2 days/yr
Risk factors via First Street. Map © Google.
Why this score? — see what drove the D+ grade
The composite is a weighted blend of 9 inputs, each scored 0–100. Each bar is that input's sub-score; the figure is the points it added to the 100-point composite (weight × sub-score).
- Cash flow +23.4/30.0
- DSCR +7.5/10.0
- 1% rule +6.1/10.0
- Rent growth +3.9/5.0
- Livability +3.5/5.0
- Condition / age +2.5/5.0
- Schools +2.2/10.0
- ARV discount +0.0/15.0
- Appreciation +0.0/10.0
$124,900
🖨 Deal sheet 📄 Offer letter ✓ Due diligence
Listing remarks
Welcome to 113 Cedar Street- Great investment property. The perfect blend of classic charm and modern updates! What's better than a traditional brick ranch? One that's been thoughtfully updated! This home features vinyl flooring with nice windows allowing the space to have beautiful natural light. Recent HVAC, plumbing, giving you peace of mind for years to come. The current owner carries flood insurance, and we're happy to help you secure a quote. minimal maintenance. This gem won't last long. Schedule your showing today!
Key facts
- Vinyl flooring
- Minimal maintenance
- Natural light
Tags
Property features AI
Finance
- Other: Zoning: R-6; Lot dimensions approximately 97 x 51 (0.11 acres); Paved road access; Has view
Exterior
- Parking: On-street parking available; No garage or off-street parking listed
- Utilities: Public water; Sewer available; Water available
- Home design: Single-family residence; One level / One story; Entry on level 1; Residential property
- Construction: Block and brick construction; Block foundation; Built with shingle roof
- Exterior features: No notable exterior features listed; No patio or porch; No fencing; Shingle roof
Interior
- Kitchen: Electric oven; Electric cooktop; Electric water heater
- Bedrooms: Total rooms: 4
- Bathrooms: 1 full bathroom
- Heating & cooling: Central air conditioning; Electric forced-air heating
- Interior features: Ceiling fan(s); Eat-in kitchen; Unfurnished
- Laundry & utility: Washer hookup; Dedicated laundry room
Neighborhood map
What this means for you Summary
Snapshot
- This is a 3-bed/1.0-bath single-family listed at $125k.
Deal economics
- At list price, monthly cash flow is $165 ($2k/yr) — positive.
- The deal already cash-flows at list — no discount required.
- Meets the 1% rule at list price ($1k rent vs $125k).
- Recommended offer: $121k (3.0% below list) — sets the bar for market timing.
- Cap rate 8.5% vs local median 4.5% in Rocky Mount — top-decile yield for the area; either an underpriced asset or a hidden risk that comps aren't pricing in. Stress-test before assuming the spread holds.
Location & tenants
- Location reads 70/100 on livability (#134 in NC) — a middle-class / working-renter tenant base. Strengths: cost of living A+, housing A+, health & safety A+; Watch: crime F, amenities F, employment F.
- Nash-Rocky Mount Schools (rural): math 20% / reading 32% proficiency, ranked #155 of 178 in NC (top 87%) — low school quality limits family demand, transient renter base, plan for 1-2y turnover.
- Zoned schools: Williford Elementary (201 students, 98% FRL); Rocky Mount Middle (math 7% / reading 26%, grade F, #449 of 475 statewide, top 96%, 407 students, 97% FRL); Rocky Mount High (math 27% / reading 36%, grade F, #449 of 535 statewide, top 85%, 1,072 students, 76% FRL) — zoned schools average 90% FRL vs 59% district-wide (31 pts higher); higher-poverty schools than district average — tighter screening recommended.
- Market conditions: Rents rising fast (+5.5%/yr); 171 active listings in the ZIP; 500 units permitted in Nash County in 2024 (0 in 5+ unit buildings).
Forward outlook
- Local home prices are declining (-3.0%/yr); year-one equity from $864 of loan paydown is wiped out by about $4k of value loss. Plan a longer hold.
- Nash County population projected at -12% by 2050 — secular population decline; favor cash flow + early exit over multi-decade hold.
Negotiation context
- It's been on market 42 days — a 3% lower offer ($121k) is reasonable based on typical stale-listing flexibility.
- 3 sale attempts since 3y ago with the ask held roughly flat each time — persistent listings suggest the price (not the market) is what's stuck; bring a comps-based counter.
- Current owner paid $22k; list at $125k implies a 455% gain — meaningful room to come down on a strong offer.
Risks & watch-outs
- Watch-outs: flood insurance adds $66/mo; built in 1950 — expect roof / HVAC / electrical / plumbing capex.
- Climate carrying-cost: major flood risk; major wind risk, 68% chance of damaging wind over 30y; extreme-heat days projected 7→16/yr by 2055 (HVAC capex compounding) — expect insurance premiums to compound above CPI over the hold.
Questions for the listing agent
- It's been on market 42 days. Have you received any prior offers? Is the seller open to a 3% concession, seller financing, or rate buy-down credit?
- Built in 1950 — when were the roof, HVAC, electrical panel, plumbing, and water heater last replaced?
- What's the actual annual flood-insurance premium (NFIP or private), and is the property in a SFHA with mandatory coverage?
- Is there a deadline driving the sale (1031 exchange, divorce, estate, relocation)? That informs how much negotiation room exists.
- Schools are F-rated, which usually means shorter tenancies and higher turnover. Who's the typical renter profile here, and what's been the actual vacancy rate?
- Crime grade is F in this area — have there been break-ins, vandalism, or insurance claims at this property in the last 3 years? What carrier currently insures it and at what premium?
- The area grade is low — what's the realistic commute time and amenity access for the typical tenant pool here? Any planned neighborhood developments (good or bad) we should know about?
- What's the average days-on-market for RENTAL listings here right now (not sales)? A rising rental-DOM trend means longer vacancies and softer asking-rent achievability than the comps imply.
- What's the recent tenant-quality profile in this submarket — average credit score on applications, eviction rate, late-payment / NSF rate, and stable-employment percentage? A property-management company in the area should have these aggregated.
- How much new for-sale + rental construction is in the pipeline within 1–3 miles? Heavy new supply typically softens prices + rents 12–24 months out; constrained supply supports both.
Investment metrics
- 1% rule
- 1.11% ✓
- Cap rate
- 8.52%
- Cash-on-cash
- 7.95%
- DSCR
- 1.35
- GRM
- 7.5
CMA / ARV
- ARV (on-the-fly)
- $102,564
- Comps found
- 12
Show comp detail 12 sales within ~0.75 mi
| Address | Dist | Beds/Ba | Sqft | Sold | Price | $/sf | Match |
|---|---|---|---|---|---|---|---|
| 2520 Dalton Rd | 0.43mi | 3/1.5 | 1,302 (-2%) | 6mo | $100,000 | $77 | 69 |
| 417 Kingston Ave | 0.43mi | 3/1.5 | 1,297 (-3%) | 8mo | $80,000 | $62 | 67 |
| 223 Renfrow St | 0.15mi | 3/1.0 | 1,176 (-12%) | 10mo | $37,000 | $31 | 66 |
| 1362 S Franklin St | 0.62mi | 3/1.5 | 1,340 (+1%) | 18mo | $59,000 | $44 | 53 |
| 801 Lincoln Dr | 0.65mi | 3/2.0 | 1,251 (-6%) | 5mo | $170,000 | $136 | 52 |
| 625 Powell Dr | 0.70mi | 3/1.5 | 1,212 (-9%) | 1mo | $148,500 | $123 | 50 |
| 1348 S Franklin St | 0.64mi | 2/1.0 (-1) | 1,292 (-3%) | 17mo | $76,000 | $59 | 46 |
| 1215 Boone St | 0.72mi | 3/1.0 | 1,242 (-7%) | 16mo | $73,000 | $59 | 42 |
| 637 Clayton St | 0.69mi | 3/2.0 | 1,149 (-14%) | 1mo | $179,900 | $157 | 40 |
| 505 Arrington Ave | 0.68mi | 4/2.0 (+1) | 1,397 (+5%) | 15mo | $140,000 | $100 | 39 |
| 1219 Boone St | 0.70mi | 3/1.5 | 1,200 (-10%) | 18mo | $81,000 | $68 | 34 |
| 520 Lincoln Dr | 0.74mi | 3/1.5 | 1,500 (+13%) | 13mo | $187,000 | $125 | 32 |
Match score weights: distance 35% · size 25% · config 20% · recency 20%. Top-matched comps best support the ARV.
Projected returns pro-forma
-3.0% appreciation · 5.51% rent growth · sell at horizon
- IRR
- -4.5%
- Equity multiple
- 0.83×
- Total profit
- $-6,070
- Equity at exit
- $18,623
- IRR
- 8.1%
- Equity multiple
- 1.69×
- Total profit
- $24,010
- Equity at exit
- $10,799
Cash invested: $34,972 (down + closing). Projections, not guarantees.
Landlord ↔ Tenant lean methodology
- Overall (STATE)
- 85 Strongly Landlord-Friendly
- State North Carolina
- 85 Strongly Landlord-Friendly · R+3
- County
- — inherits STATE
- City
- — inherits STATE
ZIP-level market 27803
- Rents YoY
- 5.5%
- Active inventory
- 171
- Price-to-rent
- 7.5×
Monthly cashflow live
- Estimated rent
- $1,386 medium interval (Pro) →
- Mortgage (P&I)
- −$655
- Tax est. 1.5%
- −$156 /mo · $1,874/yr
- Insurance
- −$52
- Flood insurance flood zone
- −$66 /mo · $798/yr
- HOA
- −$0
- Vacancy / Maint / Mgmt
- −$291
- Net cashflow
- $165
Break-even live
UW: 25.0% down · 7.5% · 30yr · 1.5% tax · 5.0% vac · 8.0% maint · 8.0% mgmt
Financing live
Cash to close
- Down payment
- $31,225
- Closing costs
- $3,747
- Reserves months
- —
- Total cash needed
- —
Loan-product check · same deal, 3 products live
Conventional
25% down · 7.5% · 30yr
- Down + closing
- —
- Monthly P&I
- —
- Monthly cashflow
- —
- DSCR
- —
- Eligible?
- —
Personal DTI + credit; lowest rate.
DSCR
20% down · 8.5% · 30yr
- Down + closing
- —
- Monthly P&I
- —
- Monthly cashflow
- —
- DSCR
- —
- Eligible?
- —
No personal income docs; deal must DSCR.
Hard money
10% down · 12.0% · 12mo
- Down + closing
- —
- Monthly P&I
- —
- Monthly cashflow
- —
- DSCR
- —
- Eligible?
- —
Short-term bridge; refi at stabilization.
Listing history 26 events
-
2026-06-19days on market $124,900 Active 42 DOM
-
2026-06-18days on market $124,900 Active 41 DOM
-
2026-06-17days on market $124,900 Active 40 DOM
-
2026-06-16pricedays on market $124,900 Active 39 DOM
-
2026-06-15days on market $130,000 Active 38 DOM
-
2026-06-14days on market $130,000 Active 36 DOM
-
2026-06-13days on market $130,000 Active 35 DOM
-
2026-06-10days on market $130,000 Active 33 DOM
-
2026-06-09days on market $130,000 Active 32 DOM
-
2026-06-08days on market $130,000 Active 31 DOM
-
2026-06-07days on market $130,000 Active 30 DOM
-
2026-06-03days on market $130,000 Active 26 DOM
-
2026-06-02days on market $130,000 Active 25 DOM
-
2026-06-01days on market $130,000 Active 24 DOM
-
2026-05-31days on market $130,000 Active 23 DOM
-
2026-05-30days on market $130,000 Active 22 DOM
-
2026-04-29$130,000 Active
-
2023-09-26price $130,000
-
2023-07-22status Active
-
2023-07-22price $147,500
-
2023-06-26status Pending
-
2023-06-26historical
-
2023-06-14price $159,000
-
2023-05-13$165,000 Active
-
2008-10-01soldstatus $22,500
-
2005-12-28soldstatus $60,000
ⓘ Source: listings_history table (triggers on properties + properties_extension) + one-shot
backfill from property_details.listing_events for pre-trigger history.
Climate risk First Street
- Flood 7/10 Severe FEMA zone X (shaded) · 76% chance over 30 yrs
- Wildfire 3/10 Moderate
- Heat 8/10 Severe 7 d/yr ≥107°F today · 16 d/yr by 30 yrs out
- Wind 6/10 Major 68% chance of damaging wind over 30 yrs
- Air quality 2/10 Low 1 unhealthy d/yr today · 2 by 30 yrs out
Nearby sold comps map
Loading sold comps map…
Walkable amenities ~0.75 mi
Loading nearby amenities…
Taxation est. · year 1
- Rental income
- $16,630
- − Mortgage interest
- −$6,996
- − Property taxes
- −$1,874
- − Insurance
- −$1,422
- − Repairs & maintenance
- −$1,330
- − Management
- −$1,330
- − Depreciation
- −$3,633
- Taxable income
- $44
- Est. tax owed @ 24.0%
- −$10
- After-tax cash flow
- $1,972/yr
For passive investors: Depreciation is non-cash, so a rental often shows a tax loss while cash-flowing — sheltering income. Rental losses are passive: they offset passive income freely, and up to $25,000/yr can offset ordinary (W-2) income if you actively participate and your MAGI is under $100k (phasing out to $0 by $150k); unused losses carry forward. On sale, claimed depreciation is recaptured at up to 25%, and gains may owe capital-gains tax (a 1031 exchange can defer both). Figures are a year-1 estimate at your 24.0% rate — not tax advice; consult a CPA.
Schools (NCES district)
- District
- Nash-Rocky Mount Schools
- NCES district ID
- 3703270
- Math proficiency
- 20% ▼ -3.00%
- Reading proficiency
- 32% ▲ 1.00%
- Median HH income
- $41,553
- Composite
- 22.04/100
- National rank
- #8198
- State rank
- #155 of 178 in NC
Livability — Rocky Mount
- Score
- 70/100
- State rank
- #134
- US rank
- #7692
Category grades
Schools grade is shown separately in the Schools card above.
Census & demographics
- Census place
- Rocky Mount, NC
- County
- Nash County · 50,768 people
- City population
- 70,300
- Metro
- Rocky Mount, NC
- Population (ZIP)
- 20,055
- Household income
- $60,124
- Rent vs Own
- Severe rent burden
- 641.0
Population outlook (Nash County) Hauer SSP2
- Today (2025)
- 91,107 people
- By 2030
- 89,193 · -2.1%
- By 2040
- 84,959 · -6.7%
- By 2050
- 80,517 · -11.6%
- By 2075
- 72,941 · -19.9%
- By 2100
- 63,602 · -30.2%
Race, ethnicity, and origin ACS 2023
- Neighborhood character
- Diverse neighborhood (Simpson 0.60)
- Race & ethnicity
- White 46% Black 44% Two or more races 6% Hispanic / Latino 5% Asian 1%
- Common ancestry
- Iranian 1% Italian 1% Slovak 1%
- Foreign-born
- 3% · Canada
- Languages at home
- 93% English-only · Spanish 5% Arabic 1% Other Indo-European 1%
Political lean MEDSL · Nash
- 2024 margin
- Toss-up / Even · D 48.7% · R 50.5%
- 2008→2024 swing
- -0.4pp no change · 2008: -1.3pp · 2024: -1.8pp
- All cycles
- 2024: R+1.8 2020: D+0.2 2016: R+0.2 2012: D+0.9 2008: R+1.3
Not yet ingested
- Civics
- —
Market trends
- HPI YoY
- ▼ -162.95%
- Current HPI
- 190.0204
- Rent YoY
- ▲ 5.51%
- Metro
- Rocky Mount, NC
- State GDP YoY
- ▲ 3.28%
- F500 in state
- 26
Industry mix (Fortune 500 HQ in NC)
| Industry | F500 HQs | Revenue |
|---|---|---|
| Financial Services | 2 | $213B |
|
||
| Retail | 2 | $95B |
|
||
| Industrial Conglomerate | 1 | $38B |
|
||
| Metals / Steel | 1 | $35B |
|
||
| Utilities | 1 | $30B |
|
||
| Industrial Machinery | 1 | $19B |
|
||
Price history
+116.7% since first listed10 events — show timeline
- 2026-04-29 Listed $130,000 Hive MLS
- 2023-09-26 Price Changed $130,000 Hive MLS
- 2023-07-22 Relisted — Hive MLS
- 2023-07-22 Price Changed $147,500 Hive MLS
- 2023-06-26 Pending — Hive MLS
- 2023-06-26 Listing Removed — Hive MLS
- 2023-06-14 Price Changed $159,000 Hive MLS
- 2023-05-13 Listed $165,000 Hive MLS
- 2008-10-01 Sold (Public Records) $22,500 Public Records
- 2005-12-28 Sold (Public Records) $60,000 Public Records
Property tax history
-3.6%/yrLatest (2025): $228 · +0.0% YoY. Source: county tax records.
Cash-flow waterfall
monthlySold comps — $/sqft
last 12 mo · ≤1 miLoading sold comps…