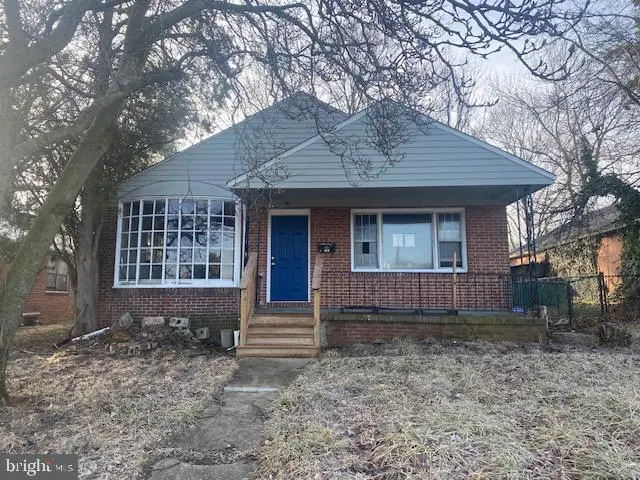
4513 W Forest Park Ave · Baltimore, MD
Flood risk 1/10 · Minimal
- FEMA flood zone
- X (unshaded)
- Chance of flooding over 30 yrs
- 0.0%
- Est. flood insurance / yr
- $473 – $860
Fire risk 1/10 · Minimal
- Est. fire insurance / yr
- $755 – $1,403
Heat risk 6/10 · Moderate
- Hot days now (above 103°F)
- 7 days/yr
- Hot days in 30 yrs
- 15 days/yr
Wind risk 5/10 · Moderate
- Chance of severe wind over 30 yrs
- 26.0%
Air-quality risk 3/10 · Minor
- Unhealthy air days now
- 3 days/yr
- Unhealthy air days in 30 yrs
- 4 days/yr
Risk factors via First Street. Map © Google.
Why this score? — see what drove the C- grade
The composite is a weighted blend of 9 inputs, each scored 0–100. Each bar is that input's sub-score; the figure is the points it added to the 100-point composite (weight × sub-score).
- ARV discount +15.0/15.0
- Cash flow +12.3/30.0
- Appreciation +9.8/10.0
- Rent growth +3.8/5.0
- Livability +3.8/5.0
- DSCR +3.7/10.0
- 1% rule +2.6/10.0
- Condition / age +2.5/5.0
- Schools +1.0/10.0
$240,000
🖨 Deal sheet (PDF) 📄 Offer letter ✓ Due diligence
Listing remarks MLS
Located across the street from Forest Park Golf Course. The home has been demo'd and is ready for a renovation. There is a full unfinished basement, large footprint. Get in early on this one! Seller prefers Cash/ Hard Money as the home will be sold As-Is.
Key facts
- Large footprint
- 6,775 sq ft lot
- Built 1952
Tags
Neighborhood map
What this means for you Summary
Snapshot
- This is a 3-bed/2.0-bath single-family listed at $240k.
Deal economics
- At list price, monthly cash flow is $-43 ($-510/yr) — negative.
- To cash-flow at today's rent, offer at most $232k (3.1% below list).
- To meet the 1% rule (rent ≥ 1% of price), the offer needs to be $183k (23.6% below list).
- Recommended offer: $183k (23.6% below list) — sets the bar for 1% rule.
Location & tenants
- Location reads 76/100 on livability (#90 in MD, #3,396 nationally) — a middle-class / working-renter tenant base. Strengths: amenities A+, commute A+, housing A+; Watch: crime F.
- Baltimore City Public Schools (urban): math 7% / reading 16% proficiency, ranked #24 of 24 in MD (top 100%) — low school quality limits family demand, transient renter base, plan for 1-2y turnover; 79% free/reduced lunch — lower-income household profile, screen leases tightly.
- Zoned schools: Elmer A. Henderson: A Johns Hopkins Partnership (math 2% / reading 16%, grade F, #650 of 860 statewide, top 77%, 642 students, 80% FRL); Vanguard Collegiate Middle (math 3% / reading 15%, grade F, #212 of 225 statewide, top 95%, 343 students, 84% FRL); Baltimore Polytechnic Institute (math 71% / reading 84%, grade A-, #22 of 222 statewide, top 10%, 1,555 students, 43% FRL).
- Zoned-school proficiency averages 32% at this address vs 12% district-wide (+20 pts) — the actual schools serving this property are materially stronger than the Baltimore City Public Schools average implies; a family-tenant draw the district grade alone would hide.
- Market conditions: Rents rising fast (+5.2%/yr); 131 active listings in the ZIP; 11 comparable units currently listed for rent nearby; rentals at typical pace (median 25d on market — plan ~3-4 weeks tenant-placement turnaround); 1,273 units permitted in Baltimore city in 2024 (1,104 in 5+ unit buildings).
- This rent runs 33% of the median local income ($67k/yr) — at the standard rent-burdened threshold; future hikes will face affordability resistance.
Forward outlook
- In year one you build about $24k of equity ($2k loan paydown + $23k appreciation (9.5% local appreciation)).
- Baltimore County population projected to shrink 4% by 2050 — rents likely to lag national; underwrite the cash flow, not the appreciation.
- At projected returns (9.5% appreciation + 5.2% rent growth), your $67k cash investment doubles in ~3 years — after that, you're playing with house money.
- By year 2, paydown + projected appreciation supports a ~$39k cash-out refi (75% LTV) — recoverable capital for the next deal without selling this one.
Negotiation context
- It's been on market 89 days — a 6% lower offer ($226k) is reasonable based on typical stale-listing flexibility.
Risks & watch-outs
- Watch-outs: built in 1952 — expect roof / HVAC / electrical / plumbing capex.
- Climate carrying-cost: moderate wind risk, 26% chance of damaging wind over 30y; extreme-heat days projected 7→15/yr by 2055 (HVAC capex compounding) — expect insurance premiums to compound above CPI over the hold.
Questions for the listing agent
- What do current leases actually rent for vs. the listed asking? Can we see a recent rent roll and the last 12 months of T-12 income?
- It's been on market 89 days. Have you received any prior offers? Is the seller open to a 24% concession, seller financing, or rate buy-down credit?
- Built in 1952 — when were the roof, HVAC, electrical panel, plumbing, and water heater last replaced?
- Why hasn't it sold? Are there any deal-killer items the seller is aware of (foundation, flood, title, zoning, code violations)?
- Is there a deadline driving the sale (1031 exchange, divorce, estate, relocation)? That informs how much negotiation room exists.
- Schools are D-rated, which usually means shorter tenancies and higher turnover. Who's the typical renter profile here, and what's been the actual vacancy rate?
- Crime grade is F in this area — have there been break-ins, vandalism, or insurance claims at this property in the last 3 years? What carrier currently insures it and at what premium?
- What's the average days-on-market for RENTAL listings here right now (not sales)? A rising rental-DOM trend means longer vacancies and softer asking-rent achievability than the comps imply.
- What's the recent tenant-quality profile in this submarket — average credit score on applications, eviction rate, late-payment / NSF rate, and stable-employment percentage? A property-management company in the area should have these aggregated.
- How much new for-sale + rental construction is in the pipeline within 1–3 miles? Heavy new supply typically softens prices + rents 12–24 months out; constrained supply supports both.
Investment metrics
- 1% rule
- 0.76% ✗
- Cap rate
- 6.08%
- Cash-on-cash
- -0.76%
- DSCR
- 0.97
- GRM
- 10.9
CMA / ARV
- ARV (median comp)
- $325,700
- List price
- $240,000
- Delta
- -26.31%
- Verdict
- UNDERPRICED
- Comps
- 20 within 1.0 mi
Show comp detail 12 sales within ~0.75 mi
| Address | Dist | Beds/Ba | Sqft | Sold | Price | $/sf | Match |
|---|---|---|---|---|---|---|---|
| 2909 Lawina Rd | 0.35mi | 3/2.0 | 1,846 (-1%) | 6mo | $227,000 | $123 | 77 |
| 4701 Norfolk Ave | 0.15mi | 4/3.0 (+1) | 1,810 (-3%) | 4mo | $380,000 | $210 | 76 |
| 4711 W Forest Park Ave | 0.18mi | 3/2.0 | 1,740 (-6%) | 8mo | $315,000 | $181 | 74 |
| 4504 Norfolk Ave | 0.05mi | 4/2.5 (+1) | 2,067 (+11%) | 0mo | $267,000 | $129 | 72 |
| 4501 Springdale Ave | 0.41mi | 4/2.5 (+1) | 1,864 (+0%) | 8mo | $215,000 | $115 | 66 |
| 2316 Tucker Ln | 0.75mi | 3/2.0 | 1,875 (+1%) | 1mo | $420,000 | $224 | 63 |
| 3016 Wayne Ave | 0.70mi | 3/2.0 | 1,922 (+3%) | 4mo | $245,000 | $127 | 58 |
| 3002 Oakhill Ave | 0.61mi | 3/3.0 | 1,832 (-2%) | 8mo | $360,000 | $197 | 58 |
| 2916 N Loudon Ave | 0.39mi | 3/2.5 | 2,002 (+8%) | 12mo | $306,000 | $153 | 57 |
| 2907 Mount Holly St | 0.61mi | 4/3.5 (+1) | 1,890 (+2%) | 8mo | $355,000 | $188 | 52 |
| 4012 Chatham Rd | 0.73mi | 3/2.0 | 1,928 (+4%) | 11mo | $310,000 | $161 | 51 |
| 5202 Norwood Ave | 0.71mi | 4/2.5 (+1) | 1,723 (-7%) | 7mo | $319,900 | $186 | 42 |
Match score weights: distance 35% · size 25% · config 20% · recency 20%. Top-matched comps best support the ARV.
Projected returns pro-forma
9.5% appreciation · 5.23% rent growth · sell at horizon
- IRR
- 23.4%
- Equity multiple
- 2.84×
- Total profit
- $123,947
- Equity at exit
- $207,506
- IRR
- 21.4%
- Equity multiple
- 6.57×
- Total profit
- $374,357
- Equity at exit
- $438,544
Cash invested: $67,200 (down + closing). Projections, not guarantees.
Landlord ↔ Tenant lean methodology
- Overall (CITY)
- 12 Strongly Tenant-Friendly
- State Maryland
- 27 Tenant-Leaning · D+14
- County
- — inherits STATE
- City Baltimore
- 12 Strongly Tenant-Friendly · D+58
ZIP-level market 21207
- Home prices YoY
- 1.1%
- Rents YoY
- 5.2%
- Active inventory
- 131
- Price-to-rent
- 10.9×
Monthly cashflow live
- Estimated rent
- $1,833 high interval (Pro) →
- Mortgage (P&I)
- −$1,259
- Tax from tax record
- −$132 /mo · $1,583/yr
- Insurance
- −$100
- HOA
- −$0
- Vacancy / Maint / Mgmt
- −$385
- Net cashflow
- $-43
Break-even live
Sensitivity live
| Price | -10% $93 | -5% $25 | +0% $-43 | +5% $-110 | +10% $-178 |
|---|---|---|---|---|---|
| Rent | -10% $-187 | -5% $-115 | +0% $-43 | +5% $30 | +10% $102 |
| Rate | -1.0pp $78 | -0.5pp $19 | base $-43 | +0.5pp $-105 | +1.0pp $-168 |
UW: 25.0% down · 7.5% · 30yr · 1.5% tax · 5.0% vac · 8.0% maint · 8.0% mgmt
Financing live
Cash to close
- Down payment
- $60,000
- Closing costs
- $7,200
- Reserves months
- —
- Total cash needed
- —
Loan-product check · same deal, 3 products live
Conventional
25% down · 7.5% · 30yr
- Down + closing
- —
- Monthly P&I
- —
- Monthly cashflow
- —
- DSCR
- —
- Eligible?
- —
Personal DTI + credit; lowest rate.
DSCR
20% down · 8.5% · 30yr
- Down + closing
- —
- Monthly P&I
- —
- Monthly cashflow
- —
- DSCR
- —
- Eligible?
- —
No personal income docs; deal must DSCR.
Hard money
10% down · 12.0% · 12mo
- Down + closing
- —
- Monthly P&I
- —
- Monthly cashflow
- —
- DSCR
- —
- Eligible?
- —
Short-term bridge; refi at stabilization.
Rent comps 11 comps
| Address | Beds | Baths | Sqft | Rent | $/sqft | DOM | Units | Dist |
|---|---|---|---|---|---|---|---|---|
| 4309 Norfolk Ave Unit 1st Floor Baltimore, MD | 2.0 | 1.0 | 1470 | $1,500 | $1.02 | 12d | 1 | 0.22mi |
| 3914 Maine Ave Unit 3 Baltimore, MD | 2.0 | 1.0 | 2127 | $1,150 | $0.54 | 45d | 1 | 0.61mi |
| 3904 Gwynns Falls Pkwy Baltimore, MD | 3.0 | 2.0 | 1772 | $2,600 | $1.47 | 45d | 1 | 0.84mi |
| 2103 Chelsea Ter Unit 2 Baltimore, MD | 3.0 | 1.5 | 1500 | $2,100 | $1.40 | 16d | 1 | 1.03mi |
| 2103 Chelsea Ter Unit 1 Baltimore, MD | 2.0 | 2.0 | 1500 | $2,200 | $1.47 | 16d | 1 | 1.03mi |
| 3508 Grantley Rd Baltimore, MD | 2.0 | 1.0 | 1250 | $1,350 | $1.08 | 25d | 1 | 1.08mi |
| 3709 Nortonia Rd #2 Baltimore, MD | 2.0 | 1.0 | 1289 | $1,450 | $1.12 | 19d | 1 | 1.20mi |
| 3213 Vickers Rd Unit 1 Baltimore, MD | 2.0 | 1.0 | 2568 | $1,700 | $0.66 | 25d | 1 | 1.25mi |
| 3535 Flannery Ln Gwynn Oak, MD | 3.0 | 1.5 | 1536 | $2,000 | $1.30 | 45d | 1 | 1.33mi |
| 3784 Columbus Dr Baltimore, MD | 4.0 | 2.0 | 1250 | $2,200 | $1.76 | 25d | 1 | 1.47mi |
| 3030 Windsor Ave Baltimore, MD | 4.0 | 1.5 | 2124 | $1,995 | $0.94 | 6d | 1 | 1.50mi |
Listing history 5 events
-
2026-06-02status $240,000 Pending 89 DOM
-
2026-06-01days on market $240,000 Active 89 DOM
-
2026-05-31days on market $240,000 Active 88 DOM
-
2026-03-25price $240,000 255-char remark
Show marketing remark (255 chars)
Located across the street from Forest Park Golf Course. The home has been demo'd and is ready for a renovation. There is a full unfinished basement, large footprint. Get in early on this one! Seller prefers Cash/ Hard Money as the home will be sold As-Is.
-
2026-03-04$250,000 Active 255-char remark
Show marketing remark (255 chars)
Located across the street from Forest Park Golf Course. The home has been demo'd and is ready for a renovation. There is a full unfinished basement, large footprint. Get in early on this one! Seller prefers Cash/ Hard Money as the home will be sold As-Is.
ⓘ Source: listings_history table (triggers on properties + properties_extension) + one-shot
backfill from property_details.listing_events for pre-trigger history.
Tax reassessment forecast MD · Partial reset (capped growth)
- Current annual tax
- $1,583 · $132/mo
- Projected year-2 tax
- $2,100 · $175/mo
- Expected delta
- +$516/yr (+$43/mo · 32.6%)
ⓘ Screening estimate from a state-policy table — verify with the county assessor before closing.
Climate risk First Street
- Flood 1/10 Low FEMA zone X (unshaded) · 0% chance over 30 yrs
- Wildfire 1/10 Low
- Heat 6/10 Major 7 d/yr ≥103°F today · 15 d/yr by 30 yrs out
- Wind 5/10 Major 26% chance of damaging wind over 30 yrs
- Air quality 3/10 Moderate 3 unhealthy d/yr today · 4 by 30 yrs out
Nearby sold comps map
Loading sold comps map…
Walkable amenities ~0.75 mi
Loading nearby amenities…
Taxation est. · year 1
- Rental income
- $21,995
- − Mortgage interest
- −$13,444
- − Property taxes
- −$1,583
- − Insurance
- −$1,200
- − Repairs & maintenance
- −$1,760
- − Management
- −$1,760
- − Depreciation
- −$6,982
- Taxable loss
- −$4,733
- Est. tax savings @ 24.0%
- +$1,136
- After-tax cash flow
- $626/yr
For passive investors: Depreciation is non-cash, so a rental often shows a tax loss while cash-flowing — sheltering income. Rental losses are passive: they offset passive income freely, and up to $25,000/yr can offset ordinary (W-2) income if you actively participate and your MAGI is under $100k (phasing out to $0 by $150k); unused losses carry forward. On sale, claimed depreciation is recaptured at up to 25%, and gains may owe capital-gains tax (a 1031 exchange can defer both). Figures are a year-1 estimate at your 24.0% rate — not tax advice; consult a CPA.
Schools (NCES district)
- District
- Baltimore City Public Schools
- NCES district ID
- 2400090
- Math proficiency
- 7% ▼ -9.00%
- Reading proficiency
- 16% ▼ -5.00%
- Median HH income
- $42,108
- Composite
- 10.08/100
- National rank
- #9805
- State rank
- #24 of 24 in MD
Livability — Baltimore
- Score
- 76/100
- State rank
- #90
- US rank
- #3396
Category grades
Schools grade is shown separately in the Schools card above.
Census & demographics
- Census place
- Baltimore, MD
- County
- Baltimore County · 769,527 people
- City population
- 588,727
- Metro
- Baltimore-Columbia-Towson, MD
- Population (ZIP)
- 47,099
- Household income
- $67,060
- Rent vs Own
- Severe rent burden
- 2139.0
Population outlook (Baltimore County) Hauer SSP2
- Today (2025)
- 624,249 people
- By 2030
- 621,541 · -0.4%
- By 2040
- 609,756 · -2.3%
- By 2050
- 597,249 · -4.3%
- By 2075
- 552,236 · -11.5%
- By 2100
- 513,934 · -17.7%
Race, ethnicity, and origin ACS 2023
- Neighborhood character
- Predominantly Black (78%)
- Race & ethnicity
- Black 78% White 8% Hispanic / Latino 7% Two or more races 5% Asian 3%
- Hispanic origin (detail)
- Puerto Rican 1%
- Common ancestry
- Swedish 1%
- Foreign-born
- 13% · Canada, Philippines, South Korea
- Languages at home
- 86% English-only · Spanish 4% French/Haitian/Cajun 1% Other Asian/Pacific 1%
Political lean MEDSL · Baltimore
- 2024 margin
- Solid D (+73.0) · D 85.2% · R 12.2% · Other 2.6%
- 2008→2024 swing
- -2.5pp toward R · 2008: 75.5pp · 2024: 73.0pp
- All cycles
- 2024: D+73.0 2020: D+76.6 2016: D+74.6 2012: D+76.4 2008: D+75.5
Not yet ingested
- Civics
- —
Market trends
- HPI YoY
- ▲ 9.50%
- Current HPI
- 843.63
- Rent YoY
- ▲ 5.23%
- Metro
- Baltimore-Columbia-Towson, MD
- State GDP YoY
- ▲ 2.97%
- F500 in state
- 12
Industry mix (Fortune 500 HQ in MD)
| Industry | F500 HQs | Revenue |
|---|---|---|
| Aerospace / Defense | 1 | $71B |
|
||
| Utilities | 1 | $25B |
|
||
| Hotels | 1 | $24B |
|
||
| Consumer Goods | 1 | $7B |
|
||
| Real Estate | 1 | $6B |
|
||
| Chemicals | 1 | $2B |
|
||
Price history
-4.0% since first listed2 events — show timeline
- 2026-03-25 Price Changed $240,000 BRIGHT MLS
- 2026-03-04 Listed $250,000 BRIGHT MLS
Property tax history
-6.4%/yrLatest (2025): $1,583 · +2.4% YoY. Source: county tax records.
Cash-flow waterfall
monthlySold comps — $/sqft
last 12 mo · ≤1 miLoading sold comps…