6919 Winthrop St · Detroit, MI
Flood risk 1/10 · Minimal
- FEMA flood zone
- X (unshaded)
- Chance of flooding over 30 yrs
- 0.0%
- Est. flood insurance / yr
- $473 – $860
Fire risk 1/10 · Minimal
- Est. fire insurance / yr
- $784 – $1,456
Heat risk 3/10 · Minor
- Hot days now (above 97°F)
- 7 days/yr
- Hot days in 30 yrs
- 15 days/yr
Wind risk 2/10 · Minimal
- Chance of severe wind over 30 yrs
- —
Air-quality risk 3/10 · Minor
- Unhealthy air days now
- 2 days/yr
- Unhealthy air days in 30 yrs
- 4 days/yr
Risk factors via First Street. Map © Google.
Why this score? — see what drove the C- grade
The composite is a weighted blend of 9 inputs, each scored 0–100. Each bar is that input's sub-score; the figure is the points it added to the 100-point composite (weight × sub-score).
- Cash flow +22.1/30.0
- ARV discount +7.3/15.0
- DSCR +7.1/10.0
- 1% rule +5.4/10.0
- Livability +3.7/5.0
- Condition / age +2.5/5.0
- Rent growth +1.9/5.0
- Schools +1.3/10.0
- Appreciation +0.0/10.0
$124,900
🖨 Deal sheet 📄 Offer letter ✓ Due diligence
Listing remarks MLS
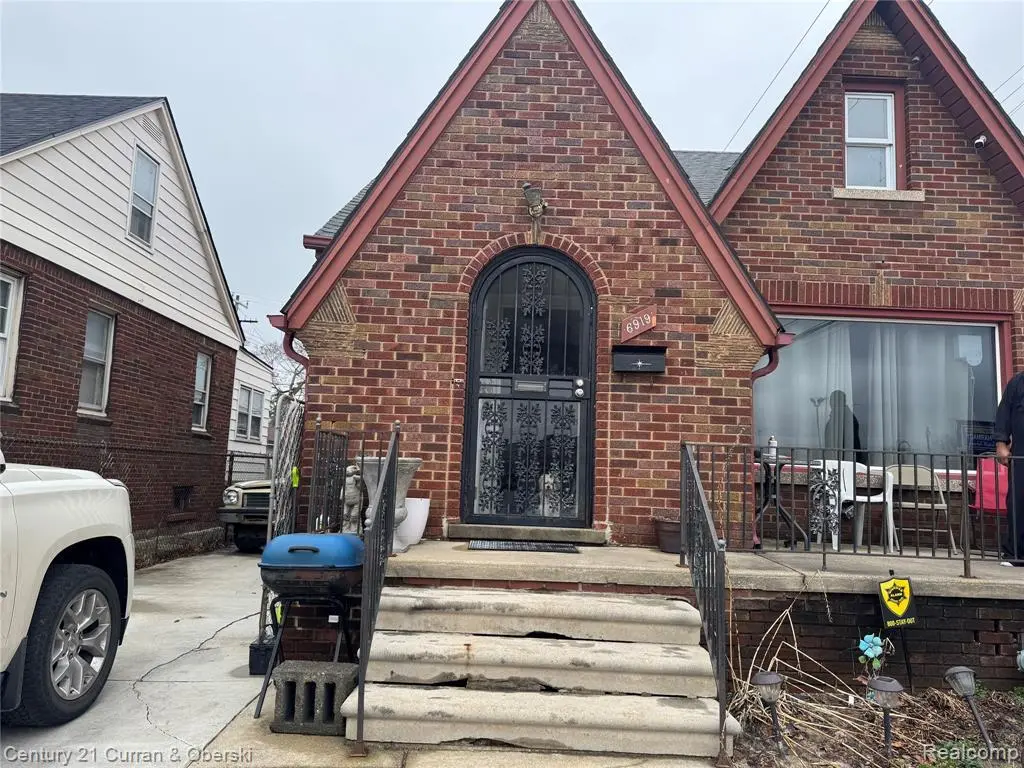
THREE BEDROOM BRICK TUDOR/BUNGALOW LOCATED IN WEST WARREN AVE ESTATES NO. 1 SUB. THIS ALL BRICK TUDOR HOME HAS 2 FULL BATHROOMS, SPACIOUS LIVING ROOM, KITCHEN, DINING ROOM AND A FINISHED BASEMENT. HARDWOOD FLOORS THROUGHOUT. NICE LARGE FRONT PORCH, SIDE ENTRANCE GARAGE WITH ALLEY ACCESS. SELLER IS PROVIDING A 1 YEAR HOME WARRANTY FROM AMERICAN HOME SHIELD.
Key facts
- 5,227 sq ft lot
- Built 1931
Property features AI
Finance
- Other: Lot dimensions approximately 40 x 131 (0.12 acres)
- HOA & community: Sidewalks in the neighborhood; Pets allowed (cats and dogs)
Exterior
- Parking: Driveway; Alley access; No garage
- Utilities: Public water; Public sewer; Cable available
- Home design: Single-family residence; One and one-half stories; Ground-level entry with steps; Brick construction
- Construction: Asphalt roof; Block foundation; Built with brick; Home warranty included
- Exterior features: Porch; Exterior lighting; Fenced yard; Level lot; Paved road access; Paver block at driveway/alley access
Interior
- Kitchen: Gas water heater
- Bedrooms: Total of 5 rooms (bedroom count not specified)
- Bathrooms: 2 full bathrooms
- Heating & cooling: Forced-air heating (natural gas); No central cooling
- Interior features: High-speed internet available; Unfurnished; Finished full basement
- Laundry & utility: Washer hookup; Gas dryer hookup
Neighborhood map
What this means for you Summary
Snapshot
- This is a 3-bed/1.0-bath single-family listed at $125k.
Deal economics
- At list price, monthly cash flow is $201 ($2k/yr) — positive.
- The deal already cash-flows at list — no discount required.
- Meets the 1% rule at list price ($1k rent vs $125k).
Location & tenants
- Location reads 73/100 on livability (#218 in MI) — a middle-class / working-renter tenant base. Strengths: amenities A+, commute A+, cost of living A+; Watch: schools F, crime F, employment F.
- Detroit Public Schools Community District (urban): math 10% / reading 24% proficiency, ranked #499 of 540 in MI (top 92%) — low school quality limits family demand, transient renter base, plan for 1-2y turnover; 90% free/reduced lunch — lower-income household profile, screen leases tightly.
- Market conditions: Rents soft (-2.3%/yr); 363 active listings in the ZIP; 20 comparable units currently listed for rent nearby; rentals at typical pace (median 25d on market — plan ~3-4 weeks tenant-placement turnaround); lower-income renter base — watch delinquency; 2,639 units permitted in Wayne County in 2024 (1,216 in 5+ unit buildings).
- At $1,298/mo this rent would consume 51% of the median local household income ($31k/yr) (locally 4144% of renters already pay >50% of income on rent) — very limited rent-growth headroom before tenants either downsize or default.
Forward outlook
- Local home prices are declining (-3.0%/yr); year-one equity from $864 of loan paydown is wiped out by about $4k of value loss. Plan a longer hold.
- Wayne County population projected at -17% by 2050 — secular population decline; favor cash flow + early exit over multi-decade hold.
Negotiation context
- Only 1 days on market — expect competitive offers; lowballing is unlikely to land.
- 6 sale attempts since 24y ago with the ask held roughly flat each time — persistent listings suggest the price (not the market) is what's stuck; bring a comps-based counter.
Risks & watch-outs
- Watch-outs: built in 1931 — expect roof / HVAC / electrical / plumbing capex.
Questions for the listing agent
- Built in 1931 — when were the roof, HVAC, electrical panel, plumbing, and water heater last replaced?
- Is there a deadline driving the sale (1031 exchange, divorce, estate, relocation)? That informs how much negotiation room exists.
- Schools are F-rated, which usually means shorter tenancies and higher turnover. Who's the typical renter profile here, and what's been the actual vacancy rate?
- Crime grade is F in this area — have there been break-ins, vandalism, or insurance claims at this property in the last 3 years? What carrier currently insures it and at what premium?
- What's the average days-on-market for RENTAL listings here right now (not sales)? A rising rental-DOM trend means longer vacancies and softer asking-rent achievability than the comps imply.
- What's the recent tenant-quality profile in this submarket — average credit score on applications, eviction rate, late-payment / NSF rate, and stable-employment percentage? A property-management company in the area should have these aggregated.
- How much new for-sale + rental construction is in the pipeline within 1–3 miles? Heavy new supply typically softens prices + rents 12–24 months out; constrained supply supports both.
Investment metrics
- 1% rule
- 1.04% ✓
- Cap rate
- 8.23%
- Cash-on-cash
- 6.90%
- DSCR
- 1.31
- GRM
- 8.0
CMA / ARV
- ARV (on-the-fly)
- $124,215
- Comps found
- 12
Show comp detail 12 sales within ~0.75 mi
| Address | Dist | Beds/Ba | Sqft | Sold | Price | $/sf | Match |
|---|---|---|---|---|---|---|---|
| 7304 Saint Marys St | 0.33mi | 3/1.0 | 1,215 (+3%) | 5mo | $50,000 | $41 | 76 |
| 7483 Mettetal St | 0.47mi | 3/1.5 | 1,124 (-5%) | 5mo | $86,000 | $77 | 64 |
| 6857 Woodmont Ave | 0.51mi | 3/1.5 | 1,234 (+4%) | 7mo | $129,000 | $105 | 61 |
| 6128 Yinger Ave | 0.64mi | 3/2.0 | 1,188 (+0%) | 6mo | $167,500 | $141 | 60 |
| 6400 Payne Ave | 0.55mi | 3/1.0 | 1,119 (-5%) | 7mo | $185,000 | $165 | 60 |
| 7904 Mead St | 0.59mi | 3/1.0 | 1,080 (-9%) | 6mo | $160,000 | $148 | 53 |
| 6303 Grandmont Ave | 0.72mi | 3/2.0 | 1,230 (+4%) | 4mo | $90,000 | $73 | 53 |
| 6324 Montrose St | 0.44mi | 3/1.0 | 1,042 (-12%) | 9mo | $76,000 | $73 | 52 |
| 8040 Coyle St | 0.65mi | 3/1.0 | 1,248 (+6%) | 10mo | $150,000 | $120 | 52 |
| 7484 Clayburn St | 0.75mi | 3/1.0 | 1,100 (-7%) | 7mo | $80,000 | $73 | 48 |
| 6463 Payne Ave | 0.46mi | 4/2.0 (+1) | 1,350 (+14%) | 6mo | $320,000 | $237 | 41 |
| 8201 Saint Marys St | 0.74mi | 3/1.0 | 1,020 (-14%) | 10mo | $58,000 | $57 | 34 |
Match score weights: distance 35% · size 25% · config 20% · recency 20%. Top-matched comps best support the ARV.
Projected returns pro-forma
-3.0% appreciation · 0.0% rent growth · sell at horizon
- IRR
- -9.0%
- Equity multiple
- 0.68×
- Total profit
- $-11,236
- Equity at exit
- $18,623
- IRR
- -4.0%
- Equity multiple
- 0.77×
- Total profit
- $-8,004
- Equity at exit
- $10,799
Cash invested: $34,972 (down + closing). Projections, not guarantees.
Landlord ↔ Tenant lean methodology
- Overall (STATE)
- 62 Landlord-Friendly
- State Michigan
- 62 Landlord-Friendly · EVEN
- County
- — inherits STATE
- City
- — inherits STATE
ZIP-level market 48228
- Rents YoY
- -2.3%
- Active inventory
- 363
- Price-to-rent
- 8.0×
Monthly cashflow live
- Estimated rent
- $1,298 high interval (Pro) →
- Mortgage (P&I)
- −$655
- Tax from tax record
- −$117 /mo · $1,404/yr
- Insurance
- −$52
- HOA
- −$0
- Vacancy / Maint / Mgmt
- −$273
- Net cashflow
- $201
Break-even live
UW: 25.0% down · 7.5% · 30yr · 1.5% tax · 5.0% vac · 8.0% maint · 8.0% mgmt
Financing live
Cash to close
- Down payment
- $31,225
- Closing costs
- $3,747
- Reserves months
- —
- Total cash needed
- —
Loan-product check · same deal, 3 products live
Conventional
25% down · 7.5% · 30yr
- Down + closing
- —
- Monthly P&I
- —
- Monthly cashflow
- —
- DSCR
- —
- Eligible?
- —
Personal DTI + credit; lowest rate.
DSCR
20% down · 8.5% · 30yr
- Down + closing
- —
- Monthly P&I
- —
- Monthly cashflow
- —
- DSCR
- —
- Eligible?
- —
No personal income docs; deal must DSCR.
Hard money
10% down · 12.0% · 12mo
- Down + closing
- —
- Monthly P&I
- —
- Monthly cashflow
- —
- DSCR
- —
- Eligible?
- —
Short-term bridge; refi at stabilization.
Rent comps 20 comps
| Address | Beds | Baths | Sqft | Rent | $/sqft | DOM | Units | Dist |
|---|---|---|---|---|---|---|---|---|
| 7312 Mansfield St Detroit, MI | 4.0 | 1.0 | 1300 | $1,400 | $1.08 | 16d | 1 | 0.26mi |
| 7419 Rutherford St Detroit, MI | 2.0 | 1.0 | 981 | $1,150 | $1.17 | 15d | 1 | 0.30mi |
| 6474 Saint Marys St Detroit, MI | 3.0 | 1.0 | 1237 | $1,350 | $1.09 | 43d | 1 | 0.39mi |
| 6406 Mead St Dearborn, MI | 2.0 | 1.0 | 904 | $1,100 | $1.22 | 24d | 1 | 0.58mi |
| 8047 Robson St Detroit, MI | 3.0 | 2.0 | 1184 | $1,200 | $1.01 | 43d | 1 | 0.69mi |
| 6761 Memorial Ave Detroit, MI | 3.0 | 1.0 | 1060 | $1,100 | $1.04 | 24d | 1 | 0.69mi |
| 8114 Marlowe St Unit home Detroit, MI | 3.0 | 1.0 | 985 | $1,350 | $1.37 | 43d | 1 | 0.85mi |
| 8331 Whitcomb St Detroit, MI | 4.0 | 1.0 | 1342 | $1,350 | $1.01 | 22d | 1 | 0.87mi |
| 8212 Lauder St Detroit, MI | 3.0 | 1.0 | 1026 | $1,150 | $1.12 | 43d | 1 | 0.88mi |
| 6225 Middlesex St Unit 5 Dearborn, MI | 2.0 | 1.0 | 700 | $950 | $1.36 | 4d | 1 | 0.99mi |
| 6225 Middlesex St Unit 5 Dearborn, MI | 2.0 | 1.0 | 700 | $950 | $1.36 | 12d | 1 | 0.99mi |
| 8604 Whitcomb St Detroit, MI | 3.0 | 2.0 | 1033 | $1,300 | $1.26 | 43d | 1 | 1.00mi |
| 8262 Rosemont Ave Detroit, MI | 3.0 | 1.0 | 836 | $1,200 | $1.44 | 5d | 1 | 1.27mi |
| 5777 Southfield Fwy Detroit, MI | 2.0 | 1.0–2.0 | 667 | $1,540 | $2.31 | 3d | 10 | 1.34mi |
| 4900 Heather Dr Dearborn, MI | 1.0–2.0 | 1.0–2.0 | 921 | $1,980 | $2.15 | 1d | 1 | 1.36mi |
| 6490 Stahelin Ave Detroit, MI | 3.0 | 1.0 | 960 | $1,299 | $1.35 | 16d | 1 | 1.36mi |
| 8451 Rosemont Ave Detroit, MI | 3.0 | 1.0 | 867 | $1,150 | $1.33 | 43d | 1 | 1.36mi |
| 9222 Forrer St Detroit, MI | 3.0 | 1.0 | 947 | $1,450 | $1.53 | 16d | 1 | 1.39mi |
| 9220 Mansfield St Detroit, MI | 3.0 | 1.0 | 1200 | $1,300 | $1.08 | 43d | 1 | 1.40mi |
| 9345 Rutherford St Unit 3 Detroit, MI | 2.0 | 1.0 | 850 | $1,050 | $1.24 | 24d | 1 | 1.48mi |
Listing history 12 events
-
2026-05-06status Pending 358-char remark
Show marketing remark (358 chars)
THREE BEDROOM BRICK TUDOR/BUNGALOW LOCATED IN WEST WARREN AVE ESTATES NO. 1 SUB. THIS ALL BRICK TUDOR HOME HAS 2 FULL BATHROOMS, SPACIOUS LIVING ROOM, KITCHEN, DINING ROOM AND A FINISHED BASEMENT. HARDWOOD FLOORS THROUGHOUT. NICE LARGE FRONT PORCH, SIDE ENTRANCE GARAGE WITH ALLEY ACCESS. SELLER IS PROVIDING A 1 YEAR HOME WARRANTY FROM AMERICAN HOME SHIELD.
-
2026-05-06status Pending
Show marketing remark (358 chars)
THREE BEDROOM BRICK TUDOR/BUNGALOW LOCATED IN WEST WARREN AVE ESTATES NO. 1 SUB. THIS ALL BRICK TUDOR HOME HAS 2 FULL BATHROOMS, SPACIOUS LIVING ROOM, KITCHEN, DINING ROOM AND A FINISHED BASEMENT. HARDWOOD FLOORS THROUGHOUT. NICE LARGE FRONT PORCH, SIDE ENTRANCE GARAGE WITH ALLEY ACCESS. SELLER IS PROVIDING A 1 YEAR HOME WARRANTY FROM AMERICAN HOME SHIELD.
-
2026-05-04$124,900 Active 358-char remark
Show marketing remark (358 chars)
THREE BEDROOM BRICK TUDOR/BUNGALOW LOCATED IN WEST WARREN AVE ESTATES NO. 1 SUB. THIS ALL BRICK TUDOR HOME HAS 2 FULL BATHROOMS, SPACIOUS LIVING ROOM, KITCHEN, DINING ROOM AND A FINISHED BASEMENT. HARDWOOD FLOORS THROUGHOUT. NICE LARGE FRONT PORCH, SIDE ENTRANCE GARAGE WITH ALLEY ACCESS. SELLER IS PROVIDING A 1 YEAR HOME WARRANTY FROM AMERICAN HOME SHIELD.
-
2026-05-04$124,900 Active
Show marketing remark (358 chars)
THREE BEDROOM BRICK TUDOR/BUNGALOW LOCATED IN WEST WARREN AVE ESTATES NO. 1 SUB. THIS ALL BRICK TUDOR HOME HAS 2 FULL BATHROOMS, SPACIOUS LIVING ROOM, KITCHEN, DINING ROOM AND A FINISHED BASEMENT. HARDWOOD FLOORS THROUGHOUT. NICE LARGE FRONT PORCH, SIDE ENTRANCE GARAGE WITH ALLEY ACCESS. SELLER IS PROVIDING A 1 YEAR HOME WARRANTY FROM AMERICAN HOME SHIELD.
-
2003-08-06historical
-
2003-05-06$124,500
-
2003-05-01historical
-
2003-02-23$124,900
-
2003-02-03historical
-
2003-01-25$154,500
-
2003-01-23historical
-
2002-09-05$129,900
ⓘ Source: listings_history table (triggers on properties + properties_extension) + one-shot
backfill from property_details.listing_events for pre-trigger history.
Tax reassessment forecast MI · Partial reset (capped growth)
- Current annual tax
- $1,404 · $117/mo
- Projected year-2 tax
- $1,664 · $139/mo
- Expected delta
- +$260/yr (+$22/mo · 18.5%)
ⓘ Screening estimate from a state-policy table — verify with the county assessor before closing.
Climate risk First Street
- Flood 1/10 Low FEMA zone X (unshaded) · 0% chance over 30 yrs
- Wildfire 1/10 Low
- Heat 3/10 Moderate 7 d/yr ≥97°F today · 15 d/yr by 30 yrs out
- Wind 2/10 Low
- Air quality 3/10 Moderate 2 unhealthy d/yr today · 4 by 30 yrs out
Nearby sold comps map
Loading sold comps map…
Walkable amenities ~0.75 mi
Loading nearby amenities…
Taxation est. · year 1
- Rental income
- $15,572
- − Mortgage interest
- −$6,996
- − Property taxes
- −$1,404
- − Insurance
- −$624
- − Repairs & maintenance
- −$1,246
- − Management
- −$1,246
- − Depreciation
- −$3,633
- Taxable income
- $422
- Est. tax owed @ 24.0%
- −$101
- After-tax cash flow
- $2,312/yr
For passive investors: Depreciation is non-cash, so a rental often shows a tax loss while cash-flowing — sheltering income. Rental losses are passive: they offset passive income freely, and up to $25,000/yr can offset ordinary (W-2) income if you actively participate and your MAGI is under $100k (phasing out to $0 by $150k); unused losses carry forward. On sale, claimed depreciation is recaptured at up to 25%, and gains may owe capital-gains tax (a 1031 exchange can defer both). Figures are a year-1 estimate at your 24.0% rate — not tax advice; consult a CPA.
Schools (NCES district)
- District
- Detroit Public Schools Community District
- NCES district ID
- 2601103
- Math proficiency
- 10% ▼ -2.00%
- Reading proficiency
- 24% ▲ 6.00%
- Median HH income
- $25,815
- Composite
- 13.06/100
- National rank
- #9564
- State rank
- #499 of 540 in MI
Livability — Detroit
- Score
- 73/100
- State rank
- #218
- US rank
- #5427
Category grades
Schools grade is shown separately in the Schools card above.
Census & demographics
- Census place
- Detroit, MI
- County
- Wayne County · 1,562,939 people
- City population
- 572,865
- Metro
- Detroit-Warren-Dearborn, MI
- Population (ZIP)
- 50,117
- Household income
- $30,680
- Rent vs Own
- Severe rent burden
- 4144.0
Population outlook (Wayne County) Hauer SSP2
- Today (2025)
- 1,675,273 people
- By 2030
- 1,620,300 · -3.3%
- By 2040
- 1,502,341 · -10.3%
- By 2050
- 1,384,039 · -17.4%
- By 2075
- 1,124,592 · -32.9%
- By 2100
- 881,193 · -47.4%
Race, ethnicity, and origin ACS 2023
- Neighborhood character
- Predominantly Black (71%)
- Race & ethnicity
- Black 71% White 16% Two or more races 7% Hispanic / Latino 6%
- Hispanic origin (detail)
- Mexican 3% Puerto Rican 2%
- Common ancestry
- Arab 2% Romanian 2% Lithuanian 1%
- Foreign-born
- 11% · Canada
- Languages at home
- 82% English-only · Arabic 11% Spanish 5%
Political lean MEDSL · Wayne
- 2024 margin
- Strong D (+29.0) · D 62.7% · R 33.7% · Other 3.6%
- 2008→2024 swing
- -20.5pp toward R · 2008: 49.5pp · 2024: 29.0pp
- All cycles
- 2024: D+29.0 2020: D+38.1 2016: D+37.3 2012: D+46.9 2008: D+49.5
Not yet ingested
- Civics
- —
Market trends
- HPI YoY
- ▼ -160.81%
- Current HPI
- 168.6843
- Rent YoY
- ▼ -2.30%
- Metro
- Detroit-Warren-Dearborn, MI
- State GDP YoY
- ▲ 1.37%
- F500 in state
- 28
Industry mix (Fortune 500 HQ in MI)
| Industry | F500 HQs | Revenue |
|---|---|---|
| Automotive Parts | 3 | $48B |
|
||
| Automotive | 2 | $372B |
|
||
| Chemicals | 1 | $45B |
|
||
| Automotive Retail | 1 | $29B |
|
||
| Healthcare / Medical Devices | 1 | $23B |
|
||
| Automotive Technology | 1 | $20B |
|
||
Price history
-3.8% since first listed12 events — show timeline
- 2026-05-06 Pending — MiRealSource-MiMLS
- 2026-05-06 Pending — REALCOMP
- 2026-05-04 Listed $124,900 REALCOMP
- 2026-05-04 Listed $124,900 MiRealSource-MiMLS
- 2003-08-06 Listing Removed — REALCOMP
- 2003-05-06 Listed $124,500 REALCOMP
- 2003-05-01 Listing Removed — REALCOMP
- 2003-02-23 Listed $124,900 REALCOMP
- 2003-02-03 Listing Removed — REALCOMP
- 2003-01-25 Listed $154,500 REALCOMP
- 2003-01-23 Listing Removed — REALCOMP
- 2002-09-05 Listed $129,900 REALCOMP
Property tax history
-0.3%/yrLatest (2025): $1,404 · -54.0% YoY. Source: county tax records.
Cash-flow waterfall
monthlySold comps — $/sqft
last 12 mo · ≤1 miLoading sold comps…