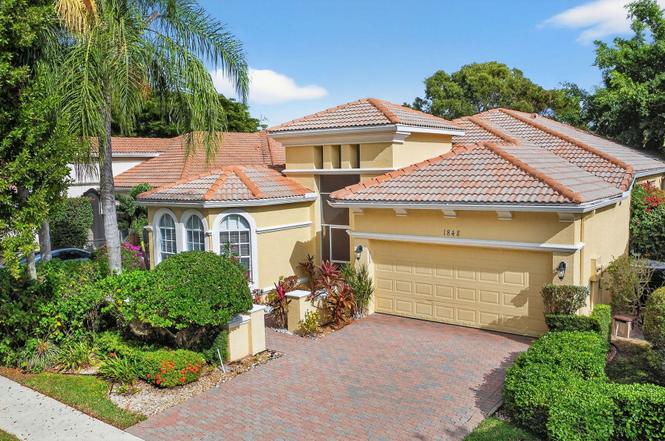
1848 Via Castello · Wellington, FL
Flood risk 1/10 · Minimal
- FEMA flood zone
- X (unshaded)
- Chance of flooding over 30 yrs
- 0.0%
- Est. flood insurance / yr
- $507 – $1,088
Fire risk 1/10 · Minimal
- Est. fire insurance / yr
- $947 – $1,759
Heat risk 9/10 · Severe
- Hot days now (above 107°F)
- 7 days/yr
- Hot days in 30 yrs
- 24 days/yr
Wind risk 10/10 · Severe
- Chance of severe wind over 30 yrs
- 99.0%
Air-quality risk 2/10 · Minimal
- Unhealthy air days now
- 0 days/yr
- Unhealthy air days in 30 yrs
- 1 days/yr
Risk factors via First Street. Map © Google.
Why this score? — see what drove the C- grade
The composite is a weighted blend of 9 inputs, each scored 0–100. Each bar is that input's sub-score; the figure is the points it added to the 100-point composite (weight × sub-score).
- ARV discount +15.0/15.0
- Appreciation +10.0/10.0
- Cash flow +7.0/30.0
- Schools +4.3/10.0
- 1% rule +3.9/10.0
- Livability +3.7/5.0
- Rent growth +2.7/5.0
- Condition / age +2.5/5.0
- DSCR +1.2/10.0
$465,000
🖨 Deal sheet (PDF) 📄 Offer letter ✓ Due diligence
Listing remarks
Stunning Ventana model . .. this beautiful home offers 2 bedrooms, a versatile den (easily used as a 3rd bedroom), 2.5 baths, & a 2-car garage--all beautifully situated on an exceptional lot w/ long-range lake & preserve view. From the moment you enter through the elegant double doors, this home is sure to impress. Upgrades include a NEW refrigerator, (2026), washer & dryer (2024) & a NEWER A/C installed in 2022, offering added comfort and peace of mind. Inside, you'll find tile flooring in the foyer, family room, & kitchen, complemented by stylish wood flooring in the living room, den, & bedrooms. Extra high-hat lighting throughout keeps every space light
Key facts
- Screened patio
- Resort style pools
- Long-range lake view
Tags
Property features AI
Finance
- Other: Senior community
- Financial info: Pets allowed (restrictions/limits may apply)
- HOA & community: Community association (monthly fee); Association amenities include clubhouse, fitness center, game room, billiard room, community room, library, cafe/restaurant, manager on site, jogging path, sidewalks, street lights, tennis courts, pickleball courts, internet included; HOA fee paid monthly
Exterior
- Parking: Attached 2-car garage with garage door opener; 2 covered parking spaces
- Security: Gated with guard
- Utilities: Public water; Public sewer; Three-phase electric; Cable available
- Home design: Single-family residence; One-story; Resale; Faces west; Gated community with guard; Living area approximately 2,364 sq ft
- Construction: Block/CBS construction; Spanish tile roof
- Exterior features: Covered patio; Screened patio; Patio; Waterfront
Interior
- Kitchen: Dishwasher; Disposal; Microwave; Refrigerator; Electric water heater
- Bedrooms: 2 main-level bedrooms
- Flooring: Laminate; Blinds on windows
- Bathrooms: 2 full bathrooms; 1 half bathroom (3 total)
- Heating & cooling: Central heating (electric); Central air conditioning (electric); Ceiling fans
- Interior features: Cathedral ceilings; Vaulted ceiling; High ceilings; Entrance foyer; Kitchen island; Walk-in closets; Split bedroom layout; Roman tub
- Laundry & utility: Laundry inside
Neighborhood map
What this means for you Summary
Snapshot
- This is a 2-bed/2.5-bath single-family listed at $465k.
Deal economics
- At list price, monthly cash flow is $-683 ($-8k/yr) — negative.
- To cash-flow at today's rent, offer at most $344k (26.0% below list).
- To meet the 1% rule (rent ≥ 1% of price), the offer needs to be $414k (10.9% below list).
- Recommended offer: $344k (26.0% below list) — sets the bar for cash-flow.
- Cap rate 4.5% vs local median 3.4% in Wellington — top-decile yield for the area; either an underpriced asset or a hidden risk that comps aren't pricing in. Stress-test before assuming the spread holds.
Location & tenants
- Location reads 73/100 on livability (#294 in FL, #4,986 nationally) — a middle-class / working-renter tenant base. Strengths: crime A+, employment A+, housing A+; Watch: amenities F, commute F, cost of living F.
- Palm Beach (suburban): math 46% / reading 53% proficiency, ranked #34 of 73 in FL (top 47%) — families likely to look elsewhere, expect single-tenant / working-renter base with shorter leases.
- Zoned schools: Equestrian Trails Elementary (math 85% / reading 83%, grade A+, #55 of 2,144 statewide, top 3%, 843 students, 20% FRL); Emerald Cove Middle School (math 61% / reading 64%, grade B+, #116 of 571 statewide, top 21%, 1,241 students, 36% FRL); Palm Beach Central High School (math 42% / reading 55%, grade D, #198 of 667 statewide, top 30%, 2,980 students, 40% FRL) — zoned schools average 32% FRL vs 52% district-wide (20 pts lower); this property's tenant base skews higher-income than the district average.
- Zoned-school proficiency averages 65% at this address vs 50% district-wide (+16 pts) — the actual schools serving this property are materially stronger than the Palm Beach average implies; a family-tenant draw the district grade alone would hide.
- Market conditions: Rents flat; 583 active listings in the ZIP; 22 comparable units currently listed for rent nearby; rentals at typical pace (median 26d on market — plan ~3-4 weeks tenant-placement turnaround); solid renter incomes; 3,974 units permitted in Palm Beach County in 2024 (1,012 in 5+ unit buildings).
Forward outlook
- In year one you build about $50k of equity ($3k loan paydown + $46k appreciation (10.0% local appreciation)).
- Palm Beach County population projected at +30% by 2050 — long-run rental-demand tailwind backs the buy-and-hold thesis.
- By year 2, paydown + projected appreciation supports a ~$80k cash-out refi (75% LTV) — recoverable capital for the next deal without selling this one.
Negotiation context
- It's been on market 192 days — a 12% lower offer ($409k) is reasonable based on typical stale-listing flexibility.
- 7 sale attempts since 11y ago; this cycle's ask has dropped $50k (10%) from the opening price — seller is motivated, your offer sets the floor, not the list.
- Current owner paid $340k; 37% above their basis — modest negotiation headroom, anchor on the comps not their cost.
Risks & watch-outs
- Climate carrying-cost: severe wind risk, 99% chance of damaging wind over 30y; extreme-heat days projected 7→24/yr by 2055 (HVAC capex compounding) — expect insurance premiums to compound above CPI over the hold.
Questions for the listing agent
- What do current leases actually rent for vs. the listed asking? Can we see a recent rent roll and the last 12 months of T-12 income?
- It's been on market 192 days. Have you received any prior offers? Is the seller open to a 26% concession, seller financing, or rate buy-down credit?
- What does the HOA fee cover, when was the last increase, and are there any pending special assessments or reserve-fund shortfalls?
- Why hasn't it sold? Are there any deal-killer items the seller is aware of (foundation, flood, title, zoning, code violations)?
- Is there a deadline driving the sale (1031 exchange, divorce, estate, relocation)? That informs how much negotiation room exists.
- Schools are A-rated — typically a magnet for longer-tenancy family renters. What's the average tenant stay here, and is there a school-zone premium baked into asking?
- What's the average days-on-market for RENTAL listings here right now (not sales)? A rising rental-DOM trend means longer vacancies and softer asking-rent achievability than the comps imply.
- What's the recent tenant-quality profile in this submarket — average credit score on applications, eviction rate, late-payment / NSF rate, and stable-employment percentage? A property-management company in the area should have these aggregated.
- How much new for-sale + rental construction is in the pipeline within 1–3 miles? Heavy new supply typically softens prices + rents 12–24 months out; constrained supply supports both.
Investment metrics
- 1% rule
- 0.89% ✗
- Cap rate
- 4.53%
- Cash-on-cash
- -6.30%
- DSCR
- 0.72
- GRM
- 9.4
CMA / ARV
- ARV (on-the-fly)
- $574,452
- Comps found
- 1
Show comp detail 1 sale within ~0.75 mi
| Address | Dist | Beds/Ba | Sqft | Sold | Price | $/sf | Match |
|---|---|---|---|---|---|---|---|
| 9676 Via Elegante | 0.20mi | 2/2.5 | 2,364 (0%) | 22mo | $575,000 | $243 | 72 |
Match score weights: distance 35% · size 25% · config 20% · recency 20%. Top-matched comps best support the ARV.
Projected returns pro-forma
10.0% appreciation · 0.85% rent growth · sell at horizon
- IRR
- 19.1%
- Equity multiple
- 2.55×
- Total profit
- $201,488
- Equity at exit
- $418,909
- IRR
- 17.2%
- Equity multiple
- 5.70×
- Total profit
- $612,305
- Equity at exit
- $903,393
Cash invested: $130,200 (down + closing). Projections, not guarantees.
Landlord ↔ Tenant lean methodology
- Overall (STATE)
- 87 Strongly Landlord-Friendly
- State Florida
- 87 Strongly Landlord-Friendly · R+3
- County
- — inherits STATE
- City
- — inherits STATE
ZIP-level market 33411
- Home prices YoY
- 1.9%
- Rents YoY
- 0.8%
- Active inventory
- 583
- Price-to-rent
- 9.4×
Monthly cashflow live
- Estimated rent
- $4,144 high interval (Pro) →
- Mortgage (P&I)
- −$2,439
- Tax from tax record
- −$527 /mo · $6,328/yr
- Insurance
- −$194
- HOA
- −$797
- Vacancy / Maint / Mgmt
- −$870
- Net cashflow
- $-683
Break-even live
Sensitivity live
| Price | -10% $-420 | -5% $-551 | +0% $-683 | +5% $-815 | +10% $-946 |
|---|---|---|---|---|---|
| Rent | -10% $-1,010 | -5% $-847 | +0% $-683 | +5% $-519 | +10% $-356 |
| Rate | -1.0pp $-449 | -0.5pp $-565 | base $-683 | +0.5pp $-804 | +1.0pp $-926 |
UW: 25.0% down · 7.5% · 30yr · 1.5% tax · 5.0% vac · 8.0% maint · 8.0% mgmt
Financing live
Cash to close
- Down payment
- $116,250
- Closing costs
- $13,950
- Reserves months
- —
- Total cash needed
- —
Loan-product check · same deal, 3 products live
Conventional
25% down · 7.5% · 30yr
- Down + closing
- —
- Monthly P&I
- —
- Monthly cashflow
- —
- DSCR
- —
- Eligible?
- —
Personal DTI + credit; lowest rate.
DSCR
20% down · 8.5% · 30yr
- Down + closing
- —
- Monthly P&I
- —
- Monthly cashflow
- —
- DSCR
- —
- Eligible?
- —
No personal income docs; deal must DSCR.
Hard money
10% down · 12.0% · 12mo
- Down + closing
- —
- Monthly P&I
- —
- Monthly cashflow
- —
- DSCR
- —
- Eligible?
- —
Short-term bridge; refi at stabilization.
Rent comps 22 comps
| Address | Beds | Baths | Sqft | Rent | $/sqft | DOM | Units | Dist |
|---|---|---|---|---|---|---|---|---|
| 1429 Stonehaven Estates Dr West Palm Beach, FL | 3.0 | 2.0 | 2729 | $2,115 | $0.78 | 7d | 1 | 0.29mi |
| 10667 Lake Shore Dr Wellington, FL | 3.0 | 2.5 | 1853 | $2,600 | $1.40 | 26d | 1 | 0.73mi |
| 1592 Carriage Brooke Dr Wellington, FL | 3.0 | 2.0 | 1662 | $3,000 | $1.81 | 26d | 1 | 0.74mi |
| 1090 Quaye Lake Cir Wellington, FL | 3.0 | 3.0 | 1719 | $3,513 | $2.04 | 16d | 1 | 0.83mi |
| 2301 Wellington Green Dr Wellington, FL | 3.0 | 2.0 | 1836 | $3,649 | $1.99 | 26d | 1 | 1.00mi |
| 137 Canterbury Pl Royal Palm Beach, FL | 3.0 | 2.5 | 1856 | $3,500 | $1.89 | 26d | 1 | 1.03mi |
| 625 Whippoorwill Ter West Palm Beach, FL | 3.0 | 2.0 | 1914 | $4,500 | $2.35 | 26d | 1 | 1.07mi |
| 2899 Florence St Wellington, FL | 3.0 | 2.0 | 2459 | $9,500 | $3.86 | 26d | 1 | 1.16mi |
| 1451 Pioneer Way Royal Palm Beach, FL | 3.0 | 2.5 | 1900 | $4,750 | $2.50 | 23d | 1 | 1.23mi |
| 1853 Shower Tree Way Wellington, FL | 3.0 | 2.0 | 2032 | $4,600 | $2.26 | 1d | 1 | 1.24mi |
| 1853 Shower Tree Way Wellington, FL | 3.0 | 2.0 | 2032 | $4,600 | $2.26 | 7d | 1 | 1.24mi |
| 1853 Shower Tree Way Wellington, FL | 3.0 | 2.0 | 2032 | $4,600 | $2.26 | 26d | 1 | 1.24mi |
| 2405 Shoma Dr Royal Palm Beach, FL | 3.0 | 3.5 | 1932 | $2,375 | $1.23 | 4d | 1 | 1.36mi |
| 3808 Shoma Dr Unit 3808 West Palm Beach, FL | 3.0 | 3.0 | 2300 | $2,300 | $1.00 | 26d | 1 | 1.37mi |
| 3515 Shoma Dr Unit 3515 West Palm Beach, FL | 3.0 | 3.5 | 1815 | $3,250 | $1.79 | 26d | 1 | 1.37mi |
| 2320 Las Casitas Dr Wellington, FL | 2.0 | 2.0 | 1665 | $4,500 | $2.70 | 26d | 1 | 1.42mi |
| 8270 Eleuthera Ln Wellington, FL | 2.0 | 2.0 | 1680 | $3,250 | $1.93 | 23d | 1 | 1.43mi |
| 8457 Xanthus Ln Wellington, FL | 3.0 | 3.0 | 2001 | $4,350 | $2.17 | 26d | 1 | 1.43mi |
| 11297 Pine Valley Dr Wellington, FL | 3.0 | 2.0 | 1705 | $3,500 | $2.05 | 26d | 1 | 1.46mi |
| 4127 Siena Cir Wellington, FL | 3.0 | 3.0 | 2561 | $9,600 | $3.75 | 9d | 1 | 1.46mi |
| 4127 Siena Cir Wellington, FL | 3.0 | 3.0 | 2561 | $9,600 | $3.75 | 1d | 1 | 1.46mi |
| 8262 Dominica Pl Wellington, FL | 3.0 | 2.0 | 2001 | $4,000 | $2.00 | 26d | 1 | 1.49mi |
HOA detail
- Monthly dues
- $797 · $9,564/yr
Listing history 45 events
-
2026-06-21remarks 675-char remark
-
2026-06-21days on market $465,000 Active 192 DOM
-
2026-06-18days on market $465,000 Active 189 DOM
-
2026-06-17days on market $465,000 Active 188 DOM
-
2026-06-16days on market $465,000 Active 187 DOM
-
2026-06-15days on market $465,000 Active 186 DOM
-
2026-06-13days on market $465,000 Active 184 DOM
-
2026-06-09days on market $465,000 Active 180 DOM
-
2026-06-07days on market $465,000 Active 178 DOM
-
2026-06-04days on market $465,000 Active 175 DOM
-
2026-06-03days on market $465,000 Active 174 DOM
-
2026-06-01days on market $465,000 Active 172 DOM
-
2026-05-31days on market $465,000 Active 171 DOM
-
2026-05-12price $465,000
-
2026-04-13price $469,900
-
2026-03-03price $475,000
-
2026-02-16price $492,000
-
2025-12-11$515,000 Active
-
2025-09-09historical
-
2025-08-22status Active
-
2025-08-06price $549,500
-
2025-08-06historical
-
2025-07-28price $499,500
-
2025-07-08price $529,000
-
2025-06-14price $519,000
-
2025-03-28price $549,000
-
2025-02-24price $570,000
-
2025-01-02$595,000 Active
-
2024-12-25historical
-
2024-11-02price $599,000
-
2024-10-17price $619,900
-
2024-08-18price $629,900
-
2024-07-26price $649,000
-
2024-06-26$649,900 Active
-
2017-05-19soldstatus $340,000
-
2017-05-15soldstatus $340,000 Closed
-
2017-04-21status Pending
-
2017-04-12status Active
-
2017-03-26historical Active Under Contract
-
2016-12-09price $350,000
-
2016-11-19$360,000 Active
-
2016-06-01historical
-
2015-12-09price $367,500
-
2015-12-09price $360,000
-
2015-11-17$379,000 Active
ⓘ Source: listings_history table (triggers on properties + properties_extension) + one-shot
backfill from property_details.listing_events for pre-trigger history.
Tax reassessment forecast FL · Resets to sale price
- Current annual tax
- $6,328 · $527/mo
- Projected year-2 tax
- $6,328 · $527/mo
- Expected delta
- $0/yr ($0/mo · 0.0%)
ⓘ Screening estimate from a state-policy table — verify with the county assessor before closing.
Climate risk First Street
- Flood 1/10 Low FEMA zone X (unshaded) · 0% chance over 30 yrs
- Wildfire 1/10 Low
- Heat 9/10 Extreme 7 d/yr ≥107°F today · 24 d/yr by 30 yrs out
- Wind 10/10 Extreme 99% chance of damaging wind over 30 yrs
- Air quality 2/10 Low 0 unhealthy d/yr today · 1 by 30 yrs out
Nearby sold comps map
Loading sold comps map…
Walkable amenities ~0.75 mi
Loading nearby amenities…
Taxation est. · year 1
- Rental income
- $49,724
- − Mortgage interest
- −$26,047
- − Property taxes
- −$6,328
- − Insurance
- −$2,325
- − Repairs & maintenance
- −$3,978
- − Management
- −$3,978
- − HOA
- −$9,564
- − Depreciation
- −$13,527
- Taxable loss
- −$16,023
- Est. tax savings @ 24.0%
- +$3,846
- After-tax cash flow
- $-4,352/yr
For passive investors: Depreciation is non-cash, so a rental often shows a tax loss while cash-flowing — sheltering income. Rental losses are passive: they offset passive income freely, and up to $25,000/yr can offset ordinary (W-2) income if you actively participate and your MAGI is under $100k (phasing out to $0 by $150k); unused losses carry forward. On sale, claimed depreciation is recaptured at up to 25%, and gains may owe capital-gains tax (a 1031 exchange can defer both). Figures are a year-1 estimate at your 24.0% rate — not tax advice; consult a CPA.
Schools (NCES district)
- District
- Palm Beach
- NCES district ID
- 1201500
- Math proficiency
- 46% ▼ -16.00%
- Reading proficiency
- 53% ▼ -4.00%
- Median HH income
- $53,943
- Composite
- 42.72/100
- National rank
- #3160
- State rank
- #34 of 73 in FL
Livability — Wellington
- Score
- 73/100
- State rank
- #294
- US rank
- #4986
Category grades
Schools grade is shown separately in the Schools card above.
Census & demographics
- Census place
- Wellington, FL
- County
- Palm Beach County · 1,438,312 people
- City population
- 222,012
- Metro
- Miami-Fort Lauderdale-Pompano Beach, FL
- Population (ZIP)
- 76,863
- Household income
- $92,591
- Rent vs Own
- Severe rent burden
- 1870.0
Population outlook (Palm Beach County) Hauer SSP2
- Today (2025)
- 1,637,487 people
- By 2030
- 1,743,255 · +6.5%
- By 2040
- 1,948,712 · +19.0%
- By 2050
- 2,132,979 · +30.3%
- By 2075
- 2,530,027 · +54.5%
- By 2100
- 2,706,979 · +65.3%
Race, ethnicity, and origin ACS 2023
- Neighborhood character
- Diverse neighborhood (Simpson 0.70)
- Race & ethnicity
- White 44% Hispanic / Latino 24% Black 23% Two or more races 16% Asian 5%
- Hispanic origin (detail)
- Mexican 2% Puerto Rican 5% Cuban 4% Dominican 2%
- Common ancestry
- Hispanic 6% Romanian 2% Italian 1%
- Foreign-born
- 26% · Canada, Jamaica, China
- Languages at home
- 73% English-only · Spanish 17% French/Haitian/Cajun 4% Other Indo-European 2%
Political lean MEDSL · Palm Beach
- 2024 margin
- Toss-up / Even · D 50.0% · R 49.2%
- 2008→2024 swing
- -22.1pp toward R · 2008: 22.9pp · 2024: 0.8pp
- All cycles
- 2024: D+0.8 2020: D+12.8 2016: D+15.3 2012: D+17.0 2008: D+22.9
Not yet ingested
- Civics
- —
Market trends
- HPI YoY
- ▲ 17.04%
- Current HPI
- 903.78
- Rent YoY
- ▲ 0.85%
- Metro
- Miami-Fort Lauderdale-Pompano Beach, FL
- State GDP YoY
- ▲ 3.28%
- F500 in state
- 36
Industry mix (Fortune 500 HQ in FL)
| Industry | F500 HQs | Revenue |
|---|---|---|
| Industrial Technology | 2 | $29B |
|
||
| Insurance | 2 | $17B |
|
||
| Retail | 1 | $60B |
|
||
| Technology Distribution | 1 | $58B |
|
||
| Homebuilding | 1 | $35B |
|
||
| Technology Manufacturing | 1 | $35B |
|
||
Price history
+22.7% since first listed32 events — show timeline
- 2026-05-12 Price Changed $465,000 Beaches MLS
- 2026-04-13 Price Changed $469,900 Beaches MLS
- 2026-03-03 Price Changed $475,000 Beaches MLS
- 2026-02-16 Price Changed $492,000 Beaches MLS
- 2025-12-11 Listed $515,000 Beaches MLS
- 2025-09-09 Listing Removed — Beaches MLS
- 2025-08-22 Relisted — Beaches MLS
- 2025-08-06 Listing Removed — Beaches MLS
- 2025-08-06 Price Changed $549,500 Beaches MLS
- 2025-07-28 Price Changed $499,500 Beaches MLS
- 2025-07-08 Price Changed $529,000 Beaches MLS
- 2025-06-14 Price Changed $519,000 Beaches MLS
- 2025-03-28 Price Changed $549,000 Beaches MLS
- 2025-02-24 Price Changed $570,000 Beaches MLS
- 2025-01-02 Listed $595,000 Beaches MLS
- 2024-12-25 Listing Removed — Beaches MLS
- 2024-11-02 Price Changed $599,000 Beaches MLS
- 2024-10-17 Price Changed $619,900 Beaches MLS
- 2024-08-18 Price Changed $629,900 Beaches MLS
- 2024-07-26 Price Changed $649,000 Beaches MLS
- 2024-06-26 Listed $649,900 Beaches MLS
- 2017-05-19 Sold (Public Records) $340,000 Public Records
- 2017-05-15 Sold (MLS) $340,000 Beaches MLS
- 2017-04-21 Pending — Beaches MLS
- 2017-04-12 Relisted — Beaches MLS
- 2017-03-26 Contingent — Beaches MLS
- 2016-12-09 Price Changed $350,000 Beaches MLS
- 2016-11-19 Listed $360,000 Beaches MLS
- 2016-06-01 Listing Removed — Beaches MLS
- 2015-12-09 Price Changed $360,000 Beaches MLS
- 2015-12-09 Price Changed $367,500 Beaches MLS
- 2015-11-17 Listed $379,000 Beaches MLS
Property tax history
+1.1%/yrLatest (2025): $6,328 · +3.2% YoY. Source: county tax records.
Cash-flow waterfall
monthlySold comps — $/sqft
last 12 mo · ≤1 miLoading sold comps…