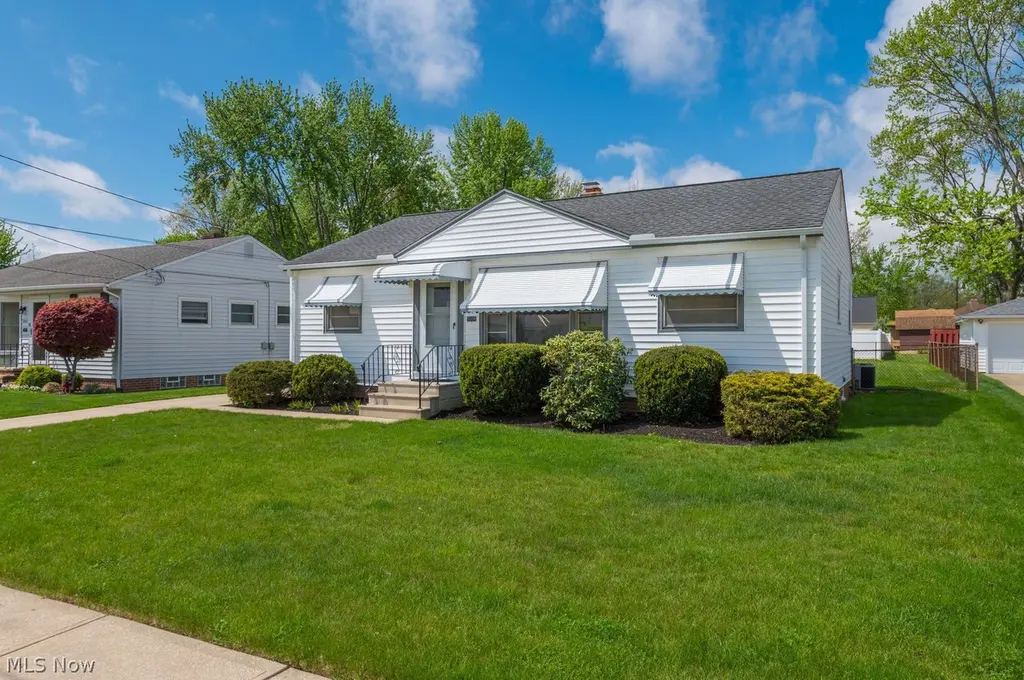
6456 Anita Dr · Parma Heights, OH
Flood risk 1/10 · Minimal
- FEMA flood zone
- X (unshaded)
- Chance of flooding over 30 yrs
- 0.0%
- Est. flood insurance / yr
- $473 – $860
Fire risk 1/10 · Minimal
- Est. fire insurance / yr
- $713 – $1,323
Heat risk 3/10 · Minor
- Hot days now (above 95°F)
- 7 days/yr
- Hot days in 30 yrs
- 17 days/yr
Wind risk 1/10 · Minimal
- Chance of severe wind over 30 yrs
- —
Air-quality risk 2/10 · Minimal
- Unhealthy air days now
- 1 days/yr
- Unhealthy air days in 30 yrs
- 3 days/yr
Risk factors via First Street. Map © Google.
Why this score? — see what drove the D grade
The composite is a weighted blend of 9 inputs, each scored 0–100. Each bar is that input's sub-score; the figure is the points it added to the 100-point composite (weight × sub-score).
- ARV discount +12.3/15.0
- Cash flow +10.9/30.0
- Schools +4.1/10.0
- Livability +3.6/5.0
- 1% rule +3.5/10.0
- DSCR +3.2/10.0
- Rent growth +3.2/5.0
- Condition / age +2.5/5.0
- Appreciation +0.0/10.0
$210,000
🖨 Deal sheet (PDF) 📄 Offer letter ✓ Due diligence
Listing remarks
Welcome to 6456 Anita Dr, nestled on a serene, well-kept street in Parma Heights! This charming ranch home greets you with a spacious living room featuring gorgeous hardwood floors and natural light streaming through a large picture window. Fresh paint and beautiful hardwood flooring continue throughout the main level, which offers 3 comfortable bedrooms and a full bath. One bedroom conveniently includes a washer and dryer setup, providing flexible living options. The galley-style eat-in kitchen comes equipped with a newer refrigerator and stove (2023/2024). Downstairs, you’ll find a full basement that is clean, dry, and enhanced with glass block windows—perfect for additional s
Key facts
- Full basement
- Glass block windows
- Covered patio
Tags
Neighborhood map
What this means for you Summary
Snapshot
- This is a 3-bed/1.0-bath single-family listed at $210k.
Deal economics
- At list price, monthly cash flow is $-91 ($-1k/yr) — negative.
- To cash-flow at today's rent, offer at most $194k (7.6% below list).
- To meet the 1% rule (rent ≥ 1% of price), the offer needs to be $180k (14.5% below list).
- Recommended offer: $180k (14.5% below list) — sets the bar for 1% rule.
Location & tenants
- Location reads 72/100 on livability (#362 in OH) — a middle-class / working-renter tenant base. Strengths: crime A+, cost of living A+, housing A+; Watch: employment C-, amenities D-, commute F.
- Parma City (suburban): math 43% / reading 52% proficiency, ranked #469 of 656 in OH (top 72%) — families likely to look elsewhere, expect single-tenant / working-renter base with shorter leases.
- Zoned schools: Parma Park Elementary School (math 42% / reading 52%, grade D-, #942 of 1,584 statewide, top 61%, 244 students, 53% FRL); Greenbriar Middle School (math 39% / reading 50%, grade D, #477 of 654 statewide, top 74%, 800 students, 61% FRL); Valley Forge High School (math 32% / reading 44%, grade F, #560 of 781 statewide, top 72%, 1,409 students, 52% FRL).
- Market conditions: Rents rising (+2.7%/yr); 153 active listings in the ZIP; 18 comparable units currently listed for rent nearby; rentals leasing fast (median 4d on market — plan ~1-2 weeks tenant-placement turnaround); 1,441 units permitted in Cuyahoga County in 2024 (700 in 5+ unit buildings).
- This rent runs 31% of the median local income ($70k/yr) — at the standard rent-burdened threshold; future hikes will face affordability resistance.
Forward outlook
- Local home prices are declining (-3.0%/yr); year-one equity from $1k of loan paydown is wiped out by about $6k of value loss. Plan a longer hold.
- Cuyahoga County population projected to shrink 8% by 2050 — rents likely to lag national; underwrite the cash flow, not the appreciation.
Negotiation context
- Only 3 days on market — expect competitive offers; lowballing is unlikely to land.
Risks & watch-outs
- Watch-outs: built in 1956 — expect roof / HVAC / electrical / plumbing capex.
Questions for the listing agent
- What do current leases actually rent for vs. the listed asking? Can we see a recent rent roll and the last 12 months of T-12 income?
- Built in 1956 — when were the roof, HVAC, electrical panel, plumbing, and water heater last replaced?
- Is there a deadline driving the sale (1031 exchange, divorce, estate, relocation)? That informs how much negotiation room exists.
- Schools are B-rated — typically a magnet for longer-tenancy family renters. What's the average tenant stay here, and is there a school-zone premium baked into asking?
- The area grade is low — what's the realistic commute time and amenity access for the typical tenant pool here? Any planned neighborhood developments (good or bad) we should know about?
- What's the average days-on-market for RENTAL listings here right now (not sales)? A rising rental-DOM trend means longer vacancies and softer asking-rent achievability than the comps imply.
- What's the recent tenant-quality profile in this submarket — average credit score on applications, eviction rate, late-payment / NSF rate, and stable-employment percentage? A property-management company in the area should have these aggregated.
- How much new for-sale + rental construction is in the pipeline within 1–3 miles? Heavy new supply typically softens prices + rents 12–24 months out; constrained supply supports both.
Investment metrics
- 1% rule
- 0.85% ✗
- Cap rate
- 5.78%
- Cash-on-cash
- -1.85%
- DSCR
- 0.92
- GRM
- 9.7
CMA / ARV
- ARV (median comp)
- $234,974
- List price
- $210,000
- Delta
- -10.63%
- Verdict
- UNDERPRICED
- Comps
- 20 within 1.0 mi
Show comp detail 12 sales within ~0.75 mi
| Address | Dist | Beds/Ba | Sqft | Sold | Price | $/sf | Match |
|---|---|---|---|---|---|---|---|
| 6456 Anita Dr | 0.00mi | 3/1.0 | 1,064 (0%) | 1mo | $220,000 | $207 | 99 |
| 6469 Anita Dr | 0.04mi | 3/2.0 | 1,064 (0%) | 1mo | $220,000 | $207 | 94 |
| 6483 Fernhurst Ave | 0.07mi | 3/2.5 | 1,102 (+4%) | 0mo | $280,000 | $254 | 85 |
| 6568 Lawnwood Ave | 0.27mi | 3/2.0 | 1,064 (0%) | 3mo | $267,000 | $251 | 81 |
| 6369 Anita Dr | 0.17mi | 3/1.5 | 1,140 (+7%) | 4mo | $225,000 | $197 | 75 |
| 6333 W 130th St | 0.28mi | 3/2.0 | 1,031 (-3%) | 3mo | $233,800 | $227 | 75 |
| 6280 Mariana Dr | 0.32mi | 3/1.5 | 1,124 (+6%) | 5mo | $265,000 | $236 | 70 |
| 6657 Orchard Blvd | 0.49mi | 3/2.0 | 1,080 (+2%) | 5mo | $215,000 | $199 | 67 |
| 13375 Kathleen Dr | 0.29mi | 3/2.5 | 1,176 (+10%) | 2mo | $256,000 | $218 | 61 |
| 6788 Orchard Blvd | 0.68mi | 3/1.0 | 944 (-11%) | 1mo | $241,500 | $256 | 48 |
| 6750 Commonwealth Blvd | 0.67mi | 3/1.0 | 1,185 (+11%) | 2mo | $223,500 | $189 | 48 |
| 6833 Maplewood Rd | 0.71mi | 3/1.5 | 1,170 (+10%) | 1mo | $220,000 | $188 | 48 |
Match score weights: distance 35% · size 25% · config 20% · recency 20%. Top-matched comps best support the ARV.
Projected returns pro-forma
-3.0% appreciation · 2.69% rent growth · sell at horizon
- IRR
- -19.7%
- Equity multiple
- 0.31×
- Total profit
- $-40,294
- Equity at exit
- $31,312
- IRR
- -13.1%
- Equity multiple
- 0.24×
- Total profit
- $-44,538
- Equity at exit
- $18,157
Cash invested: $58,800 (down + closing). Projections, not guarantees.
Landlord ↔ Tenant lean methodology
- Overall (STATE)
- 73 Landlord-Friendly
- State Ohio
- 73 Landlord-Friendly · R+6
- County
- — inherits STATE
- City
- — inherits STATE
ZIP-level market 44130
- Rents YoY
- 2.7%
- Active inventory
- 153
- Price-to-rent
- 9.7×
Monthly cashflow live
- Estimated rent
- $1,795 high interval (Pro) →
- Mortgage (P&I)
- −$1,101
- Tax from tax record
- −$320 /mo · $3,843/yr
- Insurance
- −$88
- HOA
- −$0
- Vacancy / Maint / Mgmt
- −$377
- Net cashflow
- $-91
Break-even live
Sensitivity live
| Price | -10% $28 | -5% $-31 | +0% $-91 | +5% $-150 | +10% $-209 |
|---|---|---|---|---|---|
| Rent | -10% $-232 | -5% $-161 | +0% $-91 | +5% $-20 | +10% $51 |
| Rate | -1.0pp $15 | -0.5pp $-37 | base $-91 | +0.5pp $-145 | +1.0pp $-200 |
UW: 25.0% down · 7.5% · 30yr · 1.5% tax · 5.0% vac · 8.0% maint · 8.0% mgmt
Financing live
Cash to close
- Down payment
- $52,500
- Closing costs
- $6,300
- Reserves months
- —
- Total cash needed
- —
Loan-product check · same deal, 3 products live
Conventional
25% down · 7.5% · 30yr
- Down + closing
- —
- Monthly P&I
- —
- Monthly cashflow
- —
- DSCR
- —
- Eligible?
- —
Personal DTI + credit; lowest rate.
DSCR
20% down · 8.5% · 30yr
- Down + closing
- —
- Monthly P&I
- —
- Monthly cashflow
- —
- DSCR
- —
- Eligible?
- —
No personal income docs; deal must DSCR.
Hard money
10% down · 12.0% · 12mo
- Down + closing
- —
- Monthly P&I
- —
- Monthly cashflow
- —
- DSCR
- —
- Eligible?
- —
Short-term bridge; refi at stabilization.
Rent comps 18 comps
| Address | Beds | Baths | Sqft | Rent | $/sqft | DOM | Units | Dist |
|---|---|---|---|---|---|---|---|---|
| 6500 Beverly Dr Cleveland, OH | 3.0 | 1.5 | 1341 | $2,300 | $1.72 | 25d | 1 | 0.20mi |
| 6536 Lawnwood Ave Unit 1496105P Parma Heights, OH | 3.0 | 2.0 | 1087 | $6,186 | $5.69 | 3d | 1 | 0.20mi |
| 6558 Lawnwood Ave Cleveland, OH | 3.0 | 2.0 | 1331 | $2,100 | $1.58 | 0d | 1 | 0.23mi |
| 6333 W 130th St Cleveland, OH | 3.0 | 2.0 | 1020 | $2,000 | $1.96 | 45d | 1 | 0.29mi |
| 6771 Greenleaf Ave Unit 1496046P Parma Heights, OH | 3.0 | 2.0 | 1323 | $4,874 | $3.68 | 3d | 1 | 0.59mi |
| 6340 Stumph Rd Cleveland, OH | 1.0–2.0 | 1.0–1.5 | 730 | $1,150 | $1.58 | 45d | 1 | 0.61mi |
| 6240 Stumph Rd Parma Heights, OH | 2.0 | 1.0 | 622 | $1,310 | $2.10 | 0d | 10 | 0.62mi |
| 6128 Stumph Rd Cleveland, OH | 1.0–2.0 | 1.0–2.0 | 940 | $1,854 | $1.97 | 0d | 8 | 0.79mi |
| 6040 Stumph Rd Cleveland, OH | 2.0–3.0 | 1.0–1.5 | 981 | $1,140 | $1.16 | 45d | 1 | 0.89mi |
| 6260 Pearl Rd Cleveland, OH | 1.0–2.0 | 1.0–2.0 | 950 | $1,465 | $1.54 | 3d | 17 | 0.94mi |
| 6987 Greenleaf Ave Cleveland, OH | 4.0 | 1.0 | 1250 | $1,950 | $1.56 | 0d | 1 | 0.99mi |
| 11540 Apache Dr Parma Heights, OH | 2.0–3.0 | 1.0–2.0 | 1232 | $2,070 | $1.68 | 0d | 22 | 1.00mi |
| 7048 Oakwood Rd Cleveland, OH | 3.0 | 1.0 | 1053 | $1,900 | $1.80 | 12d | 1 | 1.08mi |
| 7046 Greenleaf Ave Cleveland, OH | 3.0 | 1.0 | 1200 | $1,950 | $1.62 | 45d | 1 | 1.09mi |
| 7085 W 130th St Cleveland, OH | 2.0 | 2.0 | 1150 | $1,440 | $1.25 | 0d | 6 | 1.13mi |
| 7072 Oakwood Rd Cleveland, OH | 3.0 | 1.0 | 1053 | $1,800 | $1.71 | 0d | 1 | 1.13mi |
| 6935 York Rd Parma Heights, OH | 1.0–2.0 | 1.0 | 642 | $1,055 | $1.64 | 0d | 11 | 1.41mi |
| 5691 Chevrolet Blvd Parma, OH | 1.0–2.0 | 1.0 | 700 | $995 | $1.42 | 45d | 1 | 1.49mi |
Listing history 2 events
-
2026-05-03status Pending 1217-char remark
-
2026-04-30$210,000 Active 1217-char remark
ⓘ Source: listings_history table (triggers on properties + properties_extension) + one-shot
backfill from property_details.listing_events for pre-trigger history.
Tax reassessment forecast OH · Partial reset (capped growth)
- Current annual tax
- $3,843 · $320/mo
- Projected year-2 tax
- $3,843 · $320/mo
- Expected delta
- $0/yr ($0/mo · 0.0%)
ⓘ Screening estimate from a state-policy table — verify with the county assessor before closing.
Climate risk First Street
- Flood 1/10 Low FEMA zone X (unshaded) · 0% chance over 30 yrs
- Wildfire 1/10 Low
- Heat 3/10 Moderate 7 d/yr ≥95°F today · 17 d/yr by 30 yrs out
- Wind 1/10 Low
- Air quality 2/10 Low 1 unhealthy d/yr today · 3 by 30 yrs out
Nearby sold comps map
Loading sold comps map…
Walkable amenities ~0.75 mi
Loading nearby amenities…
Taxation est. · year 1
- Rental income
- $21,545
- − Mortgage interest
- −$11,763
- − Property taxes
- −$3,843
- − Insurance
- −$1,050
- − Repairs & maintenance
- −$1,724
- − Management
- −$1,724
- − Depreciation
- −$6,109
- Taxable loss
- −$4,667
- Est. tax savings @ 24.0%
- +$1,120
- After-tax cash flow
- $33/yr
For passive investors: Depreciation is non-cash, so a rental often shows a tax loss while cash-flowing — sheltering income. Rental losses are passive: they offset passive income freely, and up to $25,000/yr can offset ordinary (W-2) income if you actively participate and your MAGI is under $100k (phasing out to $0 by $150k); unused losses carry forward. On sale, claimed depreciation is recaptured at up to 25%, and gains may owe capital-gains tax (a 1031 exchange can defer both). Figures are a year-1 estimate at your 24.0% rate — not tax advice; consult a CPA.
Schools (NCES district)
- District
- Parma City
- NCES district ID
- 3904463
- Math proficiency
- 43% ▼ -18.00%
- Reading proficiency
- 52% ▼ -10.00%
- Median HH income
- $50,371
- Composite
- 40.72/100
- National rank
- #3662
- State rank
- #469 of 656 in OH
Livability — Parma Heights
- Score
- 72/100
- State rank
- #362
- US rank
- #5875
Category grades
Schools grade is shown separately in the Schools card above.
Census & demographics
- Census place
- Parma Heights, OH
- County
- Cuyahoga County · 1,090,369 people
- City population
- 49,679
- Metro
- Cleveland-Elyria, OH
- Population (ZIP)
- 49,679
- Household income
- $69,655
- Rent vs Own
- Severe rent burden
- 1758.0
Population outlook (Cuyahoga County) Hauer SSP2
- Today (2025)
- 1,244,621 people
- By 2030
- 1,230,093 · -1.2%
- By 2040
- 1,189,108 · -4.5%
- By 2050
- 1,145,706 · -7.9%
- By 2075
- 1,076,557 · -13.5%
- By 2100
- 978,987 · -21.3%
Race, ethnicity, and origin ACS 2023
- Neighborhood character
- Predominantly White (78%)
- Race & ethnicity
- White 78% Black 8% Hispanic / Latino 6% Two or more races 6% Asian 4%
- Hispanic origin (detail)
- Mexican 2% Puerto Rican 3%
- Common ancestry
- Romanian 13% Lithuanian 2% Subsaharan African 2%
- Foreign-born
- 10% · Canada, India
- Languages at home
- 85% English-only · Other Indo-European 5% Spanish 3% Russian/Polish/Slavic 2%
Political lean MEDSL · Cuyahoga
- 2024 margin
- Solid D (+31.5) · D 65.4% · R 33.9%
- 2008→2024 swing
- -7.4pp toward R · 2008: 38.9pp · 2024: 31.5pp
- All cycles
- 2024: D+31.5 2020: D+34.1 2016: D+35.0 2012: D+38.7 2008: D+38.9
Not yet ingested
- Civics
- —
Market trends
- HPI YoY
- ▼ -231.10%
- Current HPI
- 188.8415
- Rent YoY
- ▲ 2.69%
- Metro
- Cleveland-Elyria, OH
- State GDP YoY
- ▲ 1.98%
- F500 in state
- 48
Industry mix (Fortune 500 HQ in OH)
| Industry | F500 HQs | Revenue |
|---|---|---|
| Insurance | 3 | $145B |
|
||
| Industrial Machinery | 3 | $49B |
|
||
| Financial Services | 3 | $24B |
|
||
| Consumer Goods | 2 | $93B |
|
||
| Aerospace / Defense | 2 | $47B |
|
||
| Utilities | 2 | $33B |
|
||
Price history
+4.8% since first listed3 events — show timeline
- 2026-06-01 Sold (MLS) $220,000 MLSNOW
- 2026-05-03 Pending — MLSNOW
- 2026-04-30 Listed $210,000 MLSNOW
Property tax history
+6.2%/yrLatest (2025): $3,843 · -5.7% YoY. Source: county tax records.
Cash-flow waterfall
monthlySold comps — $/sqft
last 12 mo · ≤1 miLoading sold comps…