12 Homestead Ln · Ranson, WV
Flood risk 1/10 · Minimal
- FEMA flood zone
- X (unshaded)
- Chance of flooding over 30 yrs
- 0.0%
- Est. flood insurance / yr
- $473 – $860
Fire risk 2/10 · Minimal
- Est. fire insurance / yr
- $787 – $1,461
Heat risk 5/10 · Moderate
- Hot days now (above 103°F)
- 7 days/yr
- Hot days in 30 yrs
- 16 days/yr
Wind risk 2/10 · Minimal
- Chance of severe wind over 30 yrs
- 3.0%
Air-quality risk 2/10 · Minimal
- Unhealthy air days now
- 1 days/yr
- Unhealthy air days in 30 yrs
- 1 days/yr
Risk factors via First Street. Map © Google.
Why this score? — see what drove the D grade
The composite is a weighted blend of 9 inputs, each scored 0–100. Each bar is that input's sub-score; the figure is the points it added to the 100-point composite (weight × sub-score).
- ARV discount +10.2/15.0
- Appreciation +10.0/10.0
- Cash flow +7.9/30.0
- Schools +3.4/10.0
- Livability +3.3/5.0
- Rent growth +2.5/5.0
- Condition / age +2.5/5.0
- DSCR +2.0/10.0
- 1% rule +1.3/10.0
$320,000
🖨 Deal sheet 📄 Offer letter ✓ Due diligence
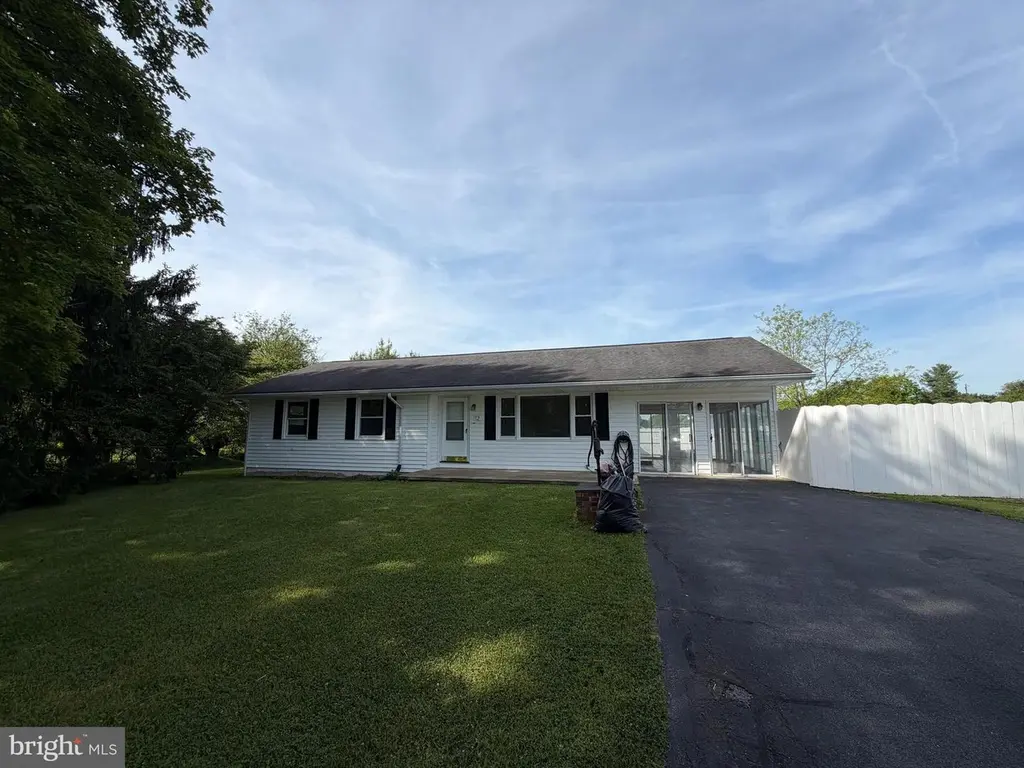
Listing remarks MLS
REDUCED BY $65,000. FOR QUICK SALE. "AS IS"Spacious rancher with hardwood floors throughout, formal dining room, equipped kitchen, beautiful florida room off kitchen leading to 18x36 inground pool and large patio. Basement is 90% finished into rec room with ceramic tiled bar area, and full bath. Two car detached garage. 20x12 workshop. 3/4 acre level lot. Minutes from Charles Town.
Key facts
- 0.52 acre lot
- 2 garage spots
- Pool
Property features AI
Exterior
- Parking: Detached 2-car garage with garage door opener; Asphalt driveway; Two total garage/parking spaces
- Utilities: Well water; Septic system; 120/240V electrical service; Cable available; Fiber optic and cable internet; Electric hot water
- Home design: Detached property; Level entry at main; Estimated year built; Above and below grade finished living areas
- Construction: Vinyl siding exterior; Architectural shingle roof; Block foundation
- Exterior features: Patio(s); Porch(es); Cleared lot; Cul-de-sac location; Landscaping; Personal in-ground pool
Interior
- Kitchen: Microwave; Wall oven; Cooktop; Refrigerator; Exhaust fan
- Basement: Full, partially finished basement with connecting stairway; Basement includes laundry and workshop areas
- Bedrooms: Three main-level bedrooms; Additional bedroom(s) listed (includes Bedroom 6) — multiple bedroom spaces across levels
- Flooring: Hardwood; Carpet; Ceramic tile; Luxury vinyl plank
- Bathrooms: Two full bathrooms (one on main level, one on lower level)
- Fireplace: One freestanding wood-burning fireplace
- Heating & cooling: Central heating; Heat pump(s); Electric heating fuel; Central A/C; Ceiling fans
- Interior features: Dining area; Built-in shelving/storage; Window treatments; Wood floors; Traditional floor plan; Drywall walls and ceilings; Sliding glass door
- Laundry & utility: Washer and dryer included; Washer/Dryer hookups (basement laundry)
Neighborhood map
What this means for you Summary
Snapshot
- This is a 3-bed/2.0-bath single-family listed at $320k.
Deal economics
- At list price, monthly cash flow is $-337 ($-4k/yr) — negative.
- To cash-flow at today's rent, offer at most $260k (18.6% below list).
- To meet the 1% rule (rent ≥ 1% of price), the offer needs to be $202k (36.8% below list).
- Recommended offer: $202k (36.8% below list) — sets the bar for 1% rule.
- Cap rate 5.0% vs local median 3.8% in Ranson — top-decile yield for the area; either an underpriced asset or a hidden risk that comps aren't pricing in. Stress-test before assuming the spread holds.
Location & tenants
- Location reads 66/100 on livability (#100 in WV) — a middle-class / working-renter tenant base. Strengths: crime A+, housing A+, cost of living A-; Watch: schools F, amenities F, commute F.
- Jefferson County Schools (rural): math 29% / reading 46% proficiency, ranked #6 of 55 in WV (top 11%) — families likely to look elsewhere, expect single-tenant / working-renter base with shorter leases.
- Market conditions: 311 active listings in the ZIP; solid renter incomes; 1,162 units permitted in Jefferson County in 2024 (360 in 5+ unit buildings).
Forward outlook
- In year one you build about $34k of equity ($2k loan paydown + $32k appreciation (10.0% local appreciation)).
- Jefferson County population projected at +13% by 2050 — modest demand growth; plan on rents tracking national, not racing it.
- By year 2, paydown + projected appreciation supports a ~$55k cash-out refi (75% LTV) — recoverable capital for the next deal without selling this one.
Negotiation context
- Only 1 days on market — expect competitive offers; lowballing is unlikely to land.
- 2 sale attempts since 20y ago; this cycle's ask is 60% above the opening price — seller raised mid-cycle; expect resistance to lowballs.
- Current owner paid $200k; list at $320k implies a 60% gain — meaningful room to come down on a strong offer.
Risks & watch-outs
- Climate carrying-cost: extreme-heat days projected 7→16/yr by 2055 (HVAC capex compounding) — expect insurance premiums to compound above CPI over the hold.
Questions for the listing agent
- What do current leases actually rent for vs. the listed asking? Can we see a recent rent roll and the last 12 months of T-12 income?
- Built in 1969 — when were the roof, HVAC, electrical panel, plumbing, and water heater last replaced?
- Is there a deadline driving the sale (1031 exchange, divorce, estate, relocation)? That informs how much negotiation room exists.
- Schools are F-rated, which usually means shorter tenancies and higher turnover. Who's the typical renter profile here, and what's been the actual vacancy rate?
- The area grade is low — what's the realistic commute time and amenity access for the typical tenant pool here? Any planned neighborhood developments (good or bad) we should know about?
- What's the average days-on-market for RENTAL listings here right now (not sales)? A rising rental-DOM trend means longer vacancies and softer asking-rent achievability than the comps imply.
- What's the recent tenant-quality profile in this submarket — average credit score on applications, eviction rate, late-payment / NSF rate, and stable-employment percentage? A property-management company in the area should have these aggregated.
- How much new for-sale + rental construction is in the pipeline within 1–3 miles? Heavy new supply typically softens prices + rents 12–24 months out; constrained supply supports both.
Investment metrics
- 1% rule
- 0.63% ✗
- Cap rate
- 5.03%
- Cash-on-cash
- -4.51%
- DSCR
- 0.80
- GRM
- 13.2
CMA / ARV
- ARV (on-the-fly)
- $340,032
- Comps found
- 1
Show comp detail 1 sale within ~0.75 mi
| Address | Dist | Beds/Ba | Sqft | Sold | Price | $/sf | Match |
|---|---|---|---|---|---|---|---|
| 54 Stony Ln | 0.64mi | 3/2.0 | 1,104 (0%) | 14mo | $339,900 | $308 | 59 |
Match score weights: distance 35% · size 25% · config 20% · recency 20%. Top-matched comps best support the ARV.
Projected returns pro-forma
10.0% appreciation · 3.0% rent growth · sell at horizon
- IRR
- 21.1%
- Equity multiple
- 2.70×
- Total profit
- $152,676
- Equity at exit
- $288,281
- IRR
- 19.1%
- Equity multiple
- 6.20×
- Total profit
- $466,206
- Equity at exit
- $621,690
Cash invested: $89,600 (down + closing). Projections, not guarantees.
Landlord ↔ Tenant lean methodology
- Overall (STATE)
- 83 Strongly Landlord-Friendly
- State West Virginia
- 83 Strongly Landlord-Friendly · R+22
- County
- — inherits STATE
- City
- — inherits STATE
ZIP-level market 25438
- Home prices YoY
- 10.3%
- Active inventory
- 311
- Price-to-rent
- 13.2×
Monthly cashflow live
- Estimated rent
- $2,021 medium interval (Pro) →
- Mortgage (P&I)
- −$1,678
- Tax from tax record
- −$122 /mo · $1,466/yr
- Insurance
- −$133
- HOA
- −$0
- Vacancy / Maint / Mgmt
- −$424
- Net cashflow
- $-337
Break-even live
UW: 25.0% down · 7.5% · 30yr · 1.5% tax · 5.0% vac · 8.0% maint · 8.0% mgmt
Financing live
Cash to close
- Down payment
- $80,000
- Closing costs
- $9,600
- Reserves months
- —
- Total cash needed
- —
Loan-product check · same deal, 3 products live
Conventional
25% down · 7.5% · 30yr
- Down + closing
- —
- Monthly P&I
- —
- Monthly cashflow
- —
- DSCR
- —
- Eligible?
- —
Personal DTI + credit; lowest rate.
DSCR
20% down · 8.5% · 30yr
- Down + closing
- —
- Monthly P&I
- —
- Monthly cashflow
- —
- DSCR
- —
- Eligible?
- —
No personal income docs; deal must DSCR.
Hard money
10% down · 12.0% · 12mo
- Down + closing
- —
- Monthly P&I
- —
- Monthly cashflow
- —
- DSCR
- —
- Eligible?
- —
Short-term bridge; refi at stabilization.
Listing history 10 events
-
2026-06-18statusdays on market $320,000 Active 1 DOM
-
2026-06-17days on market $320,000 Coming Soon 12 DOM
-
2026-06-16days on market $320,000 Coming Soon 11 DOM
-
2026-06-15days on market $320,000 Coming Soon 10 DOM
-
2026-06-13days on market $320,000 Coming Soon 8 DOM
-
2026-06-13days on market $320,000 Coming Soon 7 DOM
-
2026-06-09days on market $320,000 Coming Soon 4 DOM
-
2026-06-08days on market $320,000 Coming Soon 3 DOM
-
2026-06-07remarks 699-char remark
-
2026-06-07$320,000 Coming Soon 2 DOM
ⓘ Source: listings_history table (triggers on properties + properties_extension) + one-shot
backfill from property_details.listing_events for pre-trigger history.
Tax reassessment forecast WV · Resets to sale price
- Current annual tax
- $1,466 · $122/mo
- Projected year-2 tax
- $1,888 · $157/mo
- Expected delta
- +$422/yr (+$35/mo · 28.7%)
ⓘ Screening estimate from a state-policy table — verify with the county assessor before closing.
Climate risk First Street
- Flood 1/10 Low FEMA zone X (unshaded) · 0% chance over 30 yrs
- Wildfire 2/10 Low
- Heat 5/10 Major 7 d/yr ≥103°F today · 16 d/yr by 30 yrs out
- Wind 2/10 Low 3% chance of damaging wind over 30 yrs
- Air quality 2/10 Low 1 unhealthy d/yr today · 1 by 30 yrs out
Nearby sold comps map
Loading sold comps map…
Walkable amenities ~0.75 mi
Loading nearby amenities…
Taxation est. · year 1
- Rental income
- $24,253
- − Mortgage interest
- −$17,925
- − Property taxes
- −$1,466
- − Insurance
- −$1,600
- − Repairs & maintenance
- −$1,940
- − Management
- −$1,940
- − Depreciation
- −$9,309
- Taxable loss
- −$9,928
- Est. tax savings @ 24.0%
- +$2,383
- After-tax cash flow
- $-1,661/yr
For passive investors: Depreciation is non-cash, so a rental often shows a tax loss while cash-flowing — sheltering income. Rental losses are passive: they offset passive income freely, and up to $25,000/yr can offset ordinary (W-2) income if you actively participate and your MAGI is under $100k (phasing out to $0 by $150k); unused losses carry forward. On sale, claimed depreciation is recaptured at up to 25%, and gains may owe capital-gains tax (a 1031 exchange can defer both). Figures are a year-1 estimate at your 24.0% rate — not tax advice; consult a CPA.
Schools (NCES district)
- District
- Jefferson County Schools
- NCES district ID
- 5400570
- Math proficiency
- 29% ▼ -13.00%
- Reading proficiency
- 46% ▼ -7.00%
- Median HH income
- $67,038
- Composite
- 33.98/100
- National rank
- #5322
- State rank
- #6 of 55 in WV
Livability — Ranson
- Score
- 66/100
- State rank
- #100
- US rank
- #11255
Category grades
Schools grade is shown separately in the Schools card above.
Census & demographics
- County
- Jefferson County · 28,403 people
- City population
- 7,330
- Metro
- Washington-Arlington-Alexandria, DC-VA-MD-WV
- Population (ZIP)
- 7,330
- Household income
- $81,875
- Rent vs Own
- Severe rent burden
- 90.0
Population outlook (Jefferson County) Hauer SSP2
- Today (2025)
- 61,715 people
- By 2030
- 64,052 · +3.8%
- By 2040
- 67,713 · +9.7%
- By 2050
- 69,843 · +13.2%
- By 2075
- 72,679 · +17.8%
- By 2100
- 71,872 · +16.5%
Race, ethnicity, and origin ACS 2023
- Neighborhood character
- Predominantly White (72%)
- Race & ethnicity
- White 72% Hispanic / Latino 14% Two or more races 7% Black 7% Asian 3%
- Hispanic origin (detail)
- Mexican 3% Puerto Rican 4%
- Common ancestry
- Serbian 4% Italian 2% Romanian 2%
- Foreign-born
- 7% · Canada, Philippines
- Languages at home
- 87% English-only · Spanish 9% Other Asian/Pacific 3%
Political lean MEDSL · Jefferson
- 2024 margin
- R (+15.8) · D 41.0% · R 56.8% · Other 2.1%
- 2008→2024 swing
- -20.6pp toward R · 2008: 4.8pp · 2024: -15.8pp
- All cycles
- 2024: R+15.8 2020: R+10.5 2016: R+15.3 2012: R+4.0 2008: D+4.8
Not yet ingested
- Civics
- —
Market trends
- HPI YoY
- ▲ 32.87%
- Current HPI
- 352.707
- Rent YoY
- —
- Metro
- Washington-Arlington-Alexandria, DC-VA-MD-WV
- State GDP YoY
- —
- F500 in state
- 0
Price history
+157.0% since first listed8 events — show timeline
- 2026-06-05 Coming Soon $320,000 BRIGHT MLS
- 2006-08-01 Sold (Public Records) $199,900 Public Records
- 2006-07-14 Sold (MLS) $199,900 MRIS
- 2006-07-01 Delisted — MRIS
- 2006-05-31 Delisted — MRIS
- 2006-05-31 Listed $199,900 MRIS
- 2006-03-15 Listed — MRIS
- 1995-08-16 Sold (Public Records) $124,500 Public Records
Property tax history
+0.8%/yrLatest (2025): $1,466 · +4.8% YoY. Source: county tax records.
Cash-flow waterfall
monthlySold comps — $/sqft
last 12 mo · ≤1 miLoading sold comps…