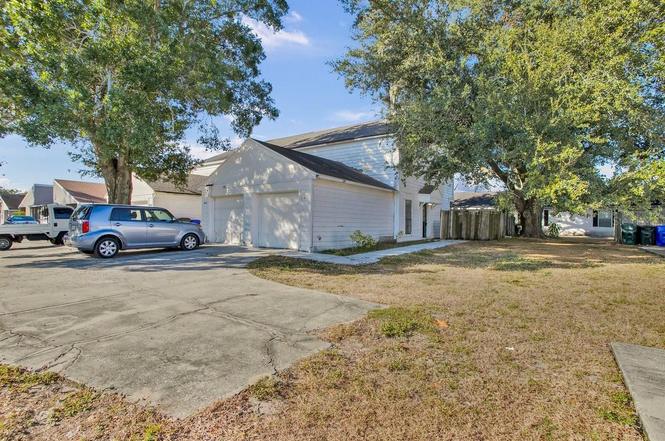
1817 Crystal Grove Dr · Lakeland, FL
Flood risk 1/10 · Minimal
- FEMA flood zone
- X (unshaded)
- Chance of flooding over 30 yrs
- 0.0%
- Est. flood insurance / yr
- $507 – $1,088
Fire risk 4/10 · Minor
- Est. fire insurance / yr
- $947 – $1,759
Heat risk 9/10 · Severe
- Hot days now (above 108°F)
- 8 days/yr
- Hot days in 30 yrs
- 26 days/yr
Wind risk 9/10 · Severe
- Chance of severe wind over 30 yrs
- 99.0%
Air-quality risk 2/10 · Minimal
- Unhealthy air days now
- 1 days/yr
- Unhealthy air days in 30 yrs
- 2 days/yr
Risk factors via First Street. Map © Google.
Why this score? — see what drove the D grade
The composite is a weighted blend of 9 inputs, each scored 0–100. Each bar is that input's sub-score; the figure is the points it added to the 100-point composite (weight × sub-score).
- Cash flow +14.2/30.0
- ARV discount +7.5/15.0
- DSCR +4.3/10.0
- Livability +3.9/5.0
- Schools +3.5/10.0
- 1% rule +3.2/10.0
- Rent growth +2.8/5.0
- Condition / age +2.5/5.0
- Appreciation +0.0/10.0
$175,000
🖨 Deal sheet (PDF) 📄 Offer letter ✓ Due diligence
Listing remarks MLS
TOWNHOME 2/2 - BEDROOMS UPSTAIRS, SINGLE CAR GARAGE W/ GREAT RENTAL HISTORY.
Key facts
- Modern roof
- Vinyl flooring
- No hoa fees
Tags
Property features AI
Finance
- Other: Lot approximately 0.08 acres (31 x 110); Total rooms: 4; Living area approximately 944 square feet; Unit number not applicable; Third-party listing
- Financial info: Lease restrictions not indicated (no); Furnished status: Negotiable; Taxes and other financial details available separately
- HOA & community: No community features; No association fee services included; Association approval not required
Exterior
- Parking: Attached garage (1 garage space)
- Security: No security features specified
- Utilities: Public water; Public sewer; Public utilities
- Home design: Residential townhouse; Planned Unit Development (PUD) zoning; East-facing; Two stories; Entry level information not specified
- Construction: Frame construction; Shingle roof; Block foundation; Built as part of CRYSTAL GROVE/1817
- Exterior features: Other exterior features; Road surface: Other
Interior
- Kitchen: Microwave; Range; Refrigerator
- Bedrooms: 2 bedrooms
- Flooring: Tile flooring; Vinyl flooring
- Bathrooms: 2 full bathrooms; 1 half bathroom
- Heating & cooling: Central heating; Central air conditioning
- Interior features: Other interior features
- Laundry & utility: No laundry features specified
Neighborhood map
What this means for you Summary
Snapshot
- This is a 2-bed/2.0-bath single-family listed at $175k.
Deal economics
- At list price, monthly cash flow is $30 ($355/yr) — positive.
- The deal already cash-flows at list — no discount required.
- To meet the 1% rule (rent ≥ 1% of price), the offer needs to be $144k (17.6% below list).
- Recommended offer: $144k (17.6% below list) — sets the bar for 1% rule.
Location & tenants
- Location reads 77/100 on livability (#206 in FL, #3,179 nationally) — a middle-class / working-renter tenant base. Strengths: cost of living A+, housing A+, health & safety A+; Watch: employment D+, amenities F, commute F.
- Polk (suburban): math 39% / reading 43% proficiency, ranked #62 of 73 in FL (top 85%) — families likely to look elsewhere, expect single-tenant / working-renter base with shorter leases.
- Zoned schools: Crystal Lake Elementary School (math 12% / reading 22%, grade F, #2,121 of 2,144 statewide, top 99%, 409 students, 60% FRL); Crystal Lake Middle School (math 27% / reading 27%, grade F, #497 of 571 statewide, top 88%, 949 students, 71% FRL); Lakeland Senior High School (math 29% / reading 51%, grade F, #296 of 667 statewide, top 45%, 2,043 students, 44% FRL) — zoned schools at 58% FRL track the district average.
- Zoned-school proficiency averages 28% at this address vs 41% district-wide (-13 pts) — the specific schools serving this property underperform the Polk average; the district grade overstates school quality for this exact location.
- Market conditions: Rents rising (+1.1%/yr); 256 active listings in the ZIP; 21 comparable units currently listed for rent nearby; rentals at typical pace (median 26d on market — plan ~3-4 weeks tenant-placement turnaround); 10,384 units permitted in Polk County in 2024 (1,716 in 5+ unit buildings).
- This rent runs 33% of the median local income ($53k/yr) — at the standard rent-burdened threshold; future hikes will face affordability resistance.
Forward outlook
- Local home prices are declining (-3.0%/yr); year-one equity from $1k of loan paydown is wiped out by about $5k of value loss. Plan a longer hold.
- Polk County population projected at +33% by 2050 — long-run rental-demand tailwind backs the buy-and-hold thesis.
Negotiation context
- It's been on market 209 days — a 12% lower offer ($154k) is reasonable based on typical stale-listing flexibility.
- 3 sale attempts since 21y ago; this cycle's ask has dropped $15k (8%) from the opening price — seller is motivated, your offer sets the floor, not the list.
- Current owner paid $70k; list at $175k implies a 150% gain — meaningful room to come down on a strong offer.
Risks & watch-outs
- Climate carrying-cost: severe wind risk, 99% chance of damaging wind over 30y; extreme-heat days projected 8→26/yr by 2055 (HVAC capex compounding) — expect insurance premiums to compound above CPI over the hold.
Questions for the listing agent
- It's been on market 209 days. Have you received any prior offers? Is the seller open to a 18% concession, seller financing, or rate buy-down credit?
- Why hasn't it sold? Are there any deal-killer items the seller is aware of (foundation, flood, title, zoning, code violations)?
- Is there a deadline driving the sale (1031 exchange, divorce, estate, relocation)? That informs how much negotiation room exists.
- The area grade is low — what's the realistic commute time and amenity access for the typical tenant pool here? Any planned neighborhood developments (good or bad) we should know about?
- What's the average days-on-market for RENTAL listings here right now (not sales)? A rising rental-DOM trend means longer vacancies and softer asking-rent achievability than the comps imply.
- What's the recent tenant-quality profile in this submarket — average credit score on applications, eviction rate, late-payment / NSF rate, and stable-employment percentage? A property-management company in the area should have these aggregated.
- How much new for-sale + rental construction is in the pipeline within 1–3 miles? Heavy new supply typically softens prices + rents 12–24 months out; constrained supply supports both.
Investment metrics
- 1% rule
- 0.82% ✗
- Cap rate
- 6.50%
- Cash-on-cash
- 0.73%
- DSCR
- 1.03
- GRM
- 10.1
CMA / ARV
No comps found within radius.
Projected returns pro-forma
-3.0% appreciation · 1.05% rent growth · sell at horizon
- IRR
- -17.2%
- Equity multiple
- 0.40×
- Total profit
- $-29,285
- Equity at exit
- $26,093
- IRR
- -12.9%
- Equity multiple
- 0.30×
- Total profit
- $-34,180
- Equity at exit
- $15,131
Cash invested: $49,000 (down + closing). Projections, not guarantees.
Landlord ↔ Tenant lean methodology
- Overall (STATE)
- 87 Strongly Landlord-Friendly
- State Florida
- 87 Strongly Landlord-Friendly · R+3
- County
- — inherits STATE
- City
- — inherits STATE
ZIP-level market 33801
- Home prices YoY
- -15.9%
- Rents YoY
- 1.1%
- Active inventory
- 256
- Price-to-rent
- 10.1×
Monthly cashflow live
- Estimated rent
- $1,441 high interval (Pro) →
- Mortgage (P&I)
- −$918
- Tax from tax record
- −$118 /mo · $1,422/yr
- Insurance
- −$73
- HOA
- −$0
- Vacancy / Maint / Mgmt
- −$303
- Net cashflow
- $30
Break-even live
Sensitivity live
| Price | -10% $129 | -5% $79 | +0% $30 | +5% $-20 | +10% $-69 |
|---|---|---|---|---|---|
| Rent | -10% $-84 | -5% $-27 | +0% $30 | +5% $87 | +10% $143 |
| Rate | -1.0pp $118 | -0.5pp $74 | base $30 | +0.5pp $-16 | +1.0pp $-62 |
UW: 25.0% down · 7.5% · 30yr · 1.5% tax · 5.0% vac · 8.0% maint · 8.0% mgmt
Financing live
Cash to close
- Down payment
- $43,750
- Closing costs
- $5,250
- Reserves months
- —
- Total cash needed
- —
Loan-product check · same deal, 3 products live
Conventional
25% down · 7.5% · 30yr
- Down + closing
- —
- Monthly P&I
- —
- Monthly cashflow
- —
- DSCR
- —
- Eligible?
- —
Personal DTI + credit; lowest rate.
DSCR
20% down · 8.5% · 30yr
- Down + closing
- —
- Monthly P&I
- —
- Monthly cashflow
- —
- DSCR
- —
- Eligible?
- —
No personal income docs; deal must DSCR.
Hard money
10% down · 12.0% · 12mo
- Down + closing
- —
- Monthly P&I
- —
- Monthly cashflow
- —
- DSCR
- —
- Eligible?
- —
Short-term bridge; refi at stabilization.
Rent comps 21 comps
| Address | Beds | Baths | Sqft | Rent | $/sqft | DOM | Units | Dist |
|---|---|---|---|---|---|---|---|---|
| 1922 Crystal Grove Dr #1922 Lakeland, FL | 2.0 | 2.0 | 1014 | $1,547 | $1.53 | 25d | 1 | 0.08mi |
| 1969 Crystal Grove Dr Lakeland, FL | 2.0 | 1.0–2.0 | 576 | $1,415 | $2.46 | 5d | 8 | 0.10mi |
| 2025 Sylvester Rd Unit N109 Lakeland, FL | 2.0 | 2.0 | 1099 | $1,750 | $1.59 | 5d | 1 | 0.58mi |
| 2025 Sylvester Rd Lakeland, FL | 1.0–2.0 | 1.0–2.0 | 1099 | $1,850 | $1.68 | 25d | 2 | 0.58mi |
| 2830 Skyview Dr Lakeland, FL | 2.0 | 1.0 | 850 | $1,175 | $1.38 | 25d | 1 | 0.76mi |
| 2839 8 Iron Dr Unit 2841 Lakeland, FL | 2.0 | 1.5 | 900 | $1,397 | $1.55 | 25d | 1 | 0.77mi |
| 1885 N Crystal Lake Dr Apt 7 Lakeland, FL | 2.0 | 1.5 | 900 | $1,395 | $1.55 | 25d | 1 | 0.79mi |
| 1505 Goodyear Ave Unit 17 Lakeland, FL | 2.0 | 1.0 | 792 | $950 | $1.20 | 25d | 1 | 0.80mi |
| 2929 Nine Iron Dr Lakeland, FL | 2.0 | 1.0 | 850 | $875 | $1.03 | 5d | 1 | 0.87mi |
| 3061 Crystal Hills Dr Lakeland, FL | 2.0 | 2.0 | 720 | $1,400 | $1.94 | 25d | 1 | 0.97mi |
| 1920 E Edgewood Dr Lakeland, FL | 2.0 | 1.0–2.0 | 831 | $1,388 | $1.67 | 5d | 2 | 0.97mi |
| 2023 Tennyson St Unit 2025 Lakeland, FL | 2.0 | 1.0 | 884 | $1,095 | $1.24 | 25d | 1 | 1.13mi |
| 3021 Balfour Ave Lakeland, FL | 2.0 | 1.0 | 816 | $1,275 | $1.56 | 5d | 1 | 1.17mi |
| 3306 Peachtree Hill Rd Lakeland, FL | 2.0 | 1.0 | 742 | $1,195 | $1.61 | 16d | 1 | 1.27mi |
| 3321 Peachtree Hill Rd Lakeland, FL | 3.0 | 2.0 | 960 | $1,475 | $1.54 | 16d | 1 | 1.31mi |
| 1323 Tom Watson Rd Lakeland, FL | 2.0 | 1.0 | 800 | $1,350 | $1.69 | 25d | 1 | 1.31mi |
| 2184 Colonial Ave Lakeland, FL | 3.0 | 2.0 | 1123 | $1,645 | $1.46 | 25d | 1 | 1.34mi |
| 1509 Phyllis St Lakeland, FL | 3.0 | 1.0 | 1064 | $1,660 | $1.56 | 16d | 1 | 1.34mi |
| 1108 Bartow Rd Lakeland, FL | 1.0–2.0 | 1.0 | 797 | $1,395 | $1.75 | 5d | 2 | 1.35mi |
| 1104 Bartow Rd Lakeland, FL | 1.0–2.0 | 1.0 | 760 | $1,225 | $1.61 | 25d | 1 | 1.45mi |
| 3330 Jean Ave Lakeland, FL | 2.0 | 1.0 | 616 | $1,300 | $2.11 | 25d | 1 | 1.47mi |
Listing history 23 events
-
2026-06-22days on market $175,000 Active 209 DOM
-
2026-06-18days on market $175,000 Active 206 DOM
-
2026-06-17days on market $175,000 Active 205 DOM
-
2026-06-16days on market $175,000 Active 204 DOM
-
2026-06-15days on market $175,000 Active 203 DOM
-
2026-06-13days on market $175,000 Active 201 DOM
-
2026-06-10days on market $175,000 Active 198 DOM
-
2026-06-09days on market $175,000 Active 197 DOM
-
2026-06-08days on market $175,000 Active 196 DOM
-
2026-06-07days on market $175,000 Active 195 DOM
-
2026-06-05days on market $175,000 Active 192 DOM
-
2026-06-03days on market $175,000 Active 190 DOM
-
2026-06-01days on market $175,000 Active 189 DOM
-
2026-05-31days on market $175,000 Active 188 DOM
-
2025-12-18price $175,000
-
2025-12-10price $180,000
-
2025-12-01price $185,000
-
2025-11-24$190,000 Active
-
2007-10-10$84,900
-
2006-04-21soldstatus $70,000
-
2006-04-13soldstatus $70,000 76-char remark
Show marketing remark (76 chars)
TOWNHOME 2/2 - BEDROOMS UPSTAIRS, SINGLE CAR GARAGE W/ GREAT RENTAL HISTORY.
-
2005-10-07$75,000 76-char remark
Show marketing remark (76 chars)
TOWNHOME 2/2 - BEDROOMS UPSTAIRS, SINGLE CAR GARAGE W/ GREAT RENTAL HISTORY.
-
1993-04-13soldstatus $26,000
ⓘ Source: listings_history table (triggers on properties + properties_extension) + one-shot
backfill from property_details.listing_events for pre-trigger history.
Tax reassessment forecast FL · Resets to sale price
- Current annual tax
- $1,422 · $118/mo
- Projected year-2 tax
- $1,452 · $121/mo
- Expected delta
- +$31/yr (+$3/mo · 2.2%)
ⓘ Screening estimate from a state-policy table — verify with the county assessor before closing.
Climate risk First Street
- Flood 1/10 Low FEMA zone X (unshaded) · 0% chance over 30 yrs
- Wildfire 4/10 Moderate
- Heat 9/10 Extreme 8 d/yr ≥108°F today · 26 d/yr by 30 yrs out
- Wind 9/10 Extreme 99% chance of damaging wind over 30 yrs
- Air quality 2/10 Low 1 unhealthy d/yr today · 2 by 30 yrs out
Nearby sold comps map
Loading sold comps map…
Walkable amenities ~0.75 mi
Loading nearby amenities…
Taxation est. · year 1
- Rental income
- $17,297
- − Mortgage interest
- −$9,803
- − Property taxes
- −$1,422
- − Insurance
- −$875
- − Repairs & maintenance
- −$1,384
- − Management
- −$1,384
- − Depreciation
- −$5,091
- Taxable loss
- −$2,661
- Est. tax savings @ 24.0%
- +$639
- After-tax cash flow
- $994/yr
For passive investors: Depreciation is non-cash, so a rental often shows a tax loss while cash-flowing — sheltering income. Rental losses are passive: they offset passive income freely, and up to $25,000/yr can offset ordinary (W-2) income if you actively participate and your MAGI is under $100k (phasing out to $0 by $150k); unused losses carry forward. On sale, claimed depreciation is recaptured at up to 25%, and gains may owe capital-gains tax (a 1031 exchange can defer both). Figures are a year-1 estimate at your 24.0% rate — not tax advice; consult a CPA.
Schools (NCES district)
- District
- Polk
- NCES district ID
- 1201590
- Math proficiency
- 39% ▼ -11.00%
- Reading proficiency
- 43% ▼ -4.00%
- Median HH income
- $43,979
- Composite
- 34.74/100
- National rank
- #5132
- State rank
- #62 of 73 in FL
Livability — Lakeland
- Score
- 77/100
- State rank
- #206
- US rank
- #3179
Category grades
Schools grade is shown separately in the Schools card above.
Census & demographics
- Census place
- Lakeland, FL
- County
- Polk County · 740,051 people
- City population
- 277,690
- Metro
- Lakeland-Winter Haven, FL
- Population (ZIP)
- 35,394
- Household income
- $53,061
- Rent vs Own
- Severe rent burden
- 1291.0
Population outlook (Polk County) Hauer SSP2
- Today (2025)
- 752,975 people
- By 2030
- 804,621 · +6.9%
- By 2040
- 906,117 · +20.3%
- By 2050
- 1,000,476 · +32.9%
- By 2075
- 1,197,520 · +59.0%
- By 2100
- 1,271,518 · +68.9%
Race, ethnicity, and origin ACS 2023
- Neighborhood character
- Diverse neighborhood (Simpson 0.58)
- Race & ethnicity
- White 60% Hispanic / Latino 19% Black 16% Two or more races 8% Asian 1%
- Hispanic origin (detail)
- Mexican 5% Puerto Rican 8% Cuban 3%
- Common ancestry
- Romanian 2% Slovak 2% Lithuanian 1%
- Foreign-born
- 8% · Canada
- Languages at home
- 83% English-only · Spanish 14% French/Haitian/Cajun 1%
Political lean MEDSL · Polk
- 2024 margin
- Strong R (+20.7) · D 39.2% · R 59.9%
- 2008→2024 swing
- -14.6pp toward R · 2008: -6.1pp · 2024: -20.7pp
- All cycles
- 2024: R+20.7 2020: R+14.4 2016: R+14.1 2012: R+6.8 2008: R+6.1
Not yet ingested
- Civics
- —
Market trends
- HPI YoY
- ▼ -70.91%
- Current HPI
- 373.7159
- Rent YoY
- ▲ 1.05%
- Metro
- Lakeland-Winter Haven, FL
- State GDP YoY
- ▲ 3.28%
- F500 in state
- 36
Industry mix (Fortune 500 HQ in FL)
| Industry | F500 HQs | Revenue |
|---|---|---|
| Industrial Technology | 2 | $29B |
|
||
| Insurance | 2 | $17B |
|
||
| Retail | 1 | $60B |
|
||
| Technology Distribution | 1 | $58B |
|
||
| Homebuilding | 1 | $35B |
|
||
| Technology Manufacturing | 1 | $35B |
|
||
Price history
+573.1% since first listed9 events — show timeline
- 2025-12-18 Price Changed $175,000 Stellar MLS as Distributed by MLS Grid
- 2025-12-10 Price Changed $180,000 Stellar MLS as Distributed by MLS Grid
- 2025-12-01 Price Changed $185,000 Stellar MLS as Distributed by MLS Grid
- 2025-11-24 Listed $190,000 Stellar MLS as Distributed by MLS Grid
- 2007-10-10 Listed $84,900 Stellar MLS as Distributed by MLS Grid
- 2006-04-21 Sold (Public Records) $70,000 Public Records
- 2006-04-13 Sold (MLS) $70,000 Stellar MLS as Distributed by MLS Grid
- 2005-10-07 Listed $75,000 Stellar MLS as Distributed by MLS Grid
- 1993-04-13 Sold (Public Records) $26,000 Public Records
Property tax history
+7.4%/yrLatest (2025): $1,422 · +2.3% YoY. Source: county tax records.
Cash-flow waterfall
monthlySold comps — $/sqft
last 12 mo · ≤1 miLoading sold comps…