53430 N La Plata Dr · Seligman, AZ
Flood risk 1/10 · Minimal
- FEMA flood zone
- D
- Chance of flooding over 30 yrs
- 0.0%
- Est. flood insurance / yr
- $544 – $1,084
Fire risk 5/10 · Moderate
- Est. fire insurance / yr
- $610 – $1,132
Heat risk 4/10 · Minor
- Hot days now (above 95°F)
- 7 days/yr
- Hot days in 30 yrs
- 18 days/yr
Wind risk 1/10 · Minimal
- Chance of severe wind over 30 yrs
- —
Air-quality risk 1/10 · Minimal
- Unhealthy air days now
- 0 days/yr
- Unhealthy air days in 30 yrs
- 0 days/yr
Risk factors via First Street. Map © Google.
Why this score? — see what drove the D+ grade
The composite is a weighted blend of 9 inputs, each scored 0–100. Each bar is that input's sub-score; the figure is the points it added to the 100-point composite (weight × sub-score).
- Cash flow +17.8/30.0
- ARV discount +7.5/15.0
- DSCR +5.6/10.0
- Appreciation +4.0/10.0
- 1% rule +3.5/10.0
- Livability +3.1/5.0
- Rent growth +2.5/5.0
- Condition / age +2.5/5.0
- Schools +2.4/10.0
$199,000
🖨 Deal sheet 📄 Offer letter ✓ Due diligence
Listing remarks
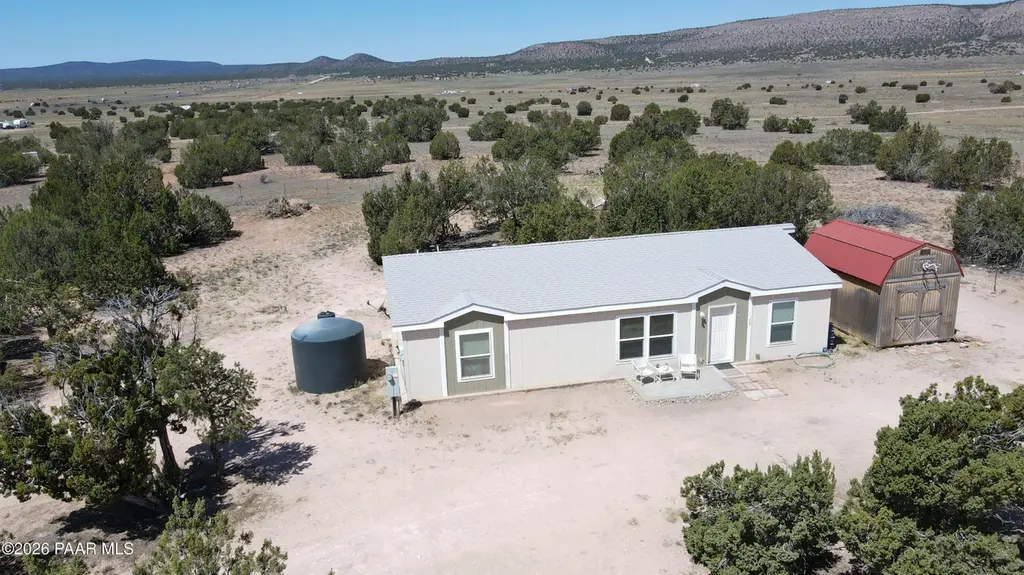
Enjoy easy Northern Arizona living with this 3-bedroom, 2-bath home on two separate parcels totaling 4 acres. Barely off pavement and easily accessible, this 1,344 sq ft home was built in 2013 and offers beautiful views, room to spread out, and the convenience of being only about 10 minutes from town. Inside, you'll find a desirable split-bedroom floor plan for added privacy, along with an open living area, eat-in kitchen, and kitchen island that makes gathering and meal prep easy. The home is all electric and located in a water haul area with a 2,500-gallon water cistern already in place. The house parcel includes perimeter fencing, offering added privacy and usability. A leased solar syst
Key facts
- Two separate parcels
- Open living area
- Eat-in kitchen
Tags
Property features AI
Finance
- Other: Property sits on approximately 4.02 acres; Private maintained road frontage (dirt/unimproved); Topography: level, rural with juniper/pinon; Additional parcels included; Zoning: RCU-2A; Pets allowed: domestics, farm animals, horses
- HOA & community: Subdivision offers a clubhouse and community kitchen; membership optional; Not a senior community
Exterior
- Parking: Circular driveway
- Security: Smoke detectors
- Utilities: Electricity available; Cistern water source; Hauled water; Septic (conventional); Electric water heater
- Home design: Manufactured double-wide home; Single-story; Residential property
- Construction: Composition roof; Built with other construction materials
- Exterior features: Patio; Circular and dirt driveway; Shed(s); Drought-tolerant landscaping with native species; Partial/perimeter fencing
Interior
- Kitchen: Electric cooktop; Refrigerator
- Bedrooms: Master bedroom on main level
- Flooring: Carpet; Laminate
- Bathrooms: 2 full bathrooms
- Heating & cooling: Forced air heating; Ceiling fan(s); Room refrigeration
- Interior features: Ceiling fans; Eat-in kitchen with kitchen/dining combo; Kitchen island; Pantry; Single-level living; Master bedroom on main level; Washer/dryer connection
- Laundry & utility: Dryer; Laundry room; Washer/dryer connection
Neighborhood map
What this means for you Summary
Snapshot
- This is a 3-bed/2.0-bath manufactured listed at $199k.
Deal economics
- At list price, monthly cash flow is $166 ($2k/yr) — positive.
- The deal already cash-flows at list — no discount required.
- To meet the 1% rule (rent ≥ 1% of price), the offer needs to be $169k (15.2% below list).
- Recommended offer: $169k (15.2% below list) — sets the bar for 1% rule.
- Cap rate 7.3% vs local median 4.0% in Seligman — top-decile yield for the area; either an underpriced asset or a hidden risk that comps aren't pricing in. Stress-test before assuming the spread holds.
Location & tenants
- Location reads 62/100 on livability (#127 in AZ) — a middle-class / working-renter tenant base. Strengths: employment A+, cost of living A+; Watch: schools F, crime F, amenities F.
- Seligman Unified District (4472) (rural): math 20% / reading 30% proficiency, ranked #339 of 501 in AZ (top 68%) — low school quality limits family demand, transient renter base, plan for 1-2y turnover.
- Market conditions: 293 active listings in the ZIP; 2,062 units permitted in Yavapai County in 2024 (98 in 5+ unit buildings).
Forward outlook
- Local home prices are declining (-2.0%/yr); year-one equity from $1k of loan paydown is wiped out by about $4k of value loss. Plan a longer hold.
- Yavapai County population projected at +10% by 2050 — modest demand growth; plan on rents tracking national, not racing it.
Negotiation context
- It's been on market 15 days — a 2% lower offer ($196k) is reasonable based on typical stale-listing flexibility.
- Current owner paid $10k; list at $199k implies a 1995% gain — meaningful room to come down on a strong offer.
Risks & watch-outs
- Climate carrying-cost: moderate wildfire risk — expect insurance premiums to compound above CPI over the hold.
Questions for the listing agent
- Is there a deadline driving the sale (1031 exchange, divorce, estate, relocation)? That informs how much negotiation room exists.
- Schools are F-rated, which usually means shorter tenancies and higher turnover. Who's the typical renter profile here, and what's been the actual vacancy rate?
- Crime grade is F in this area — have there been break-ins, vandalism, or insurance claims at this property in the last 3 years? What carrier currently insures it and at what premium?
- The area grade is low — what's the realistic commute time and amenity access for the typical tenant pool here? Any planned neighborhood developments (good or bad) we should know about?
- What's the average days-on-market for RENTAL listings here right now (not sales)? A rising rental-DOM trend means longer vacancies and softer asking-rent achievability than the comps imply.
- What's the recent tenant-quality profile in this submarket — average credit score on applications, eviction rate, late-payment / NSF rate, and stable-employment percentage? A property-management company in the area should have these aggregated.
- How much new for-sale + rental construction is in the pipeline within 1–3 miles? Heavy new supply typically softens prices + rents 12–24 months out; constrained supply supports both.
Investment metrics
- 1% rule
- 0.85% ✗
- Cap rate
- 7.29%
- Cash-on-cash
- 3.57%
- DSCR
- 1.16
- GRM
- 9.8
CMA / ARV
No comps found within radius.
Projected returns pro-forma
-2.0% appreciation · 3.0% rent growth · sell at horizon
- IRR
- -6.0%
- Equity multiple
- 0.76×
- Total profit
- $-13,367
- Equity at exit
- $38,642
- IRR
- 2.0%
- Equity multiple
- 1.16×
- Total profit
- $9,050
- Equity at exit
- $33,016
Cash invested: $55,720 (down + closing). Projections, not guarantees.
Landlord ↔ Tenant lean methodology
- Overall (STATE)
- 87 Strongly Landlord-Friendly
- State Arizona
- 87 Strongly Landlord-Friendly · R+3
- County
- — inherits STATE
- City
- — inherits STATE
ZIP-level market 86337
- Home prices YoY
- -1.0%
- Active inventory
- 293
- Price-to-rent
- 9.8×
Monthly cashflow live
- Estimated rent
- $1,688 medium interval (Pro) →
- Mortgage (P&I)
- −$1,044
- Tax from tax record
- −$41 /mo · $496/yr
- Insurance
- −$83
- HOA
- −$0
- Vacancy / Maint / Mgmt
- −$354
- Net cashflow
- $166
Break-even live
UW: 25.0% down · 7.5% · 30yr · 1.5% tax · 5.0% vac · 8.0% maint · 8.0% mgmt
Financing live
Cash to close
- Down payment
- $49,750
- Closing costs
- $5,970
- Reserves months
- —
- Total cash needed
- —
Loan-product check · same deal, 3 products live
Conventional
25% down · 7.5% · 30yr
- Down + closing
- —
- Monthly P&I
- —
- Monthly cashflow
- —
- DSCR
- —
- Eligible?
- —
Personal DTI + credit; lowest rate.
DSCR
20% down · 8.5% · 30yr
- Down + closing
- —
- Monthly P&I
- —
- Monthly cashflow
- —
- DSCR
- —
- Eligible?
- —
No personal income docs; deal must DSCR.
Hard money
10% down · 12.0% · 12mo
- Down + closing
- —
- Monthly P&I
- —
- Monthly cashflow
- —
- DSCR
- —
- Eligible?
- —
Short-term bridge; refi at stabilization.
Listing history 13 events
-
2026-06-13statusdays on market $199,000 Pending 15 DOM
-
2026-06-10days on market $199,000 Active 13 DOM
-
2026-06-09days on market $199,000 Active 12 DOM
-
2026-06-08days on market $199,000 Active 11 DOM
-
2026-06-07days on market $199,000 Active 10 DOM
-
2026-06-03days on market $199,000 Active 6 DOM
-
2026-06-02days on market $199,000 Active 5 DOM
-
2026-06-01days on market $199,000 Active 4 DOM
-
2026-05-31days on market $199,000 Active 3 DOM
-
2026-05-30days on market $199,000 Active 2 DOM
-
2026-05-28$199,000 Active
-
2011-11-02soldstatus $9,500
-
2011-11-02soldstatus $10,196
ⓘ Source: listings_history table (triggers on properties + properties_extension) + one-shot
backfill from property_details.listing_events for pre-trigger history.
Tax reassessment forecast AZ · Resets to sale price
- Current annual tax
- $496 · $41/mo
- Projected year-2 tax
- $1,313 · $109/mo
- Expected delta
- +$817/yr (+$68/mo · 164.7%)
ⓘ Screening estimate from a state-policy table — verify with the county assessor before closing.
Climate risk First Street
- Flood 1/10 Low FEMA zone D · 0% chance over 30 yrs
- Wildfire 5/10 Major
- Heat 4/10 Moderate 7 d/yr ≥95°F today · 18 d/yr by 30 yrs out
- Wind 1/10 Low
- Air quality 1/10 Low 0 unhealthy d/yr today · 0 by 30 yrs out
Nearby sold comps map
Loading sold comps map…
Walkable amenities ~0.75 mi
Loading nearby amenities…
Taxation est. · year 1
- Rental income
- $20,255
- − Mortgage interest
- −$11,147
- − Property taxes
- −$496
- − Insurance
- −$995
- − Repairs & maintenance
- −$1,620
- − Management
- −$1,620
- − Depreciation
- −$5,789
- Taxable loss
- −$1,413
- Est. tax savings @ 24.0%
- +$339
- After-tax cash flow
- $2,327/yr
For passive investors: Depreciation is non-cash, so a rental often shows a tax loss while cash-flowing — sheltering income. Rental losses are passive: they offset passive income freely, and up to $25,000/yr can offset ordinary (W-2) income if you actively participate and your MAGI is under $100k (phasing out to $0 by $150k); unused losses carry forward. On sale, claimed depreciation is recaptured at up to 25%, and gains may owe capital-gains tax (a 1031 exchange can defer both). Figures are a year-1 estimate at your 24.0% rate — not tax advice; consult a CPA.
Schools (NCES district)
- District
- Seligman Unified District (4472)
- NCES district ID
- 0407630
- Math proficiency
- 20% ▬ 0.00%
- Reading proficiency
- 30% ▬ 0.00%
- Median HH income
- $35,531
- Composite
- 23.7/100
- National rank
- #13238
- State rank
- #339 of 501 in AZ
Livability — Seligman
- Score
- 62/100
- State rank
- #127
- US rank
- #16174
Category grades
Schools grade is shown separately in the Schools card above.
Census & demographics
- Population (ZIP)
- 1,827
Population outlook (Yavapai County) Hauer SSP2
- Today (2025)
- 241,389 people
- By 2030
- 249,523 · +3.4%
- By 2040
- 259,966 · +7.7%
- By 2050
- 264,736 · +9.7%
- By 2075
- 269,334 · +11.6%
- By 2100
- 256,505 · +6.3%
Race, ethnicity, and origin ACS 2023
- Neighborhood character
- Predominantly White (70%)
- Race & ethnicity
- White 70% Hispanic / Latino 19% Two or more races 9% Native American 4% Asian 1%
- Hispanic origin (detail)
- Mexican 18%
- Common ancestry
- Slovak 7% Lithuanian 4% Serbian 3%
- Foreign-born
- 1% · Canada
- Languages at home
- 94% English-only · Spanish 5% Other Asian/Pacific 1%
Political lean MEDSL · Yavapai
- 2024 margin
- Solid R (+33.9) · D 32.6% · R 66.5%
- 2008→2024 swing
- -9.5pp toward R · 2008: -24.4pp · 2024: -33.9pp
- All cycles
- 2024: R+33.9 2020: R+29.3 2016: R+31.4 2012: R+30.7 2008: R+24.4
Not yet ingested
- Civics
- —
Market trends
- HPI YoY
- ▼ -2.00%
- Current HPI
- 196.1506
- Rent YoY
- —
- Metro
- —
- State GDP YoY
- ▲ 4.54%
- F500 in state
- 20
Industry mix (Fortune 500 HQ in AZ)
| Industry | F500 HQs | Revenue |
|---|---|---|
| Technology | 2 | $13B |
|
||
| Mining / Metals | 1 | $23B |
|
||
| Environmental Services | 1 | $16B |
|
||
| Metals / Steel | 1 | $14B |
|
||
| Technology Distribution | 1 | $9B |
|
||
| Homebuilding | 1 | $8B |
|
||
Price history
+1994.7% since first listed3 events — show timeline
- 2026-05-28 Listed $199,000 PAARMLS as Distributed by MLS Grid
- 2011-11-02 Sold (Public Records) $10,196 Public Records
- 2011-11-02 Sold (Public Records) $9,500 Public Records
Property tax history
+25.2%/yrLatest (2025): $496 · -0.5% YoY. Source: county tax records.
Cash-flow waterfall
monthlySold comps — $/sqft
last 12 mo · ≤1 miLoading sold comps…