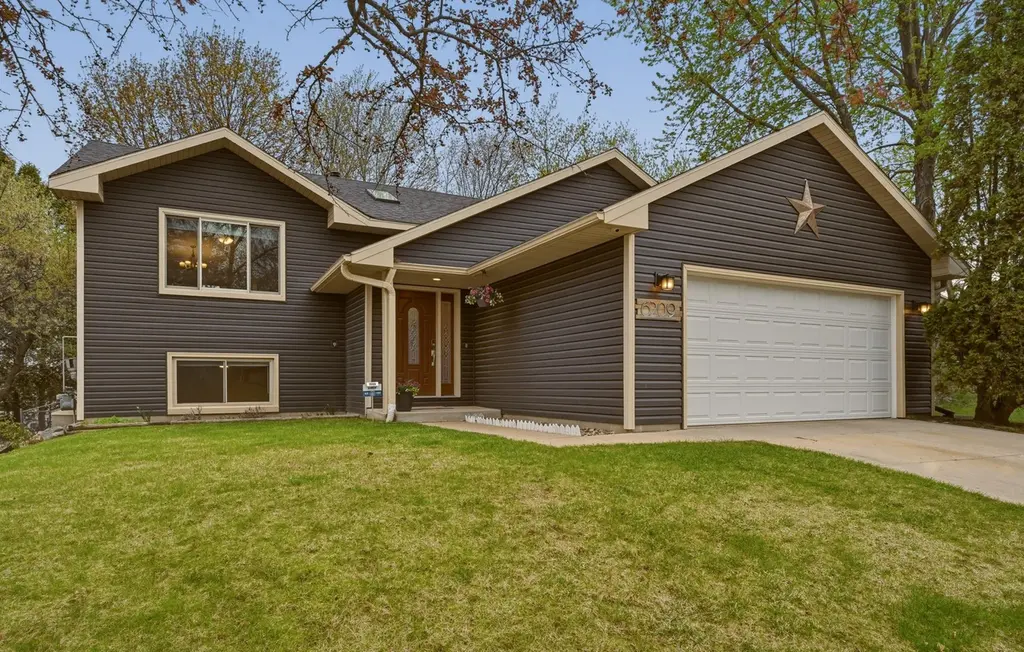
6209 24th Ave NW · Rochester, MN
Flood risk 1/10 · Minimal
- FEMA flood zone
- X (unshaded)
- Chance of flooding over 30 yrs
- 0.0%
- Est. flood insurance / yr
- $473 – $860
Fire risk 1/10 · Minimal
- Est. fire insurance / yr
- $888 – $1,650
Heat risk 2/10 · Minimal
- Hot days now (above 99°F)
- 7 days/yr
- Hot days in 30 yrs
- 15 days/yr
Wind risk 2/10 · Minimal
- Chance of severe wind over 30 yrs
- —
Air-quality risk 2/10 · Minimal
- Unhealthy air days now
- 1 days/yr
- Unhealthy air days in 30 yrs
- 1 days/yr
Risk factors via First Street. Map © Google.
Why this score? — see what drove the D- grade
The composite is a weighted blend of 9 inputs, each scored 0–100. Each bar is that input's sub-score; the figure is the points it added to the 100-point composite (weight × sub-score).
- ARV discount +14.3/15.0
- Cash flow +7.0/30.0
- Livability +4.6/5.0
- Schools +4.1/10.0
- Rent growth +3.0/5.0
- Condition / age +2.5/5.0
- 1% rule +1.6/10.0
- DSCR +1.2/10.0
- Appreciation +0.0/10.0
$360,000
🖨 Deal sheet (PDF) 📄 Offer letter ✓ Due diligence
Listing remarks MLS
Listed and pending.
Key facts
- 0.23 acre lot
- 2 garage spots
- Built 1990
Property features AI
Exterior
- Parking: Attached insulated garage with garage door opener; 2-car garage
- Security: Security system
- Utilities: City water (connected); City sewer (connected); Natural gas; Circuit breaker electrical service; Served by Rochester Public Utilities
- Home design: Residential property; Split entry (bi-level) design; Entry level: Main and lower levels
- Construction: Block foundation
- Exterior features: Vinyl exterior; Deck; Chain link fence; City-maintained street frontage (city street)
Interior
- Kitchen: Cooktop; Range; Microwave; Dishwasher; Disposal; Refrigerator; Stainless steel appliances
- Bedrooms: 5 bedrooms total; Main level: Primary bedroom, two more bedrooms; Lower level: Two bedrooms (one labeled Bedroom 4 and Bedroom 5)
- Flooring: Tile floors
- Bathrooms: Full bathroom in the basement; Three-quarter bathroom on the main floor
- Heating & cooling: Forced air heating; Central air conditioning
- Interior features: Ceiling fans; Vaulted ceilings; Main floor primary bedroom; Sauna; Security system; Kitchen window; Eat-in kitchen / kitchen-dining layout; Living/dining room layout; Washer/dryer hookup; Water softener (owned)
- Laundry & utility: Laundry room in basement; Washer hookup; Dryer included; Gas water heater
Neighborhood map
What this means for you Summary
Snapshot
- This is a 3-bed/2.0-bath single-family listed at $360k.
Deal economics
- At list price, monthly cash flow is $-528 ($-6k/yr) — negative.
- To cash-flow at today's rent, offer at most $267k (25.9% below list).
- To meet the 1% rule (rent ≥ 1% of price), the offer needs to be $236k (34.5% below list).
- Recommended offer: $236k (34.5% below list) — sets the bar for 1% rule.
- Cap rate 4.5% vs local median 3.6% in Rochester — meaningfully above typical; check what's discounted (condition, days-on-market, listing class) to confirm the premium yield is real.
Location & tenants
- Location reads 92/100 on livability (#1 in MN, #27 nationally) — a professional / high-income tenant draw. Strengths: amenities A+, commute A+, employment A+.
- Rochester Public School District (urban): math 40% / reading 51% proficiency, ranked #152 of 301 in MN (top 50%) — families likely to look elsewhere, expect single-tenant / working-renter base with shorter leases.
- Zoned schools: Overland Elementary School (468 students, 52% FRL); Kellogg Middle (math 42% / reading 53%, grade C-, #93 of 258 statewide, top 37%, 856 students, 43% FRL); Century Senior High (math 37% / reading 67%, grade D+, #111 of 471 statewide, top 26%, 1,698 students, 31% FRL).
- Market conditions: Rents rising (+2.2%/yr); 507 active listings in the ZIP; 4 comparable units currently listed for rent nearby; rentals lingering (median 46d on market — plan ~5-8 weeks vacancy on turnover, expect pricing pressure); 50% of comp listings sitting > 30 days — soft ceiling on asking rent; solid renter incomes; 1,267 units permitted in Olmsted County in 2024 (915 in 5+ unit buildings).
Forward outlook
- Local home prices are declining (-3.0%/yr); year-one equity from $2k of loan paydown is wiped out by about $11k of value loss. Plan a longer hold.
- Olmsted County population projected at +16% by 2050 — long-run rental-demand tailwind backs the buy-and-hold thesis.
Negotiation context
- Only 7 days on market — expect competitive offers; lowballing is unlikely to land.
- 7 sale attempts since 16y ago with the ask held roughly flat each time — persistent listings suggest the price (not the market) is what's stuck; bring a comps-based counter.
Questions for the listing agent
- What do current leases actually rent for vs. the listed asking? Can we see a recent rent roll and the last 12 months of T-12 income?
- Is there a deadline driving the sale (1031 exchange, divorce, estate, relocation)? That informs how much negotiation room exists.
- Schools are A-rated — typically a magnet for longer-tenancy family renters. What's the average tenant stay here, and is there a school-zone premium baked into asking?
- The area grade is low — what's the realistic commute time and amenity access for the typical tenant pool here? Any planned neighborhood developments (good or bad) we should know about?
- What's the average days-on-market for RENTAL listings here right now (not sales)? A rising rental-DOM trend means longer vacancies and softer asking-rent achievability than the comps imply.
- What's the recent tenant-quality profile in this submarket — average credit score on applications, eviction rate, late-payment / NSF rate, and stable-employment percentage? A property-management company in the area should have these aggregated.
- How much new for-sale + rental construction is in the pipeline within 1–3 miles? Heavy new supply typically softens prices + rents 12–24 months out; constrained supply supports both.
Investment metrics
- 1% rule
- 0.66% ✗
- Cap rate
- 4.53%
- Cash-on-cash
- -6.29%
- DSCR
- 0.72
- GRM
- 12.7
CMA / ARV
- ARV (median comp)
- $424,201
- List price
- $360,000
- Delta
- -15.13%
- Verdict
- UNDERPRICED
- Comps
- 9 within 2.0 mi
Projected returns pro-forma
-3.0% appreciation · 2.18% rent growth · sell at horizon
- IRR
- -28.0%
- Equity multiple
- 0.07×
- Total profit
- $-93,923
- Equity at exit
- $53,677
- IRR
- -30.1%
- Equity multiple
- -0.32×
- Total profit
- $-132,984
- Equity at exit
- $31,126
Cash invested: $100,800 (down + closing). Projections, not guarantees.
Landlord ↔ Tenant lean methodology
- Overall (STATE)
- 46 Balanced
- State Minnesota
- 46 Balanced · D+2
- County
- — inherits STATE
- City
- — inherits STATE
ZIP-level market 55901
- Home prices YoY
- -33.2%
- Rents YoY
- 2.2%
- Active inventory
- 507
- Price-to-rent
- 12.7×
Monthly cashflow live
- Estimated rent
- $2,359 medium interval (Pro) →
- Mortgage (P&I)
- −$1,888
- Tax from tax record
- −$354 /mo · $4,248/yr
- Insurance
- −$150
- HOA
- −$0
- Lot rent
- −$0
- Vacancy / Maint / Mgmt
- −$495
- Net cashflow
- $-528
Break-even live
Sensitivity live
| Price | -10% $-324 | -5% $-426 | +0% $-528 | +5% $-630 | +10% $-732 |
|---|---|---|---|---|---|
| Rent | -10% $-714 | -5% $-621 | +0% $-528 | +5% $-435 | +10% $-342 |
| Rate | -1.0pp $-347 | -0.5pp $-437 | base $-528 | +0.5pp $-621 | +1.0pp $-716 |
UW: 25.0% down · 7.5% · 30yr · 1.5% tax · 5.0% vac · 8.0% maint · 8.0% mgmt
Financing live
Cash to close
- Down payment
- $90,000
- Closing costs
- $10,800
- Reserves months
- —
- Total cash needed
- —
Loan-product check · same deal, 3 products live
Conventional
25% down · 7.5% · 30yr
- Down + closing
- —
- Monthly P&I
- —
- Monthly cashflow
- —
- DSCR
- —
- Eligible?
- —
Personal DTI + credit; lowest rate.
DSCR
20% down · 8.5% · 30yr
- Down + closing
- —
- Monthly P&I
- —
- Monthly cashflow
- —
- DSCR
- —
- Eligible?
- —
No personal income docs; deal must DSCR.
Hard money
10% down · 12.0% · 12mo
- Down + closing
- —
- Monthly P&I
- —
- Monthly cashflow
- —
- DSCR
- —
- Eligible?
- —
Short-term bridge; refi at stabilization.
Rent comps 4 comps
| Address | Beds | Baths | Sqft | Rent | $/sqft | DOM | Units | Dist |
|---|---|---|---|---|---|---|---|---|
| 6635 Lodge View DR NW Rochester, MN | 1.0–3.0 | 1.0–2.5 | 1317 | $2,889 | $2.19 | 15d | 37 | 0.50mi |
| 6775 Gaillardia Dr NW Rochester, MN | 4.0 | 3.0 | 2212 | $2,200 | $0.99 | 15d | 1 | 0.83mi |
| 1446 50th St NW Rochester, MN | 4.0 | 2.0 | 1700 | $2,220 | $1.31 | 46d | 1 | 1.13mi |
| 6251 Fairway Dr NW Rochester, MN | 4.0 | 2.0 | 2212 | $2,525 | $1.14 | 46d | 1 | 1.30mi |
Listing history 25 events
-
2026-05-11status Pending 568-char remark
-
2026-05-07historical Contingent - Inspection 568-char remark
-
2026-05-05$360,000 Active 568-char remark
-
2026-05-01historical $360,000 568-char remark
-
2022-03-29soldstatus $340,000
-
2022-03-18soldstatus $340,000 19-char remark
Show marketing remark (19 chars)
Listed and pending.
-
2022-03-18$335,000 19-char remark
Show marketing remark (19 chars)
Listed and pending.
-
2021-09-09soldstatus $320,000
-
2021-08-20soldstatus $320,000 Sold
Show marketing remark (194 chars)
Roomy 5 bedroom, 2 bath home in awesome neighborhood. 3 bedrooms on main level! Cozy living room with fireplace. Large deck overlooking private backyard. Brand new A/C. Newer siding and windows.
-
2021-07-19status Pending
Show marketing remark (194 chars)
Roomy 5 bedroom, 2 bath home in awesome neighborhood. 3 bedrooms on main level! Cozy living room with fireplace. Large deck overlooking private backyard. Brand new A/C. Newer siding and windows.
-
2021-07-14$309,900 Active
Show marketing remark (194 chars)
Roomy 5 bedroom, 2 bath home in awesome neighborhood. 3 bedrooms on main level! Cozy living room with fireplace. Large deck overlooking private backyard. Brand new A/C. Newer siding and windows.
-
2018-12-10historical
-
2018-12-09historical
-
2013-12-30soldstatus $176,834
-
2013-12-30soldstatus $176,834
-
2013-11-25$176,834
-
2013-11-25$176,834
-
2011-05-11soldstatus $171,000
-
2011-04-29soldstatus $171,000
-
2011-04-29soldstatus $171,000
-
2010-12-30$172,500
-
2010-12-30$172,500
-
2005-06-14soldstatus $175,000
-
1998-05-19soldstatus $108,500
-
1989-11-01soldstatus $21,526
ⓘ Source: listings_history table (triggers on properties + properties_extension) + one-shot
backfill from property_details.listing_events for pre-trigger history.
Tax reassessment forecast MN · Partial reset (capped growth)
- Current annual tax
- $4,248 · $354/mo
- Projected year-2 tax
- $4,248 · $354/mo
- Expected delta
- $0/yr ($0/mo · 0.0%)
ⓘ Screening estimate from a state-policy table — verify with the county assessor before closing.
Climate risk First Street
- Flood 1/10 Low FEMA zone X (unshaded) · 0% chance over 30 yrs
- Wildfire 1/10 Low
- Heat 2/10 Low 7 d/yr ≥99°F today · 15 d/yr by 30 yrs out
- Wind 2/10 Low
- Air quality 2/10 Low 1 unhealthy d/yr today · 1 by 30 yrs out
Nearby sold comps map
Loading sold comps map…
Walkable amenities ~0.75 mi
Loading nearby amenities…
Taxation est. · year 1
- Rental income
- $28,311
- − Mortgage interest
- −$20,166
- − Property taxes
- −$4,248
- − Insurance
- −$1,800
- − Repairs & maintenance
- −$2,265
- − Management
- −$2,265
- − Depreciation
- −$10,473
- Taxable loss
- −$12,905
- Est. tax savings @ 24.0%
- +$3,097
- After-tax cash flow
- $-3,240/yr
For passive investors: Depreciation is non-cash, so a rental often shows a tax loss while cash-flowing — sheltering income. Rental losses are passive: they offset passive income freely, and up to $25,000/yr can offset ordinary (W-2) income if you actively participate and your MAGI is under $100k (phasing out to $0 by $150k); unused losses carry forward. On sale, claimed depreciation is recaptured at up to 25%, and gains may owe capital-gains tax (a 1031 exchange can defer both). Figures are a year-1 estimate at your 24.0% rate — not tax advice; consult a CPA.
Schools (NCES district)
- District
- Rochester Public School District
- NCES district ID
- 2731800
- Math proficiency
- 40% ▼ -10.00%
- Reading proficiency
- 51% ▼ -4.00%
- Median HH income
- $66,540
- Composite
- 40.6/100
- National rank
- #3695
- State rank
- #152 of 301 in MN
Livability — Rochester
- Score
- 92/100
- State rank
- #1
- US rank
- #27
Category grades
Schools grade is shown separately in the Schools card above.
Census & demographics
- Census place
- Rochester, MN
- County
- Olmsted County · 135,035 people
- City population
- 135,035
- Metro
- Rochester, MN
- Population (ZIP)
- 58,495
- Household income
- $94,607
- Rent vs Own
- Severe rent burden
- 1651.0
Population outlook (Olmsted County) Hauer SSP2
- Today (2025)
- 165,999 people
- By 2030
- 172,425 · +3.9%
- By 2040
- 183,785 · +10.7%
- By 2050
- 192,981 · +16.3%
- By 2075
- 215,284 · +29.7%
- By 2100
- 224,887 · +35.5%
Race, ethnicity, and origin ACS 2023
- Neighborhood character
- Predominantly White (71%)
- Race & ethnicity
- White 71% Black 12% Asian 8% Two or more races 6% Hispanic / Latino 5%
- Hispanic origin (detail)
- Mexican 3%
- Common ancestry
- Portuguese 11% Romanian 3% Iranian 2%
- Foreign-born
- 15% · Canada, Vietnam, China
- Languages at home
- 81% English-only · Spanish 3% Other Asian/Pacific 3% Arabic 2%
Political lean MEDSL · Olmsted
- 2024 margin
- D (+10.7) · D 54.3% · R 43.6% · Other 2.1%
- 2008→2024 swing
- +7.4pp toward D · 2008: 3.3pp · 2024: 10.7pp
- All cycles
- 2024: D+10.7 2020: D+10.7 2016: D+0.8 2012: D+3.2 2008: D+3.3
Not yet ingested
- Civics
- —
Market trends
- HPI YoY
- ▼ -126.08%
- Current HPI
- 253.7999
- Rent YoY
- ▲ 2.18%
- Metro
- Rochester, MN
- State GDP YoY
- ▲ 2.41%
- F500 in state
- 34
Industry mix (Fortune 500 HQ in MN)
| Industry | F500 HQs | Revenue |
|---|---|---|
| Healthcare | 2 | $407B |
|
||
| Retail | 2 | $150B |
|
||
| Consumer Goods | 2 | $32B |
|
||
| Industrial Machinery | 2 | $6B |
|
||
| Agriculture | 1 | $40B |
|
||
| Healthcare / Medical Devices | 1 | $32B |
|
||
Price history
+1572.4% since first listed25 events — show timeline
- 2026-05-11 Pending — NORTHSTARMLS as Distributed by MLS Grid
- 2026-05-07 Contingent — NORTHSTARMLS as Distributed by MLS Grid
- 2026-05-05 Listed $360,000 NORTHSTARMLS as Distributed by MLS Grid
- 2026-05-01 Coming Soon $360,000 NORTHSTARMLS as Distributed by MLS Grid
- 2022-03-29 Sold (Public Records) $340,000 Public Records
- 2022-03-18 Listed $335,000 NORTHSTARMLS as Distributed by MLS Grid
- 2022-03-18 Sold (MLS) $340,000 NORTHSTARMLS as Distributed by MLS Grid
- 2021-09-09 Sold (Public Records) $320,000 Public Records
- 2021-08-20 Sold (MLS) $320,000 NORTHSTARMLS as Distributed by MLS Grid
- 2021-07-19 Pending — NORTHSTARMLS as Distributed by MLS Grid
- 2021-07-14 Listed $309,900 NORTHSTARMLS as Distributed by MLS Grid
- 2018-12-10 Listing Removed — NORTHSTARMLS as Distributed by MLS Grid
- 2018-12-09 Listing Removed — NORTHSTARMLS as Distributed by MLS Grid
- 2013-12-30 Sold (MLS) $176,834 NORTHSTARMLS as Distributed by MLS Grid
- 2013-12-30 Sold (MLS) $176,834 NORTHSTARMLS as Distributed by MLS Grid
- 2013-11-25 Listed $176,834 NORTHSTARMLS as Distributed by MLS Grid
- 2013-11-25 Listed $176,834 NORTHSTARMLS as Distributed by MLS Grid
- 2011-05-11 Sold (Public Records) $171,000 Public Records
- 2011-04-29 Sold (MLS) $171,000 NORTHSTARMLS as Distributed by MLS Grid
- 2011-04-29 Sold (MLS) $171,000 NORTHSTARMLS as Distributed by MLS Grid
- 2010-12-30 Listed $172,500 NORTHSTARMLS as Distributed by MLS Grid
- 2010-12-30 Listed $172,500 NORTHSTARMLS as Distributed by MLS Grid
- 2005-06-14 Sold (Public Records) $175,000 Public Records
- 1998-05-19 Sold (Public Records) $108,500 Public Records
- 1989-11-01 Sold (Public Records) $21,526 Public Records
Property tax history
+6.9%/yrLatest (2025): $4,248 · +12.1% YoY. Source: county tax records.
Cash-flow waterfall
monthlySold comps — $/sqft
last 12 mo · ≤1 miLoading sold comps…