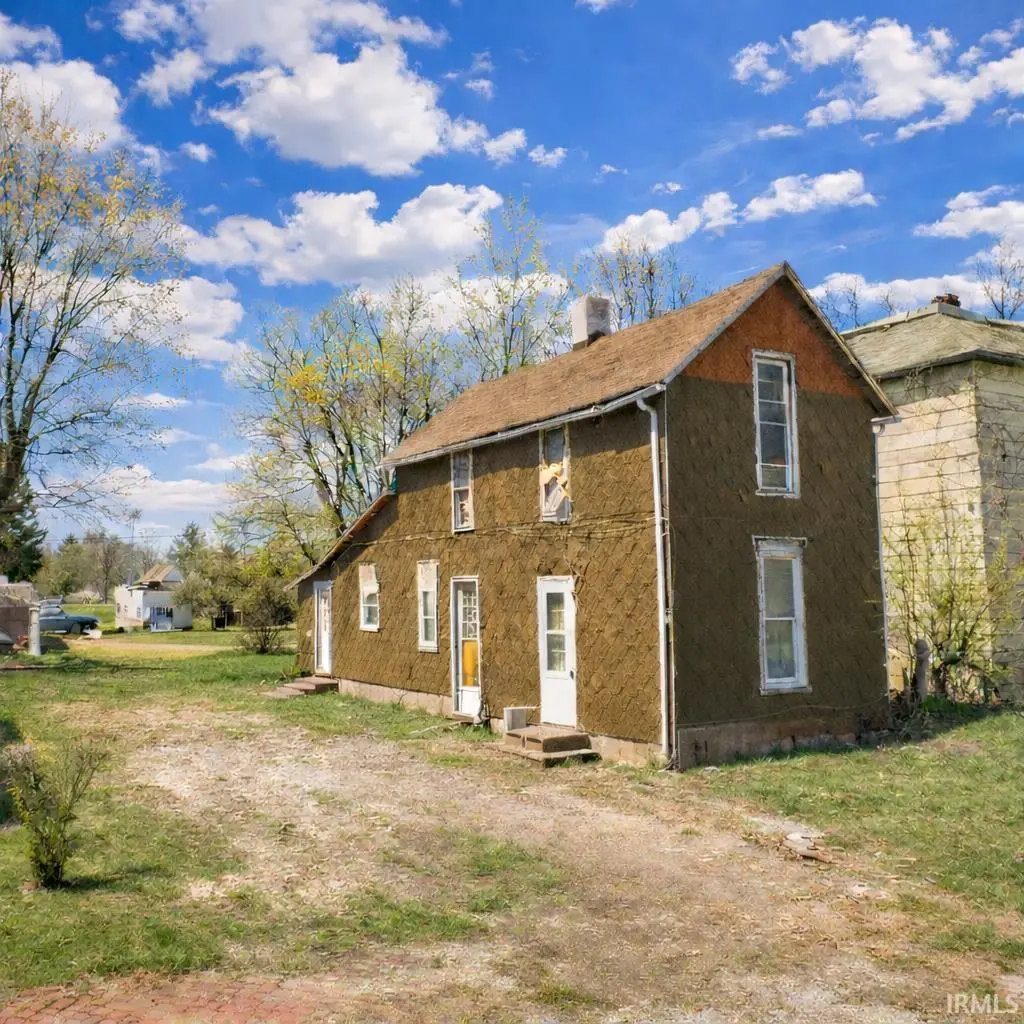
1916 S George St · Marion, IN
Flood risk 6/10 · Moderate
- FEMA flood zone
- X (unshaded)
- Chance of flooding over 30 yrs
- 0.54%
- Est. flood insurance / yr
- $507 – $1,088
Fire risk 1/10 · Minimal
- Est. fire insurance / yr
- $717 – $1,331
Heat risk 3/10 · Minor
- Hot days now (above 100°F)
- 7 days/yr
- Hot days in 30 yrs
- 18 days/yr
Wind risk 2/10 · Minimal
- Chance of severe wind over 30 yrs
- —
Air-quality risk 2/10 · Minimal
- Unhealthy air days now
- 1 days/yr
- Unhealthy air days in 30 yrs
- 2 days/yr
Risk factors via First Street. Map © Google.
Why this score? — see what drove the D grade
The composite is a weighted blend of 9 inputs, each scored 0–100. Each bar is that input's sub-score; the figure is the points it added to the 100-point composite (weight × sub-score).
- Cash flow +15.0/30.0
- ARV discount +7.5/15.0
- 1% rule +5.0/10.0
- DSCR +5.0/10.0
- Livability +3.2/5.0
- Rent growth +2.5/5.0
- Condition / age +2.5/5.0
- Schools +1.7/10.0
- Appreciation +0.0/10.0
$10,799
🖨 Deal sheet (PDF) 📄 Offer letter ✓ Due diligence
Listing remarks
This single family home in Marion, Indiana offers a great opportunity for investors looking to add value. With a one and a half story layout, the property features 2 bedrooms and 1 bathroom on a 0.14-acre lot. (as-is, handyman special, investor special)
Key facts
- 6,098 sq ft lot
- Built 1900
- Listed 36 days
Property features AI
Exterior
- Utilities: Public water; Public sewer
- Home design: Single-family site-built home; One story
- Construction: Asphalt construction material
- Exterior features: Level lot
Interior
- Bathrooms: 1 full bathroom (main level)
- Heating & cooling: Natural gas forced-air heating; Central air conditioning
- Interior features: 6 total rooms; Crawl space basement; Main-level laundry
- Laundry & utility: Laundry on the main level
Neighborhood map
What this means for you Summary
Snapshot
- This is a 2-bed/1.0-bath single-family listed at $11k.
Deal economics
- At list price, monthly cash flow is $621 ($7k/yr) — positive.
- The deal already cash-flows at list — no discount required.
- Meets the 1% rule at list price ($901 rent vs $11k).
- Recommended offer: $10k (3.0% below list) — sets the bar for market timing.
- Cap rate 75.3% vs local median 8.2% in Marion — top-decile yield for the area; either an underpriced asset or a hidden risk that comps aren't pricing in. Stress-test before assuming the spread holds.
Location & tenants
- Location reads 65/100 on livability (#337 in IN) — a middle-class / working-renter tenant base. Strengths: crime A+, cost of living A+, housing A+; Watch: amenities F, commute F, employment F.
- Marion Community Schools (town): math 18% / reading 24% proficiency, ranked #277 of 301 in IN (top 92%) — low school quality limits family demand, transient renter base, plan for 1-2y turnover; 67% free/reduced lunch — lower-income household profile, screen leases tightly.
- Zoned schools: Allen Elementary School (math 22% / reading 17%, grade F, #814 of 994 statewide, top 83%, 399 students, 84% FRL); John L Mcculloch Junior High Sch (math 11% / reading 22%, grade F, #287 of 330 statewide, top 88%, 524 students, 74% FRL); Marion High School (math 12% / reading 47%, grade F, #308 of 369 statewide, top 84%, 1,050 students, 66% FRL).
- Market conditions: 114 active listings in the ZIP; 2 comparable units currently listed for rent nearby; 52 units permitted in Grant County in 2024 (8 in 5+ unit buildings).
Forward outlook
- Local home prices are declining (-3.0%/yr); year-one equity from $74 of loan paydown is wiped out by about $324 of value loss. Plan a longer hold.
- Grant County population projected at -18% by 2050 — secular population decline; favor cash flow + early exit over multi-decade hold.
- At projected returns (-3.0% appreciation + 3.0% rent growth), your $3k cash investment doubles in ~1 year — after that, you're playing with house money.
Negotiation context
- It's been on market 36 days — a 3% lower offer ($10k) is reasonable based on typical stale-listing flexibility.
- 3 sale attempts; this cycle's ask has dropped $1k (10%) from the opening price — seller is motivated, your offer sets the floor, not the list.
Risks & watch-outs
- Watch-outs: property tax is 3.4% of price; built in 1900 — expect roof / HVAC / electrical / plumbing capex.
- Climate carrying-cost: major flood risk — expect insurance premiums to compound above CPI over the hold.
Questions for the listing agent
- It's been on market 36 days. Have you received any prior offers? Is the seller open to a 3% concession, seller financing, or rate buy-down credit?
- Built in 1900 — when were the roof, HVAC, electrical panel, plumbing, and water heater last replaced?
- Property tax is high relative to price — has the assessment been appealed recently, and will the sale trigger a re-assessment?
- Is there a deadline driving the sale (1031 exchange, divorce, estate, relocation)? That informs how much negotiation room exists.
- Schools are F-rated, which usually means shorter tenancies and higher turnover. Who's the typical renter profile here, and what's been the actual vacancy rate?
- The area grade is low — what's the realistic commute time and amenity access for the typical tenant pool here? Any planned neighborhood developments (good or bad) we should know about?
- What's the average days-on-market for RENTAL listings here right now (not sales)? A rising rental-DOM trend means longer vacancies and softer asking-rent achievability than the comps imply.
- What's the recent tenant-quality profile in this submarket — average credit score on applications, eviction rate, late-payment / NSF rate, and stable-employment percentage? A property-management company in the area should have these aggregated.
- How much new for-sale + rental construction is in the pipeline within 1–3 miles? Heavy new supply typically softens prices + rents 12–24 months out; constrained supply supports both.
Investment metrics
- 1% rule
- 8.35% ✓
- Cap rate
- 75.26%
- Cash-on-cash
- 246.32%
- DSCR
- 11.96
- GRM
- 1.0
CMA / ARV
- ARV (median comp)
- $83,089
- List price
- $10,799
- Delta
- -87.00%
- Verdict
- UNDERPRICED
- Comps
- 20 within 1.0 mi
Show comp detail 12 sales within ~0.75 mi
| Address | Dist | Beds/Ba | Sqft | Sold | Price | $/sf | Match |
|---|---|---|---|---|---|---|---|
| 1616 S Mcclure St | 0.32mi | 2/1.0 | 972 (-9%) | 2mo | $20,000 | $21 | 69 |
| 2114 S Branson St | 0.34mi | 3/1.5 (+1) | 1,000 (-6%) | 10mo | $120,000 | $120 | 58 |
| 703 E 28th St | 0.50mi | 3/1.0 (+1) | 1,085 (+2%) | 18mo | $59,192 | $55 | 54 |
| 1002 E 28th St | 0.56mi | 3/1.0 (+1) | 1,162 (+9%) | 0mo | $22,750 | $20 | 53 |
| 2910 S Brownlee St | 0.62mi | 3/1.0 (+1) | 1,015 (-5%) | 10mo | $10,250 | $10 | 50 |
| 617 E 27th St | 0.45mi | 3/1.0 (+1) | 1,212 (+14%) | 2mo | $40,000 | $33 | 49 |
| 2500 S Waite St | 0.39mi | 3/1.0 (+1) | 1,180 (+11%) | 13mo | $47,000 | $40 | 48 |
| 1122 E 27th St | 0.56mi | 3/1.0 (+1) | 976 (-8%) | 9mo | $108,500 | $111 | 47 |
| 820 E 30th St | 0.64mi | 1/1.0 (-1) | 1,104 (+4%) | 14mo | $72,000 | $65 | 47 |
| 2602 S Adams St | 0.56mi | 3/1.5 (+1) | 1,024 (-4%) | 17mo | $33,500 | $33 | 47 |
| 1818 S Nebraska St | 0.67mi | 3/1.0 (+1) | 960 (-10%) | 12mo | $97,000 | $101 | 38 |
| 2916 S Adams St | 0.72mi | 2/1.0 | 968 (-9%) | 19mo | $36,000 | $37 | 36 |
Match score weights: distance 35% · size 25% · config 20% · recency 20%. Top-matched comps best support the ARV.
Projected returns pro-forma
-3.0% appreciation · 3.0% rent growth · sell at horizon
- IRR
- —
- Equity multiple
- 13.50×
- Total profit
- $37,805
- Equity at exit
- $1,610
- IRR
- —
- Equity multiple
- 28.75×
- Total profit
- $83,919
- Equity at exit
- $934
Cash invested: $3,024 (down + closing). Projections, not guarantees.
Landlord ↔ Tenant lean methodology
- Overall (STATE)
- 90 Strongly Landlord-Friendly
- State Indiana
- 90 Strongly Landlord-Friendly · R+11
- County
- — inherits STATE
- City
- — inherits STATE
ZIP-level market 46953
- Home prices YoY
- -23.4%
- Active inventory
- 114
- Price-to-rent
- 1.0×
Monthly cashflow live
- Estimated rent
- $901 medium interval (Pro) →
- Mortgage (P&I)
- −$57
- Tax from tax record
- −$30 /mo · $364/yr
- Insurance
- −$4
- HOA
- −$0
- Vacancy / Maint / Mgmt
- −$189
- Net cashflow
- $621
Break-even live
Sensitivity live
| Price | -10% $627 | -5% $624 | +0% $621 | +5% $618 | +10% $615 |
|---|---|---|---|---|---|
| Rent | -10% $549 | -5% $585 | +0% $621 | +5% $656 | +10% $692 |
| Rate | -1.0pp $626 | -0.5pp $623 | base $621 | +0.5pp $618 | +1.0pp $615 |
UW: 25.0% down · 7.5% · 30yr · 1.5% tax · 5.0% vac · 8.0% maint · 8.0% mgmt
Financing live
Cash to close
- Down payment
- $2,700
- Closing costs
- $324
- Reserves months
- —
- Total cash needed
- —
Loan-product check · same deal, 3 products live
Conventional
25% down · 7.5% · 30yr
- Down + closing
- —
- Monthly P&I
- —
- Monthly cashflow
- —
- DSCR
- —
- Eligible?
- —
Personal DTI + credit; lowest rate.
DSCR
20% down · 8.5% · 30yr
- Down + closing
- —
- Monthly P&I
- —
- Monthly cashflow
- —
- DSCR
- —
- Eligible?
- —
No personal income docs; deal must DSCR.
Hard money
10% down · 12.0% · 12mo
- Down + closing
- —
- Monthly P&I
- —
- Monthly cashflow
- —
- DSCR
- —
- Eligible?
- —
Short-term bridge; refi at stabilization.
Rent comps 2 comps
| Address | Beds | Baths | Sqft | Rent | $/sqft | DOM | Units | Dist |
|---|---|---|---|---|---|---|---|---|
| 703 E 28th St Marion, IN | 2.0 | 1.0 | 1085 | $1,200 | $1.11 | 45d | 1 | 0.49mi |
| 2516 S Washington St Unit 1 Marion, IN | 1.0 | 1.0 | 800 | $675 | $0.84 | 45d | 1 | 0.59mi |
Listing history 23 events
-
2026-06-02pricedays on market $10,799 Active 36 DOM
-
2026-06-01days on market $10,899 Active 35 DOM
-
2026-05-31days on market $10,899 Active 34 DOM
-
2026-05-30days on market $10,899 Active 33 DOM
-
2026-05-15price $11,430 253-char remark
-
2026-05-11price $11,530 253-char remark
-
2026-05-06price $11,630 253-char remark
-
2026-04-27$11,990 Active 253-char remark
-
2026-04-13status Active
-
2026-04-13price $11,990
-
2026-04-09price $11,999
-
2026-04-02price $12,897
-
2026-03-23price $12,997
-
2026-03-17price $13,997
-
2026-03-10price $13,998
-
2026-03-06price $13,999
-
2026-03-02price $14,999
-
2026-02-23price $16,741
-
2026-02-16price $18,741
-
2026-02-10price $19,321
-
2026-02-04price $19,999
-
2026-01-31price $24,999
-
2026-01-20$29,900 Active
ⓘ Source: listings_history table (triggers on properties + properties_extension) + one-shot
backfill from property_details.listing_events for pre-trigger history.
Tax reassessment forecast IN · Partial reset (capped growth)
- Current annual tax
- $364 · $30/mo
- Projected year-2 tax
- $364 · $30/mo
- Expected delta
- $0/yr ($0/mo · 0.0%)
ⓘ Screening estimate from a state-policy table — verify with the county assessor before closing.
Climate risk First Street
- Flood 6/10 Major FEMA zone X (unshaded) · 54% chance over 30 yrs
- Wildfire 1/10 Low
- Heat 3/10 Moderate 7 d/yr ≥100°F today · 18 d/yr by 30 yrs out
- Wind 2/10 Low
- Air quality 2/10 Low 1 unhealthy d/yr today · 2 by 30 yrs out
Nearby sold comps map
Loading sold comps map…
Walkable amenities ~0.75 mi
Loading nearby amenities…
Taxation est. · year 1
- Rental income
- $10,817
- − Mortgage interest
- −$605
- − Property taxes
- −$364
- − Insurance
- −$54
- − Repairs & maintenance
- −$865
- − Management
- −$865
- − Depreciation
- −$314
- Taxable income
- $7,749
- Est. tax owed @ 24.0%
- −$1,860
- After-tax cash flow
- $5,588/yr
For passive investors: Depreciation is non-cash, so a rental often shows a tax loss while cash-flowing — sheltering income. Rental losses are passive: they offset passive income freely, and up to $25,000/yr can offset ordinary (W-2) income if you actively participate and your MAGI is under $100k (phasing out to $0 by $150k); unused losses carry forward. On sale, claimed depreciation is recaptured at up to 25%, and gains may owe capital-gains tax (a 1031 exchange can defer both). Figures are a year-1 estimate at your 24.0% rate — not tax advice; consult a CPA.
Schools (NCES district)
- District
- Marion Community Schools
- NCES district ID
- 1806390
- Math proficiency
- 18% ▼ -9.00%
- Reading proficiency
- 24% ▼ -6.00%
- Median HH income
- $33,415
- Composite
- 17.13/100
- National rank
- #9115
- State rank
- #277 of 301 in IN
Livability — Marion
- Score
- 65/100
- State rank
- #337
- US rank
- #13006
Category grades
Schools grade is shown separately in the Schools card above.
Census & demographics
- Census place
- Marion, IN
- County
- Grant County · 41,561 people
- City population
- 41,561
- Metro
- Marion, IN
- Population (ZIP)
- 23,372
- Household income
- $46,288
- Rent vs Own
- Severe rent burden
- 597.0
Population outlook (Grant County) Hauer SSP2
- Today (2025)
- 64,394 people
- By 2030
- 62,145 · -3.5%
- By 2040
- 57,252 · -11.1%
- By 2050
- 52,968 · -17.7%
- By 2075
- 45,986 · -28.6%
- By 2100
- 39,400 · -38.8%
Race, ethnicity, and origin ACS 2023
- Neighborhood character
- Predominantly White (77%)
- Race & ethnicity
- White 77% Black 10% Two or more races 9% Hispanic / Latino 6%
- Hispanic origin (detail)
- Mexican 4%
- Common ancestry
- Italian 3% Iranian 1% Slovak 1%
- Foreign-born
- 2% · Canada
- Languages at home
- 96% English-only · Spanish 3%
Political lean MEDSL · Grant
- 2024 margin
- Solid R (+41.8) · D 28.2% · R 70.0% · Other 1.9%
- 2008→2024 swing
- -28.7pp toward R · 2008: -13.1pp · 2024: -41.8pp
- All cycles
- 2024: R+41.8 2020: R+38.8 2016: R+39.5 2012: R+22.0 2008: R+13.1
Not yet ingested
- Civics
- —
Market trends
- HPI YoY
- ▼ -52.47%
- Current HPI
- 171.7246
- Rent YoY
- —
- Metro
- Marion, IN
- State GDP YoY
- ▲ 2.90%
- F500 in state
- 18
Industry mix (Fortune 500 HQ in IN)
| Industry | F500 HQs | Revenue |
|---|---|---|
| Industrial Machinery | 2 | $37B |
|
||
| Healthcare | 1 | $177B |
|
||
| Pharmaceuticals | 1 | $45B |
|
||
| Metals / Steel | 1 | $18B |
|
||
| Agriculture | 1 | $17B |
|
||
| Packaging | 1 | $12B |
|
||
Price history
-64.2% since first listed24 events — show timeline
- 2026-06-05 Price Changed $10,699 IRMLS
- 2026-06-01 Price Changed $10,799 IRMLS
- 2026-05-27 Price Changed $10,899 IRMLS
- 2026-05-22 Price Changed $10,900 IRMLS
- 2026-05-19 Price Changed $10,999 IRMLS
- 2026-05-15 Price Changed $11,430 IRMLS
- 2026-05-11 Price Changed $11,530 IRMLS
- 2026-05-06 Price Changed $11,630 IRMLS
- 2026-04-27 Listed $11,990 IRMLS
- 2026-04-13 Relisted — IRMLS
- 2026-04-13 Price Changed $11,990 IRMLS
- 2026-04-09 Price Changed $11,999 IRMLS
- 2026-04-02 Price Changed $12,897 IRMLS
- 2026-03-23 Price Changed $12,997 IRMLS
- 2026-03-17 Price Changed $13,997 IRMLS
- 2026-03-10 Price Changed $13,998 IRMLS
- 2026-03-06 Price Changed $13,999 IRMLS
- 2026-03-02 Price Changed $14,999 IRMLS
- 2026-02-23 Price Changed $16,741 IRMLS
- 2026-02-16 Price Changed $18,741 IRMLS
- 2026-02-10 Price Changed $19,321 IRMLS
- 2026-02-04 Price Changed $19,999 IRMLS
- 2026-01-31 Price Changed $24,999 IRMLS
- 2026-01-20 Listed $29,900 IRMLS
Property tax history
+8.1%/yrLatest (2025): $364 · +7.1% YoY. Source: county tax records.
Cash-flow waterfall
monthlySold comps — $/sqft
last 12 mo · ≤1 miLoading sold comps…