4986 S 2000 W #4 · Rexburg, ID
Flood risk No data
- FEMA flood zone
- —
- Chance of flooding over 30 yrs
- —
- Est. flood insurance / yr
- —
Fire risk No data
- Est. fire insurance / yr
- —
Heat risk No data
- Hot days now (above threshold)
- —
- Hot days in 30 yrs
- —
Wind risk No data
- Chance of severe wind over 30 yrs
- —
Air-quality risk No data
- Unhealthy air days now
- —
- Unhealthy air days in 30 yrs
- —
Risk factors via First Street. Map © Google.
Why this score? — see what drove the B grade
The composite is a weighted blend of 9 inputs, each scored 0–100. Each bar is that input's sub-score; the figure is the points it added to the 100-point composite (weight × sub-score).
- Cash flow +30.0/30.0
- 1% rule +10.0/10.0
- DSCR +10.0/10.0
- ARV discount +7.5/15.0
- Livability +3.8/5.0
- Schools +3.7/10.0
- Rent growth +3.2/5.0
- Condition / age +2.5/5.0
- Appreciation +0.0/10.0
$58,900
🖨 Deal sheet (PDF) 📄 Offer letter ✓ Due diligence
Listing remarks
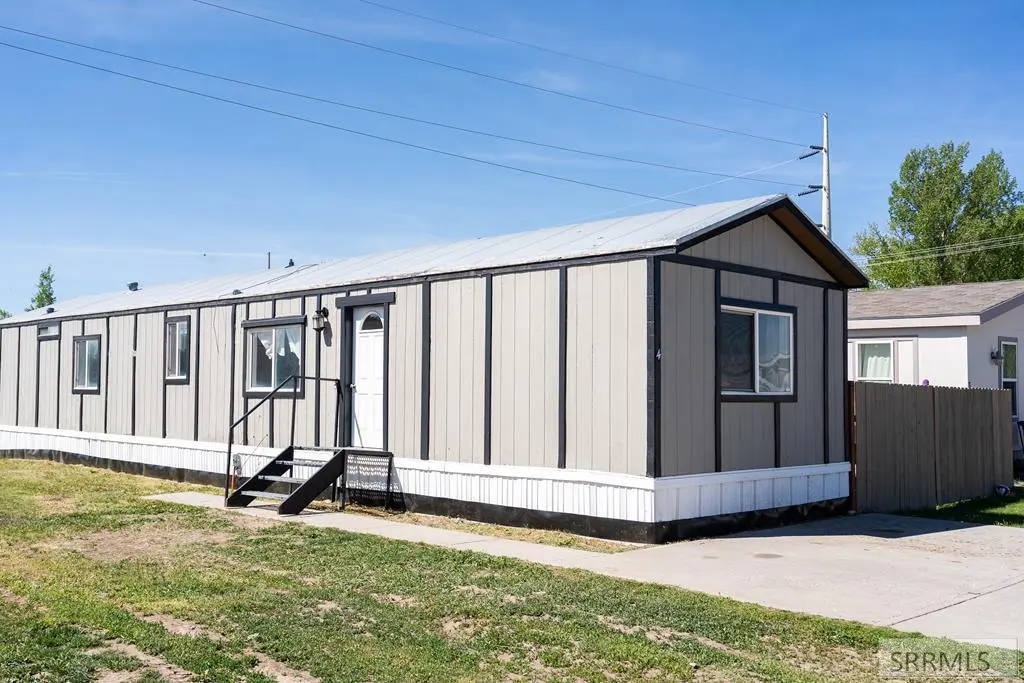
Welcome to this wonderful 1984 single-wide trailer home situated in a quiet park close to town. With a spacious 950 sq. ft layout, this home offers comfortable living with modern amenities and thoughtful design. Upon entrance of the home, there is a full size bathroom and large bedroom on the right. Enjoy the substantial living area with built in shelves for decoration and storage. The kitchen is equipped with raised panel cabinet doors, backsplash, and a fridge. Washer and dryer are included with the home as you head into the primary suite you will appreciate a Jack and Jill bathroom with a vanity and a high pressure shower. Vaulted ceilings create an open feel and plenty of hard surface
Key facts
- Full size bathroom
- Large bedroom
- Built in shelves
Tags
Property features AI
Finance
- HOA & community: Homeowners association with a $452 monthly fee
Exterior
- Parking: Concrete parking
- Utilities: Public water; Septic tank
- Home design: Single-family residence; One story
- Construction: Metal siding
- Exterior features: Metal roof
Interior
- Kitchen: Dishwasher; Microwave; Refrigerator
- Flooring: Carpet; Laminate
- Bathrooms: 2 full bathrooms
- Heating & cooling: Electric heating
- Interior features: Laminate counters
- Laundry & utility: Washer; Crawl space basement
Neighborhood map
What this means for you Summary
Snapshot
- This is a 3-bed/2.0-bath manufactured listed at $59k.
Deal economics
- At list price, monthly cash flow is $303 ($4k/yr) — positive.
- The deal already cash-flows at list — no discount required.
- Meets the 1% rule at list price ($1k rent vs $59k).
- Recommended offer: $58k (1.5% below list) — sets the bar for market timing.
Location & tenants
- Location reads 76/100 on livability (#25 in ID, #3,515 nationally) — a middle-class / working-renter tenant base. Strengths: crime A+, amenities A+, health & safety A+; Watch: housing C-, commute F, employment F.
- Madison District (town): math 44% / reading 47% proficiency, ranked #50 of 92 in ID (top 54%) — families likely to look elsewhere, expect single-tenant / working-renter base with shorter leases.
- Zoned schools: South Fork Elementary (math 52% / reading 42%, grade D-, #176 of 357 statewide, top 53%, 293 students, 43% FRL) — zoned schools average 43% FRL vs 27% district-wide (16 pts higher); higher-poverty schools than district average — tighter screening recommended.
- Market conditions: Rents rising (+2.6%/yr); 384 active listings in the ZIP; 274 units permitted in Madison County in 2024 (80 in 5+ unit buildings).
Forward outlook
- Local home prices are declining (-3.0%/yr); year-one equity from $407 of loan paydown is wiped out by about $2k of value loss. Plan a longer hold.
- Madison County population projected at +10% by 2050 — modest demand growth; plan on rents tracking national, not racing it.
- At projected returns (-3.0% appreciation + 2.6% rent growth), your $16k cash investment doubles in ~6 years — after that, you're playing with house money.
Negotiation context
- It's been on market 18 days — a 2% lower offer ($58k) is reasonable based on typical stale-listing flexibility.
Risks & watch-outs
- Watch-outs: HOA is 32% of rent.
Questions for the listing agent
- What does the HOA fee cover, when was the last increase, and are there any pending special assessments or reserve-fund shortfalls?
- Is there a deadline driving the sale (1031 exchange, divorce, estate, relocation)? That informs how much negotiation room exists.
- Schools are B-rated — typically a magnet for longer-tenancy family renters. What's the average tenant stay here, and is there a school-zone premium baked into asking?
- What's the average days-on-market for RENTAL listings here right now (not sales)? A rising rental-DOM trend means longer vacancies and softer asking-rent achievability than the comps imply.
- What's the recent tenant-quality profile in this submarket — average credit score on applications, eviction rate, late-payment / NSF rate, and stable-employment percentage? A property-management company in the area should have these aggregated.
- How much new for-sale + rental construction is in the pipeline within 1–3 miles? Heavy new supply typically softens prices + rents 12–24 months out; constrained supply supports both.
Investment metrics
- 1% rule
- 2.37% ✓
- Cap rate
- 12.47%
- Cash-on-cash
- 22.07%
- DSCR
- 1.98
- GRM
- 3.5
CMA / ARV
No comps found within radius.
Projected returns pro-forma
-3.0% appreciation · 2.6% rent growth · sell at horizon
- IRR
- 14.4%
- Equity multiple
- 1.57×
- Total profit
- $9,480
- Equity at exit
- $8,782
- IRR
- 22.9%
- Equity multiple
- 2.94×
- Total profit
- $31,922
- Equity at exit
- $5,093
Cash invested: $16,492 (down + closing). Projections, not guarantees.
Landlord ↔ Tenant lean methodology
- Overall (STATE)
- 91 Strongly Landlord-Friendly
- State Idaho
- 91 Strongly Landlord-Friendly · R+18
- County
- — inherits STATE
- City
- — inherits STATE
ZIP-level market 83440
- Rents YoY
- 2.6%
- Active inventory
- 384
- Price-to-rent
- 3.5×
Monthly cashflow live
- Estimated rent
- $1,394 medium interval (Pro) →
- Mortgage (P&I)
- −$309
- Tax from tax record
- −$12 /mo · $145/yr
- Insurance
- −$25
- HOA
- −$452
- Vacancy / Maint / Mgmt
- −$293
- Net cashflow
- $303
Break-even live
Sensitivity live
| Price | -10% $337 | -5% $320 | +0% $303 | +5% $287 | +10% $270 |
|---|---|---|---|---|---|
| Rent | -10% $193 | -5% $248 | +0% $303 | +5% $358 | +10% $413 |
| Rate | -1.0pp $333 | -0.5pp $318 | base $303 | +0.5pp $288 | +1.0pp $273 |
UW: 25.0% down · 7.5% · 30yr · 1.5% tax · 5.0% vac · 8.0% maint · 8.0% mgmt
Financing live
Cash to close
- Down payment
- $14,725
- Closing costs
- $1,767
- Reserves months
- —
- Total cash needed
- —
Loan-product check · same deal, 3 products live
Conventional
25% down · 7.5% · 30yr
- Down + closing
- —
- Monthly P&I
- —
- Monthly cashflow
- —
- DSCR
- —
- Eligible?
- —
Personal DTI + credit; lowest rate.
DSCR
20% down · 8.5% · 30yr
- Down + closing
- —
- Monthly P&I
- —
- Monthly cashflow
- —
- DSCR
- —
- Eligible?
- —
No personal income docs; deal must DSCR.
Hard money
10% down · 12.0% · 12mo
- Down + closing
- —
- Monthly P&I
- —
- Monthly cashflow
- —
- DSCR
- —
- Eligible?
- —
Short-term bridge; refi at stabilization.
HOA detail
- Monthly dues
- $452 · $5,424/yr
Listing history 2 events
-
2026-05-30statusdays on market $58,900 Pending 18 DOM
-
2026-05-12$58,900 Active
ⓘ Source: listings_history table (triggers on properties + properties_extension) + one-shot
backfill from property_details.listing_events for pre-trigger history.
Tax reassessment forecast ID · Resets to sale price
- Current annual tax
- $145 · $12/mo
- Projected year-2 tax
- $406 · $34/mo
- Expected delta
- +$261/yr (+$22/mo · 180.3%)
ⓘ Screening estimate from a state-policy table — verify with the county assessor before closing.
Nearby sold comps map
Loading sold comps map…
Walkable amenities ~0.75 mi
Loading nearby amenities…
Taxation est. · year 1
- Rental income
- $16,722
- − Mortgage interest
- −$3,299
- − Property taxes
- −$145
- − Insurance
- −$294
- − Repairs & maintenance
- −$1,338
- − Management
- −$1,338
- − HOA
- −$5,424
- − Depreciation
- −$1,713
- Taxable income
- $3,170
- Est. tax owed @ 24.0%
- −$761
- After-tax cash flow
- $2,880/yr
For passive investors: Depreciation is non-cash, so a rental often shows a tax loss while cash-flowing — sheltering income. Rental losses are passive: they offset passive income freely, and up to $25,000/yr can offset ordinary (W-2) income if you actively participate and your MAGI is under $100k (phasing out to $0 by $150k); unused losses carry forward. On sale, claimed depreciation is recaptured at up to 25%, and gains may owe capital-gains tax (a 1031 exchange can defer both). Figures are a year-1 estimate at your 24.0% rate — not tax advice; consult a CPA.
Schools (NCES district)
- District
- Madison District
- NCES district ID
- 1601920
- Math proficiency
- 44% ▲ 2.00%
- Reading proficiency
- 47% ▼ -3.00%
- Median HH income
- $31,737
- Composite
- 37.3/100
- National rank
- #4447
- State rank
- #50 of 92 in ID
Livability — Rexburg
- Score
- 76/100
- State rank
- #25
- US rank
- #3515
Category grades
Schools grade is shown separately in the Schools card above.
Census & demographics
- County
- Madison County · 51,421 people
- City population
- 51,421
- Metro
- Rexburg, ID
- Population (ZIP)
- 51,421
- Household income
- $58,159
- Rent vs Own
- Severe rent burden
- 1480.0
Population outlook (Madison County) Hauer SSP2
- Today (2025)
- 40,126 people
- By 2030
- 41,845 · +4.3%
- By 2040
- 42,742 · +6.5%
- By 2050
- 44,170 · +10.1%
- By 2075
- 43,379 · +8.1%
- By 2100
- 41,607 · +3.7%
Race, ethnicity, and origin ACS 2023
- Neighborhood character
- Predominantly White (84%)
- Race & ethnicity
- White 84% Hispanic / Latino 10% Two or more races 6% Asian 2%
- Hispanic origin (detail)
- Mexican 6%
- Common ancestry
- Italian 5% Slovak 5% Portuguese 2%
- Foreign-born
- 5% · Canada, China
- Languages at home
- 90% English-only · Spanish 7% Chinese 1% Other Indo-European 1%
Political lean MEDSL · Madison
- 2024 margin
- Solid R (+64.3) · D 15.9% · R 80.2% · Other 3.8%
- 2008→2024 swing
- +8.5pp toward D · 2008: -72.8pp · 2024: -64.3pp
- All cycles
- 2024: R+64.3 2020: R+63.7 2016: R+49.3 2012: R+87.5 2008: R+72.8
Not yet ingested
- Civics
- —
Market trends
- HPI YoY
- ▼ -133.02%
- Current HPI
- 241.1775
- Rent YoY
- ▲ 2.60%
- Metro
- Rexburg, ID
- State GDP YoY
- ▲ 4.51%
- F500 in state
- 6
Industry mix (Fortune 500 HQ in ID)
| Industry | F500 HQs | Revenue |
|---|---|---|
| Retail | 1 | $79B |
|
||
| Technology | 1 | $25B |
|
||
| Food / Agriculture | 1 | $6B |
|
||
Price history
1 event — show timeline
- 2026-05-12 Listed $58,900 SRMLS
Property tax history
+6.0%/yrLatest (2016): $145 · +12.4% YoY. Source: county tax records.
Cash-flow waterfall
monthlySold comps — $/sqft
last 12 mo · ≤1 miLoading sold comps…