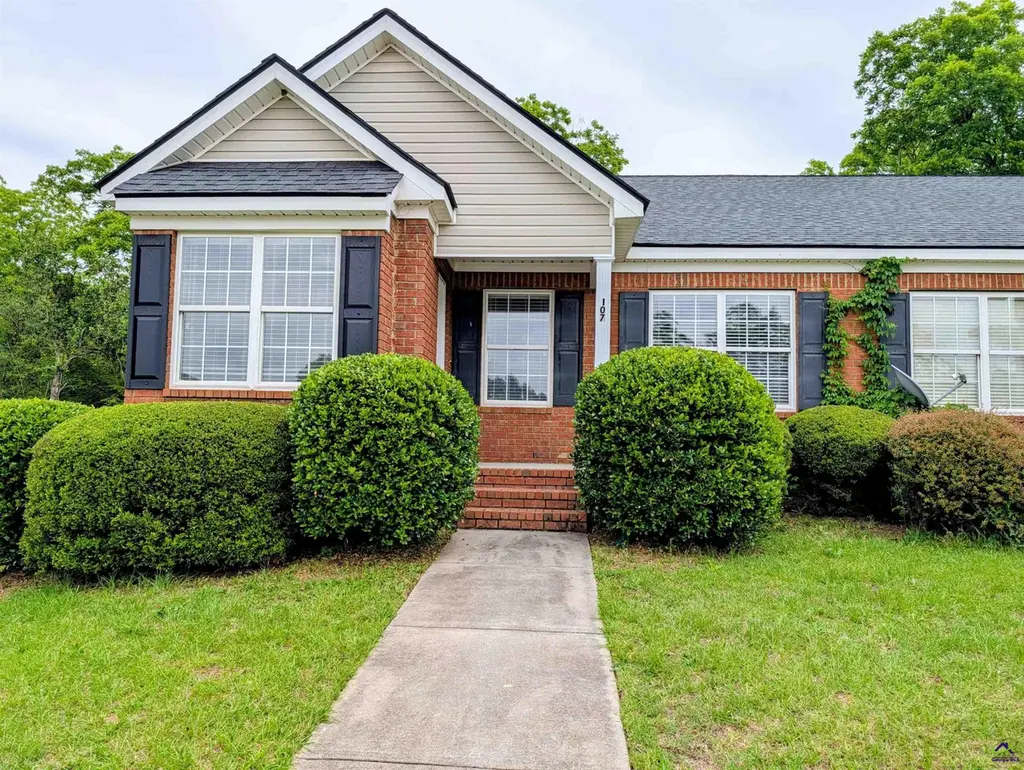
107 North Pointe Dr · Centerville, GA
Flood risk 1/10 · Minimal
- FEMA flood zone
- X (unshaded)
- Chance of flooding over 30 yrs
- 0.0%
- Est. flood insurance / yr
- $507 – $1,088
Fire risk 3/10 · Minor
- Est. fire insurance / yr
- $963 – $1,789
Heat risk 7/10 · Major
- Hot days now (above 108°F)
- 7 days/yr
- Hot days in 30 yrs
- 19 days/yr
Wind risk 6/10 · Moderate
- Chance of severe wind over 30 yrs
- 73.0%
Air-quality risk 3/10 · Minor
- Unhealthy air days now
- 2 days/yr
- Unhealthy air days in 30 yrs
- 3 days/yr
Risk factors via First Street. Map © Google.
Why this score? — see what drove the B- grade
The composite is a weighted blend of 9 inputs, each scored 0–100. Each bar is that input's sub-score; the figure is the points it added to the 100-point composite (weight × sub-score).
- Cash flow +27.4/30.0
- ARV discount +11.5/15.0
- DSCR +9.6/10.0
- 1% rule +6.7/10.0
- Schools +3.9/10.0
- Livability +3.7/5.0
- Rent growth +2.5/5.0
- Condition / age +2.5/5.0
- Appreciation +0.0/10.0
$144,500
🖨 Deal sheet 📄 Offer letter ✓ Due diligence
Listing remarks
Welcome to this super cute home in the heart of Centerville! Conveniently located near shopping, dining, and I-75, this charming 2- bedroom, 2-bath home offers an open-concept layout perfect for comfortable living and entertaining. Spacious charm throughout a quaint and quiet neighborhood that feels like home the moment you arrive. Low- maintenance living in a fantastic location- don't miss this adorable gem.
Key facts
- Built 2003
- Listed 6 days
Property features AI
Exterior
- Utilities: Public water; Public sewer
- Home design: Residential townhouse (single family attached)
- Construction: Brick and vinyl siding exterior
- Exterior features: Located in North Point Villa subdivision
Interior
- Kitchen: Dishwasher; Electric range; Refrigerator; Microwave; Garbage disposal
- Flooring: Carpet; Vinyl
- Bathrooms: 2 full bathrooms
- Heating & cooling: Central heating (electric); Central air conditioning
- Interior features: Dishwasher; Electric range; Refrigerator; Microwave; Garbage disposal
Neighborhood map
What this means for you Summary
Snapshot
- This is a 2-bed/2.0-bath single-family listed at $144k.
Deal economics
- At list price, monthly cash flow is $422 ($5k/yr) — positive.
- The deal already cash-flows at list — no discount required.
- Meets the 1% rule at list price ($2k rent vs $144k).
- Cap rate 9.8% vs local median 5.8% in Centerville — top-decile yield for the area; either an underpriced asset or a hidden risk that comps aren't pricing in. Stress-test before assuming the spread holds.
Location & tenants
- Location reads 73/100 on livability (#56 in GA) — a middle-class / working-renter tenant base. Strengths: cost of living A+, housing A+, health & safety A-; Watch: amenities F, commute F.
- Houston County (urban): math 43% / reading 46% proficiency, ranked #23 of 174 in GA (top 13%) — families likely to look elsewhere, expect single-tenant / working-renter base with shorter leases.
- Zoned schools: Eagle Springs Elementary (math 45% / reading 47%, grade D-, #316 of 1,228 statewide, top 26%, 704 students, 66% FRL); Thomson Middle School (math 29% / reading 34%, grade F, #234 of 470 statewide, top 50%, 736 students, 84% FRL); Northside High School (math 5% / reading 21%, grade F, #331 of 424 statewide, top 78%, 1,959 students, 84% FRL) — zoned schools average 78% FRL vs 46% district-wide (32 pts higher); higher-poverty schools than district average — tighter screening recommended.
- Zoned-school proficiency averages 30% at this address vs 44% district-wide (-14 pts) — the specific schools serving this property underperform the Houston County average; the district grade overstates school quality for this exact location.
- Market conditions: 37 active listings in the ZIP; 9 comparable units currently listed for rent nearby; rentals at typical pace (median 21d on market — plan ~3-4 weeks tenant-placement turnaround); solid renter incomes; 1,545 units permitted in Houston County in 2024 (336 in 5+ unit buildings).
Forward outlook
- Local home prices are declining (-3.0%/yr); year-one equity from $999 of loan paydown is wiped out by about $4k of value loss. Plan a longer hold.
- Houston County population projected at +22% by 2050 — long-run rental-demand tailwind backs the buy-and-hold thesis.
- At projected returns (-3.0% appreciation + 3.0% rent growth), your $40k cash investment doubles in ~10 years — after that, you're playing with house money.
Negotiation context
- Only 6 days on market — expect competitive offers; lowballing is unlikely to land.
- 2 sale attempts with the ask held roughly flat each time — persistent listings suggest the price (not the market) is what's stuck; bring a comps-based counter.
- Current owner paid $80k; list at $144k implies a 81% gain — meaningful room to come down on a strong offer.
Risks & watch-outs
- Climate carrying-cost: major wind risk, 73% chance of damaging wind over 30y; extreme-heat days projected 7→19/yr by 2055 (HVAC capex compounding) — expect insurance premiums to compound above CPI over the hold.
Questions for the listing agent
- Is there a deadline driving the sale (1031 exchange, divorce, estate, relocation)? That informs how much negotiation room exists.
- What's the average days-on-market for RENTAL listings here right now (not sales)? A rising rental-DOM trend means longer vacancies and softer asking-rent achievability than the comps imply.
- What's the recent tenant-quality profile in this submarket — average credit score on applications, eviction rate, late-payment / NSF rate, and stable-employment percentage? A property-management company in the area should have these aggregated.
- How much new for-sale + rental construction is in the pipeline within 1–3 miles? Heavy new supply typically softens prices + rents 12–24 months out; constrained supply supports both.
Investment metrics
- 1% rule
- 1.17% ✓
- Cap rate
- 9.80%
- Cash-on-cash
- 12.51%
- DSCR
- 1.56
- GRM
- 7.1
CMA / ARV
- ARV (median comp)
- $158,494
- List price
- $144,500
- Delta
- -8.83%
- Verdict
- FAIR
- Comps
- 20 within 1.0 mi
Show comp detail 12 sales within ~0.75 mi
| Address | Dist | Beds/Ba | Sqft | Sold | Price | $/sf | Match |
|---|---|---|---|---|---|---|---|
| 708 Houston Lake Blvd | 0.19mi | 3/2.0 (+1) | 1,232 (+2%) | 3mo | $215,000 | $175 | 81 |
| 121 Northpointe Dr | 0.04mi | 2/2.0 | 1,132 (-6%) | 9mo | $134,500 | $119 | 80 |
| 107 Miller Ct | 0.27mi | 3/2.0 (+1) | 1,125 (-7%) | 2mo | $157,000 | $140 | 69 |
| 106 Charter Ct | 0.05mi | 2/2.0 | 1,092 (-10%) | 18mo | $126,000 | $115 | 67 |
| 110 Charter Ct | 0.06mi | 2/2.0 | 1,092 (-10%) | 18mo | $126,000 | $115 | 66 |
| 204 Elizabeth Dr | 0.44mi | 2/2.0 | 1,248 (+3%) | 12mo | $121,000 | $97 | 64 |
| 111 Miller Ct | 0.31mi | 3/1.0 (+1) | 1,248 (+3%) | 11mo | $153,000 | $123 | 62 |
| 209 Elizabeth Dr | 0.39mi | 3/1.0 (+1) | 1,152 (-5%) | 13mo | $159,900 | $139 | 54 |
| 409 Davis Dr | 0.44mi | 3/2.0 (+1) | 1,304 (+8%) | 10mo | $184,000 | $141 | 53 |
| 113 Brantley Rd | 0.34mi | 2/1.0 | 1,060 (-12%) | 8mo | $52,000 | $49 | 53 |
| 5 Pine Shadow Ct | 0.66mi | 2/2.0 | 1,162 (-4%) | 18mo | $154,900 | $133 | 48 |
| 403 Davis Dr | 0.41mi | 3/1.0 (+1) | 1,092 (-10%) | 12mo | $196,000 | $179 | 46 |
Match score weights: distance 35% · size 25% · config 20% · recency 20%. Top-matched comps best support the ARV.
Projected returns pro-forma
-3.0% appreciation · 3.0% rent growth · sell at horizon
- IRR
- 2.2%
- Equity multiple
- 1.08×
- Total profit
- $3,421
- Equity at exit
- $21,545
- IRR
- 11.8%
- Equity multiple
- 1.93×
- Total profit
- $37,460
- Equity at exit
- $12,494
Cash invested: $40,460 (down + closing). Projections, not guarantees.
Landlord ↔ Tenant lean methodology
- Overall (STATE)
- 90 Strongly Landlord-Friendly
- State Georgia
- 90 Strongly Landlord-Friendly · R+3
- County
- — inherits STATE
- City
- — inherits STATE
ZIP-level market 31028
- Home prices YoY
- -21.7%
- Active inventory
- 37
- Price-to-rent
- 7.1×
Monthly cashflow live
- Estimated rent
- $1,689 high interval (Pro) →
- Mortgage (P&I)
- −$758
- Tax from tax record
- −$95 /mo · $1,135/yr
- Insurance
- −$60
- HOA
- −$0
- Vacancy / Maint / Mgmt
- −$355
- Net cashflow
- $422
Break-even live
UW: 25.0% down · 7.5% · 30yr · 1.5% tax · 5.0% vac · 8.0% maint · 8.0% mgmt
Financing live
Cash to close
- Down payment
- $36,125
- Closing costs
- $4,335
- Reserves months
- —
- Total cash needed
- —
Loan-product check · same deal, 3 products live
Conventional
25% down · 7.5% · 30yr
- Down + closing
- —
- Monthly P&I
- —
- Monthly cashflow
- —
- DSCR
- —
- Eligible?
- —
Personal DTI + credit; lowest rate.
DSCR
20% down · 8.5% · 30yr
- Down + closing
- —
- Monthly P&I
- —
- Monthly cashflow
- —
- DSCR
- —
- Eligible?
- —
No personal income docs; deal must DSCR.
Hard money
10% down · 12.0% · 12mo
- Down + closing
- —
- Monthly P&I
- —
- Monthly cashflow
- —
- DSCR
- —
- Eligible?
- —
Short-term bridge; refi at stabilization.
Rent comps 9 comps
| Address | Beds | Baths | Sqft | Rent | $/sqft | DOM | Units | Dist |
|---|---|---|---|---|---|---|---|---|
| 214 Ridgewood Dr Centerville, GA | 2.0 | 2.0 | 980 | $1,050 | $1.07 | 21d | 1 | 0.73mi |
| 114 Tahoe Ln Warner Robins, GA | 3.0 | 2.0 | 1349 | $1,800 | $1.33 | 44d | 1 | 0.76mi |
| 103 Abney Ct Centerville, GA | 3.0 | 2.0 | 1500 | $1,800 | $1.20 | 21d | 1 | 0.87mi |
| 105 Arnold St Centerville, GA | 2.0 | 1.5 | 1122 | $1,295 | $1.15 | 13d | 1 | 0.95mi |
| 431 Sentry Oak Dr Centerville, GA | 3.0 | 2.0 | 1312 | $1,695 | $1.29 | 44d | 1 | 0.99mi |
| 213 Webb St Warner Robins, GA | 3.0 | 2.0 | 1152 | $1,600 | $1.39 | 21d | 1 | 1.13mi |
| 111 Rainbow Ave Warner Robins, GA | 3.0 | 2.0 | 1422 | $1,695 | $1.19 | 44d | 1 | 1.15mi |
| 111 Rainbow Ave Warner Robins, GA | 3.0 | 2.0 | 1422 | $1,695 | $1.19 | 21d | 1 | 1.15mi |
| 800 Gunn Rd Centerville, GA | 1.0–3.0 | 1.0–2.0 | 1100 | $1,465 | $1.33 | 13d | 2 | 1.19mi |
Listing history 4 events
-
2026-05-13$144,500 Active 412-char remark
-
2025-05-13historical $1,295
-
2025-05-03$1,295
-
2004-08-09soldstatus $79,900
ⓘ Source: listings_history table (triggers on properties + properties_extension) + one-shot
backfill from property_details.listing_events for pre-trigger history.
Tax reassessment forecast GA · Resets to sale price
- Current annual tax
- $1,135 · $95/mo
- Projected year-2 tax
- $1,329 · $111/mo
- Expected delta
- +$194/yr (+$16/mo · 17.1%)
ⓘ Screening estimate from a state-policy table — verify with the county assessor before closing.
Climate risk First Street
- Flood 1/10 Low FEMA zone X (unshaded) · 0% chance over 30 yrs
- Wildfire 3/10 Moderate
- Heat 7/10 Severe 7 d/yr ≥108°F today · 19 d/yr by 30 yrs out
- Wind 6/10 Major 73% chance of damaging wind over 30 yrs
- Air quality 3/10 Moderate 2 unhealthy d/yr today · 3 by 30 yrs out
Nearby sold comps map
Loading sold comps map…
Walkable amenities ~0.75 mi
Loading nearby amenities…
Taxation est. · year 1
- Rental income
- $20,269
- − Mortgage interest
- −$8,094
- − Property taxes
- −$1,135
- − Insurance
- −$722
- − Repairs & maintenance
- −$1,622
- − Management
- −$1,622
- − Depreciation
- −$4,204
- Taxable income
- $2,870
- Est. tax owed @ 24.0%
- −$689
- After-tax cash flow
- $4,373/yr
For passive investors: Depreciation is non-cash, so a rental often shows a tax loss while cash-flowing — sheltering income. Rental losses are passive: they offset passive income freely, and up to $25,000/yr can offset ordinary (W-2) income if you actively participate and your MAGI is under $100k (phasing out to $0 by $150k); unused losses carry forward. On sale, claimed depreciation is recaptured at up to 25%, and gains may owe capital-gains tax (a 1031 exchange can defer both). Figures are a year-1 estimate at your 24.0% rate — not tax advice; consult a CPA.
Schools (NCES district)
- District
- Houston County
- NCES district ID
- 1302880
- Math proficiency
- 43% ▼ -7.00%
- Reading proficiency
- 46% ▼ -2.00%
- Median HH income
- $54,823
- Composite
- 38.68/100
- National rank
- #4144
- State rank
- #23 of 174 in GA
Livability — Centerville
- Score
- 73/100
- State rank
- #56
- US rank
- #5374
Category grades
Schools grade is shown separately in the Schools card above.
Census & demographics
- Census place
- Centerville, GA
- County
- Houston County · 157,321 people
- City population
- 6,312
- Metro
- Warner Robins, GA
- Population (ZIP)
- 6,645
- Household income
- $76,342
- Rent vs Own
- Severe rent burden
- 216.0
Population outlook (Houston County) Hauer SSP2
- Today (2025)
- 169,502 people
- By 2030
- 178,486 · +5.3%
- By 2040
- 194,642 · +14.8%
- By 2050
- 207,119 · +22.2%
- By 2075
- 231,480 · +36.6%
- By 2100
- 235,034 · +38.7%
Race, ethnicity, and origin ACS 2023
- Neighborhood character
- Diverse neighborhood (Simpson 0.63)
- Race & ethnicity
- Black 45% White 41% Asian 6% Two or more races 6% Hispanic / Latino 3%
- Common ancestry
- Armenian 3% Italian 3% Slovak 2%
- Foreign-born
- 8% · Canada, South Korea, Vietnam
- Languages at home
- 87% English-only · Arabic 3% Other Indo-European 3% Spanish 2%
Political lean MEDSL · Houston
- 2024 margin
- R (+11.3) · D 44.0% · R 55.3%
- 2008→2024 swing
- +8.9pp toward D · 2008: -20.2pp · 2024: -11.3pp
- All cycles
- 2024: R+11.3 2020: R+12.4 2016: R+21.6 2012: R+20.7 2008: R+20.2
Not yet ingested
- Civics
- —
Market trends
- HPI YoY
- ▼ -59.75%
- Current HPI
- 215.7835
- Rent YoY
- —
- Metro
- Warner Robins, GA
- State GDP YoY
- ▲ 2.66%
- F500 in state
- 28
Industry mix (Fortune 500 HQ in GA)
| Industry | F500 HQs | Revenue |
|---|---|---|
| Paper / Packaging | 2 | $29B |
|
||
| Retail | 1 | $160B |
|
||
| Transportation / Logistics | 1 | $91B |
|
||
| Airlines | 1 | $62B |
|
||
| Consumer Goods | 1 | $47B |
|
||
| Utilities | 1 | $25B |
|
||
Price history
+80.9% since first listed5 events — show timeline
- 2026-05-20 Pending — CGMLS
- 2026-05-13 Listed $144,500 CGMLS
- 2025-05-13 Rental Removed $1,295 CGMLS
- 2025-05-03 Listed for Rent $1,295 CGMLS
- 2004-08-09 Sold (Public Records) $79,900 Public Records
Property tax history
+5.8%/yrLatest (2025): $1,135 · +6.6% YoY. Source: county tax records.
Cash-flow waterfall
monthlySold comps — $/sqft
last 12 mo · ≤1 miLoading sold comps…