 🏷️ Likely Rental
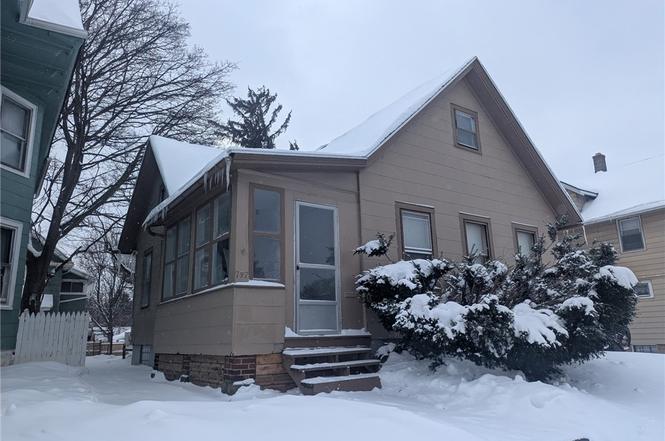
797 Bay St · Rochester, NY
Flood risk 1/10 · Minimal
- FEMA flood zone
- X (unshaded)
- Chance of flooding over 30 yrs
- 0.0%
- Est. flood insurance / yr
- $473 – $860
Fire risk 1/10 · Minimal
- Est. fire insurance / yr
- $691 – $1,283
Heat risk 2/10 · Minimal
- Hot days now (above 95°F)
- 7 days/yr
- Hot days in 30 yrs
- 15 days/yr
Wind risk 1/10 · Minimal
- Chance of severe wind over 30 yrs
- —
Air-quality risk 2/10 · Minimal
- Unhealthy air days now
- 1 days/yr
- Unhealthy air days in 30 yrs
- 2 days/yr
Risk factors via First Street. Map © Google.
Why this score? — see what drove the B grade
The composite is a weighted blend of 9 inputs, each scored 0–100. Each bar is that input's sub-score; the figure is the points it added to the 100-point composite (weight × sub-score).
- Cash flow +30.0/30.0
- 1% rule +10.0/10.0
- DSCR +10.0/10.0
- ARV discount +7.5/15.0
- Rent growth +4.5/5.0
- Livability +3.8/5.0
- Condition / age +2.5/5.0
- Schools +1.9/10.0
- Appreciation +0.0/10.0
$89,900
🖨 Deal sheet 📄 Offer letter ✓ Due diligence
Listing remarks
THIS IS THE KIND OF PROPERTY INVESTORS ACTUALLY LIKE—SOLID, STRAIGHTFORWARD, AND FULL OF POTENTIAL. 797 BAY STREET OFFERS 1,844 SQUARE FEET, 4 BEDROOMS, AND 1 FULL BATH, PROVIDING A FLOOR PLAN THAT MAKES SENSE AND SUPPORTS STRONG LONG-TERM RENTAL APPEAL. THE INTERIOR FEATURES GENEROUS ROOM SIZES AND A FUNCTIONAL LAYOUT THAT TRANSLATES WELL FOR TENANT USE—PLENTY OF SPACE, NO WASTED AREAS, AND ROOMS THAT ACCOMMODATE REAL FURNITURE WITHOUT CREATIVE PROBLEM-SOLVING. NEWER MECHANICALS ADD TO OVERALL FUNCTIONALITY AND EASE OF MAINTENANCE, MAKING THIS A PRACTICAL OPTION FOR A BUY-AND-HOLD STRATEGY OR FUTURE VALUE-ADD PLAY. THE OUTDOOR SPACE IS LOW-MAINTENANCE AND EASY TO MANAGE—A
Key facts
- Generous room sizes
- Functional layout
- Forced-air heat
Tags
Neighborhood map
What this means for you Summary
Snapshot
- This is a 4-bed/1.0-bath single-family listed at $90k.
Deal economics
- At list price, monthly cash flow is $880 ($11k/yr) — positive.
- The deal already cash-flows at list — no discount required.
- Meets the 1% rule at list price ($2k rent vs $90k).
- Recommended offer: $87k (3.0% below list) — sets the bar for market timing.
- Cap rate 18.0% vs local median 9.3% in Rochester — top-decile yield for the area; either an underpriced asset or a hidden risk that comps aren't pricing in. Stress-test before assuming the spread holds.
Location & tenants
- Location reads 76/100 on livability (#222 in NY, #3,482 nationally) — a middle-class / working-renter tenant base. Strengths: commute A+, cost of living A+, housing A+; Watch: schools D+, crime F, employment F.
- Rochester City School District (urban): math 21% / reading 26% proficiency, ranked #589 of 590 in NY (top 100%) — low school quality limits family demand, transient renter base, plan for 1-2y turnover; 82% free/reduced lunch — lower-income household profile, screen leases tightly.
- Market conditions: Rents rising fast (+7.9%/yr); 199 active listings in the ZIP; 16 comparable units currently listed for rent nearby; rentals at typical pace (median 22d on market — plan ~3-4 weeks tenant-placement turnaround); 1,169 units permitted in Monroe County in 2024 (591 in 5+ unit buildings).
- This rent runs 35% of the median local income ($65k/yr) — at the standard rent-burdened threshold; future hikes will face affordability resistance.
Forward outlook
- Local home prices are declining (-3.0%/yr); year-one equity from $622 of loan paydown is wiped out by about $3k of value loss. Plan a longer hold.
- Monroe County population projected to shrink 6% by 2050 — rents likely to lag national; underwrite the cash flow, not the appreciation.
- At projected returns (-3.0% appreciation + 7.9% rent growth), your $25k cash investment doubles in ~3 years — after that, you're playing with house money.
Negotiation context
- It's been on market 31 days — a 3% lower offer ($87k) is reasonable based on typical stale-listing flexibility.
- 6 sale attempts since 5y ago with the ask held roughly flat each time — persistent listings suggest the price (not the market) is what's stuck; bring a comps-based counter.
- Current owner paid $65k; 38% above their basis — modest negotiation headroom, anchor on the comps not their cost.
Risks & watch-outs
- Watch-outs: built in 1900 — expect roof / HVAC / electrical / plumbing capex.
Questions for the listing agent
- It's been on market 31 days. Have you received any prior offers? Is the seller open to a 3% concession, seller financing, or rate buy-down credit?
- Built in 1900 — when were the roof, HVAC, electrical panel, plumbing, and water heater last replaced?
- Is there a deadline driving the sale (1031 exchange, divorce, estate, relocation)? That informs how much negotiation room exists.
- Schools are D-rated, which usually means shorter tenancies and higher turnover. Who's the typical renter profile here, and what's been the actual vacancy rate?
- Crime grade is F in this area — have there been break-ins, vandalism, or insurance claims at this property in the last 3 years? What carrier currently insures it and at what premium?
- What's the average days-on-market for RENTAL listings here right now (not sales)? A rising rental-DOM trend means longer vacancies and softer asking-rent achievability than the comps imply.
- What's the recent tenant-quality profile in this submarket — average credit score on applications, eviction rate, late-payment / NSF rate, and stable-employment percentage? A property-management company in the area should have these aggregated.
- How much new for-sale + rental construction is in the pipeline within 1–3 miles? Heavy new supply typically softens prices + rents 12–24 months out; constrained supply supports both.
Investment metrics
- 1% rule
- 2.08% ✓
- Cap rate
- 18.05%
- Cash-on-cash
- 41.97%
- DSCR
- 2.87
- GRM
- 4.0
CMA / ARV
- ARV (on-the-fly)
- $191,776
- Comps found
- 12
Show comp detail 12 sales within ~0.75 mi
| Address | Dist | Beds/Ba | Sqft | Sold | Price | $/sf | Match |
|---|---|---|---|---|---|---|---|
| 102 Ellison St | 0.10mi | 4/1.0 | 1,782 (-3%) | 4mo | $195,000 | $109 | 86 |
| 264 Springfield Ave | 0.46mi | 3/2.0 (-1) | 1,786 (-3%) | 1mo | $179,500 | $101 | 63 |
| 487 Parsells Ave | 0.50mi | 4/1.5 | 1,973 (+7%) | 2mo | $180,000 | $91 | 61 |
| 28 Arbutus St | 0.44mi | 4/1.0 | 1,664 (-10%) | 4mo | $75,000 | $45 | 60 |
| 255 Melville St | 0.32mi | 4/1.5 | 2,076 (+13%) | 4mo | $215,000 | $104 | 59 |
| 275 Parsells Ave | 0.38mi | 3/2.0 (-1) | 1,662 (-10%) | 3mo | $207,000 | $125 | 54 |
| 77 Sidney St | 0.62mi | 4/1.5 | 1,702 (-8%) | 4mo | $149,900 | $88 | 53 |
| 128 5th St | 0.59mi | 4/1.0 | 1,606 (-13%) | 2mo | $62,000 | $39 | 49 |
| 442 Hayward Ave | 0.66mi | 3/2.0 (-1) | 1,746 (-5%) | 4mo | $189,900 | $109 | 48 |
| 188 5th St | 0.58mi | 4/2.0 | 1,576 (-14%) | 3mo | $65,500 | $42 | 42 |
| 497 Rocket St | 0.49mi | 3/2.0 (-1) | 1,580 (-14%) | 3mo | $250,000 | $158 | 42 |
| 52 Arch St | 0.70mi | 4/2.0 | 1,593 (-14%) | 4mo | $244,500 | $153 | 37 |
Match score weights: distance 35% · size 25% · config 20% · recency 20%. Top-matched comps best support the ARV.
Projected returns pro-forma
-3.0% appreciation · 7.89% rent growth · sell at horizon
- IRR
- 44.0%
- Equity multiple
- 3.03×
- Total profit
- $51,156
- Equity at exit
- $13,404
- IRR
- 52.1%
- Equity multiple
- 7.38×
- Total profit
- $160,560
- Equity at exit
- $7,773
Cash invested: $25,172 (down + closing). Projections, not guarantees.
Landlord ↔ Tenant lean methodology
- Overall (STATE)
- 15 Strongly Tenant-Friendly
- State New York
- 15 Strongly Tenant-Friendly · D+10
- County
- — inherits STATE
- City
- — inherits STATE
ZIP-level market 14609
- Home prices YoY
- -30.4%
- Rents YoY
- 7.9%
- Active inventory
- 199
- Price-to-rent
- 4.0×
Monthly cashflow live
- Estimated rent
- $1,867 high interval (Pro) →
- Mortgage (P&I)
- −$471
- Tax from tax record
- −$85 /mo · $1,024/yr
- Insurance
- −$37
- HOA
- −$0
- Vacancy / Maint / Mgmt
- −$392
- Net cashflow
- $880
Break-even live
UW: 25.0% down · 7.5% · 30yr · 1.5% tax · 5.0% vac · 8.0% maint · 8.0% mgmt
Financing live
Cash to close
- Down payment
- $22,475
- Closing costs
- $2,697
- Reserves months
- —
- Total cash needed
- —
Loan-product check · same deal, 3 products live
Conventional
25% down · 7.5% · 30yr
- Down + closing
- —
- Monthly P&I
- —
- Monthly cashflow
- —
- DSCR
- —
- Eligible?
- —
Personal DTI + credit; lowest rate.
DSCR
20% down · 8.5% · 30yr
- Down + closing
- —
- Monthly P&I
- —
- Monthly cashflow
- —
- DSCR
- —
- Eligible?
- —
No personal income docs; deal must DSCR.
Hard money
10% down · 12.0% · 12mo
- Down + closing
- —
- Monthly P&I
- —
- Monthly cashflow
- —
- DSCR
- —
- Eligible?
- —
Short-term bridge; refi at stabilization.
Rent comps 16 comps
| Address | Beds | Baths | Sqft | Rent | $/sqft | DOM | Units | Dist |
|---|---|---|---|---|---|---|---|---|
| 1786 Clifford Ave Rochester, NY | 3.0 | 1.0 | 2404 | $1,850 | $0.77 | 3d | 1 | 0.36mi |
| 1788 Clifford Ave Rochester, NY | 3.0 | 1.0 | 2404 | $1,850 | $0.77 | 3d | 1 | 0.36mi |
| 195 Parsells Ave Rochester, NY | 4.0 | 1.0 | 1413 | $1,265 | $0.90 | 3d | 1 | 0.39mi |
| 52 Frances St Rochester, NY | 4.0 | 1.0 | 1256 | $1,595 | $1.27 | 43d | 1 | 0.40mi |
| 126 Parsells Ave Rochester, NY | 3.0 | 1.0 | 1574 | $1,800 | $1.14 | 43d | 1 | 0.40mi |
| 126 Parsells Ave Rochester, NY | 3.0 | 1.0 | 1574 | $1,800 | $1.14 | 21d | 1 | 0.40mi |
| 420 Rosewood Ter Rochester, NY | 3.0 | 1.0 | 1246 | $1,300 | $1.04 | 3d | 1 | 0.47mi |
| 47 Priscilla St Rochester, NY | 4.0 | 1.5 | 1250 | $1,900 | $1.52 | 21d | 1 | 0.54mi |
| 1159 Culver Rd Unit A2 UP Rochester, NY | 3.0 | 1.0 | 1313 | $1,500 | $1.14 | 43d | 1 | 0.56mi |
| 147 5th St Rochester, NY | 4.0 | 1.0 | 1289 | $1,950 | $1.51 | 21d | 1 | 0.61mi |
| 1079 Garson Ave Rochester, NY | 3.0 | 1.5 | 1273 | $2,100 | $1.65 | 10d | 1 | 0.92mi |
| 207 Lux St Rochester, NY | 4.0 | 1.5 | 1728 | $2,150 | $1.24 | 10d | 1 | 0.96mi |
| 1 Champeney Ter Rochester, NY | 3.0 | 1.0 | 1936 | $1,650 | $0.85 | 14d | 1 | 1.13mi |
| 733 University Ave #3 Rochester, NY | 3.0 | 1.5 | 1400 | $1,850 | $1.32 | 43d | 1 | 1.23mi |
| 59 Clark Ave Rochester, NY | 4.0 | 1.0 | 1728 | $1,800 | $1.04 | 2d | 1 | 1.25mi |
| 176 Merwin Ave Rochester, NY | 4.0 | 1.5 | 1750 | $2,200 | $1.26 | 43d | 1 | 1.36mi |
Listing history 18 events
-
2026-03-02status Pending
-
2026-01-30$89,900 Active
-
2025-10-08historical
-
2025-09-30price $78,990
-
2025-09-26status Active
-
2025-07-25status Pending
-
2025-06-14price $81,990
-
2025-05-08$84,900 Active
-
2025-05-07status Active
-
2025-05-07historical
-
2025-01-31status Pending
-
2025-01-21$64,900 Active
-
2022-09-30soldstatus $65,000
-
2021-08-10historical
-
2021-07-12price $65,000
-
2021-06-04price $69,900
-
2021-05-27$75,000 Active
-
2005-10-03soldstatus $50,000
ⓘ Source: listings_history table (triggers on properties + properties_extension) + one-shot
backfill from property_details.listing_events for pre-trigger history.
Tax reassessment forecast NY · Partial reset (capped growth)
- Current annual tax
- $1,024 · $85/mo
- Projected year-2 tax
- $1,272 · $106/mo
- Expected delta
- +$248/yr (+$21/mo · 24.2%)
ⓘ Screening estimate from a state-policy table — verify with the county assessor before closing.
Climate risk First Street
- Flood 1/10 Low FEMA zone X (unshaded) · 0% chance over 30 yrs
- Wildfire 1/10 Low
- Heat 2/10 Low 7 d/yr ≥95°F today · 15 d/yr by 30 yrs out
- Wind 1/10 Low
- Air quality 2/10 Low 1 unhealthy d/yr today · 2 by 30 yrs out
Nearby sold comps map
Loading sold comps map…
Walkable amenities ~0.75 mi
Loading nearby amenities…
Taxation est. · year 1
- Rental income
- $22,400
- − Mortgage interest
- −$5,036
- − Property taxes
- −$1,024
- − Insurance
- −$450
- − Repairs & maintenance
- −$1,792
- − Management
- −$1,792
- − Depreciation
- −$2,615
- Taxable income
- $9,691
- Est. tax owed @ 24.0%
- −$2,326
- After-tax cash flow
- $8,239/yr
For passive investors: Depreciation is non-cash, so a rental often shows a tax loss while cash-flowing — sheltering income. Rental losses are passive: they offset passive income freely, and up to $25,000/yr can offset ordinary (W-2) income if you actively participate and your MAGI is under $100k (phasing out to $0 by $150k); unused losses carry forward. On sale, claimed depreciation is recaptured at up to 25%, and gains may owe capital-gains tax (a 1031 exchange can defer both). Figures are a year-1 estimate at your 24.0% rate — not tax advice; consult a CPA.
Schools (NCES district)
- District
- Rochester City School District
- NCES district ID
- 3624750
- Math proficiency
- 21% ▬ 0.00%
- Reading proficiency
- 26% ▲ 4.00%
- Median HH income
- $30,923
- Composite
- 18.98/100
- National rank
- #8850
- State rank
- #589 of 590 in NY
Livability — Rochester
- Score
- 76/100
- State rank
- #222
- US rank
- #3482
Category grades
Schools grade is shown separately in the Schools card above.
Census & demographics
- Census place
- Rochester, NY
- County
- Monroe County · 674,131 people
- City population
- 432,803
- Metro
- Rochester, NY
- Population (ZIP)
- 40,274
- Household income
- $64,603
- Rent vs Own
- Severe rent burden
- 2183.0
Population outlook (Monroe County) Hauer SSP2
- Today (2025)
- 759,460 people
- By 2030
- 757,154 · -0.3%
- By 2040
- 740,644 · -2.5%
- By 2050
- 714,443 · -5.9%
- By 2075
- 645,883 · -15.0%
- By 2100
- 547,084 · -28.0%
Race, ethnicity, and origin ACS 2023
- Neighborhood character
- Diverse neighborhood (Simpson 0.69)
- Race & ethnicity
- White 44% Black 28% Hispanic / Latino 20% Two or more races 10% Asian 2%
- Hispanic origin (detail)
- Puerto Rican 15% Cuban 1% Dominican 1%
- Common ancestry
- Romanian 4% Lithuanian 2% Iranian 1%
- Foreign-born
- 8% · Canada
- Languages at home
- 81% English-only · Spanish 14% Russian/Polish/Slavic 2% Other Indo-European 1%
Political lean MEDSL · Monroe
- 2024 margin
- D (+19.1) · D 59.5% · R 40.5%
- 2008→2024 swing
- +1.4pp toward D · 2008: 17.7pp · 2024: 19.1pp
- All cycles
- 2024: D+19.1 2020: D+21.0 2016: D+14.1 2012: D+17.4 2008: D+17.7
Not yet ingested
- Civics
- —
Market trends
- HPI YoY
- ▼ -143.57%
- Current HPI
- 328.7053
- Rent YoY
- ▲ 7.89%
- Metro
- Rochester, NY
- State GDP YoY
- ▲ 2.60%
- F500 in state
- 92
Industry mix (Fortune 500 HQ in NY)
| Industry | F500 HQs | Revenue |
|---|---|---|
| Financial Services | 10 | $950B |
|
||
| Consumer Goods | 9 | $162B |
|
||
| Insurance | 4 | $225B |
|
||
| Telecommunications | 2 | $144B |
|
||
| Pharmaceuticals | 2 | $112B |
|
||
| Media / Entertainment | 2 | $69B |
|
||
Price history
+79.8% since first listed18 events — show timeline
- 2026-03-02 Pending — UNYREIS
- 2026-01-30 Listed $89,900 UNYREIS
- 2025-10-08 Listing Removed — UNYREIS
- 2025-09-30 Price Changed $78,990 UNYREIS
- 2025-09-26 Relisted — UNYREIS
- 2025-07-25 Pending — UNYREIS
- 2025-06-14 Price Changed $81,990 UNYREIS
- 2025-05-08 Listed $84,900 UNYREIS
- 2025-05-07 Relisted — UNYREIS
- 2025-05-07 Listing Removed — UNYREIS
- 2025-01-31 Pending — UNYREIS
- 2025-01-21 Listed $64,900 UNYREIS
- 2022-09-30 Sold (Public Records) $65,000 Public Records
- 2021-08-10 Listing Removed — UNYREIS
- 2021-07-12 Price Changed $65,000 UNYREIS
- 2021-06-04 Price Changed $69,900 UNYREIS
- 2021-05-27 Listed $75,000 UNYREIS
- 2005-10-03 Sold (Public Records) $50,000 Public Records
Property tax history
+4.9%/yrLatest (2025): $1,024 · +0.0% YoY. Source: county tax records.
Cash-flow waterfall
monthlySold comps — $/sqft
last 12 mo · ≤1 miLoading sold comps…