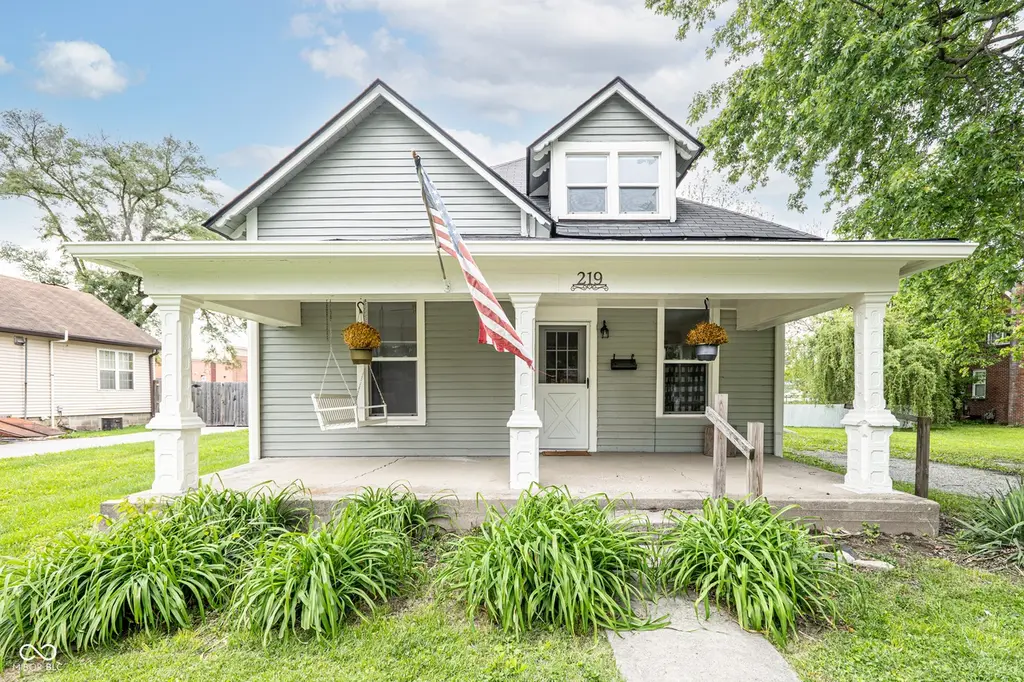
219 W Garden St · Fortville, IN
Flood risk 1/10 · Minimal
- FEMA flood zone
- X (unshaded)
- Chance of flooding over 30 yrs
- 0.0%
- Est. flood insurance / yr
- $507 – $1,088
Fire risk 1/10 · Minimal
- Est. fire insurance / yr
- $717 – $1,331
Heat risk 3/10 · Minor
- Hot days now (above 101°F)
- 7 days/yr
- Hot days in 30 yrs
- 18 days/yr
Wind risk 2/10 · Minimal
- Chance of severe wind over 30 yrs
- 1.0%
Air-quality risk 2/10 · Minimal
- Unhealthy air days now
- 1 days/yr
- Unhealthy air days in 30 yrs
- 2 days/yr
Risk factors via First Street. Map © Google.
Why this score? — see what drove the C+ grade
The composite is a weighted blend of 9 inputs, each scored 0–100. Each bar is that input's sub-score; the figure is the points it added to the 100-point composite (weight × sub-score).
- Cash flow +22.5/30.0
- ARV discount +15.0/15.0
- DSCR +7.2/10.0
- 1% rule +5.2/10.0
- Schools +4.1/10.0
- Livability +3.5/5.0
- Rent growth +2.5/5.0
- Condition / age +2.5/5.0
- Appreciation +0.0/10.0
$240,000
🖨 Deal sheet 📄 Offer letter ✓ Due diligence
Listing remarks MLS
Wonderful Investment Opportunity in Fortville...! Bring your Investor / Rehab Clients for this 3-Bedroom, 1-Full Bath, 2-Story Home on a Half-Acre conveniently located to downtown Fortville; Property to be Sold As-Is as Seller Will Not be making Any Repairs
Key facts
- 0.58 acre lot
- Garage
- Built 1890
Property features AI
Finance
- Other: Approximately 0.58-acre lot with mature trees; Not in a subdivision
Exterior
- Parking: Attached garage (1 car)
- Utilities: Public water; Municipal sewer connected; Natural gas connected; Cable available
- Home design: Single-family residence; Two levels; South-facing
- Construction: Vinyl siding; Block foundation
- Exterior features: Covered patio
Interior
- Kitchen: Eat-in kitchen; Gas oven; Range hood; Dishwasher; Refrigerator
- Bedrooms: Three bedrooms total — one on the main level and two on the upper level; Main bedroom approx. 13 x 10; Upper bedroom approx. 12 x 12; Upper bedroom approx. 8 x 23
- Flooring: Hardwood floors
- Bathrooms: One full bathroom with tub and shower
- Heating & cooling: Forced air heating (natural gas); Window air conditioning units
- Interior features: Attic access; Vaulted ceilings; Hardwood floors; Eat-in kitchen; Painted woodwork; Utility room
- Laundry & utility: Main-level laundry with sink; Washer; Dryer; Electric water heater
Neighborhood map
What this means for you Summary
Snapshot
- This is a 3-bed/1.0-bath single-family listed at $240k.
Deal economics
- At list price, monthly cash flow is $404 ($5k/yr) — positive.
- The deal already cash-flows at list — no discount required.
- Meets the 1% rule at list price ($2k rent vs $240k).
- Recommended offer: $233k (3.0% below list) — sets the bar for market timing.
- Cap rate 8.3% vs local median 4.2% in Fortville — top-decile yield for the area; either an underpriced asset or a hidden risk that comps aren't pricing in. Stress-test before assuming the spread holds.
Location & tenants
- Location reads 69/100 on livability (#189 in IN) — a middle-class / working-renter tenant base. Strengths: crime A+, cost of living A+, housing A+; Watch: amenities F, commute F, health & safety F.
- Mt Vernon Community School Corporation (rural): math 43% / reading 48% proficiency, ranked #70 of 301 in IN (top 23%) — families likely to look elsewhere, expect single-tenant / working-renter base with shorter leases; only 18% free/reduced lunch — higher-income household profile.
- Zoned schools: Mt Vernon High School (math 41% / reading 71%, grade C, #73 of 369 statewide, top 20%, 1,431 students, 27% FRL).
- Market conditions: 303 active listings in the ZIP; 7 comparable units currently listed for rent nearby; rentals leasing fast (median 3d on market — plan ~1-2 weeks tenant-placement turnaround); 1,091 units permitted in Hancock County in 2024 (0 in 5+ unit buildings).
Forward outlook
- Local home prices are declining (-3.0%/yr); year-one equity from $2k of loan paydown is wiped out by about $7k of value loss. Plan a longer hold.
- Hancock County population projected at +7% by 2050 — modest demand growth; plan on rents tracking national, not racing it.
Negotiation context
- It's been on market 34 days — a 3% lower offer ($233k) is reasonable based on typical stale-listing flexibility.
- 4 sale attempts since 14y ago with the ask held roughly flat each time — persistent listings suggest the price (not the market) is what's stuck; bring a comps-based counter.
- Current owner paid $135k; list at $240k implies a 78% gain — meaningful room to come down on a strong offer.
Risks & watch-outs
- Watch-outs: built in 1890 — expect roof / HVAC / electrical / plumbing capex.
Questions for the listing agent
- It's been on market 34 days. Have you received any prior offers? Is the seller open to a 3% concession, seller financing, or rate buy-down credit?
- Built in 1890 — when were the roof, HVAC, electrical panel, plumbing, and water heater last replaced?
- Is there a deadline driving the sale (1031 exchange, divorce, estate, relocation)? That informs how much negotiation room exists.
- What's the average days-on-market for RENTAL listings here right now (not sales)? A rising rental-DOM trend means longer vacancies and softer asking-rent achievability than the comps imply.
- What's the recent tenant-quality profile in this submarket — average credit score on applications, eviction rate, late-payment / NSF rate, and stable-employment percentage? A property-management company in the area should have these aggregated.
- How much new for-sale + rental construction is in the pipeline within 1–3 miles? Heavy new supply typically softens prices + rents 12–24 months out; constrained supply supports both.
Investment metrics
- 1% rule
- 1.02% ✓
- Cap rate
- 8.31%
- Cash-on-cash
- 7.21%
- DSCR
- 1.32
- GRM
- 8.2
CMA / ARV
- ARV (on-the-fly)
- $337,440
- Comps found
- 12
Show comp detail 12 sales within ~0.75 mi
| Address | Dist | Beds/Ba | Sqft | Sold | Price | $/sf | Match |
|---|---|---|---|---|---|---|---|
| 117 N Leland St | 0.46mi | 3/1.0 | 2,281 (+3%) | 9mo | $180,000 | $79 | 67 |
| 109 Saundra Dr | 0.28mi | 4/2.5 (+1) | 2,259 (+2%) | 22mo | $409,670 | $181 | 55 |
| 512 N Main St | 0.60mi | 3/3.0 | 2,363 (+6%) | 2mo | $320,000 | $135 | 52 |
| 301 E Ohio St | 0.51mi | 4/2.0 (+1) | 1,968 (-11%) | 2mo | $300,000 | $152 | 46 |
| 401 Thomas Point Dr | 0.43mi | 4/2.5 (+1) | 2,390 (+8%) | 14mo | $380,000 | $159 | 45 |
| 207 E Ohio St | 0.50mi | 3/3.0 | 2,024 (-9%) | 11mo | $315,000 | $156 | 45 |
| 453 Illinois St | 0.74mi | 2/1.0 (-1) | 2,088 (-6%) | 12mo | $226,005 | $108 | 41 |
| 577 W Ohio St | 0.66mi | 4/2.5 (+1) | 2,255 (+2%) | 20mo | $355,000 | $157 | 39 |
| 633 W Ohio St | 0.69mi | 4/2.5 (+1) | 2,255 (+2%) | 19mo | $339,995 | $151 | 38 |
| 705 Breakers Ln | 0.58mi | 3/2.5 | 2,480 (+12%) | 15mo | $229,900 | $93 | 35 |
| 210 E Michigan St | 0.53mi | 3/1.5 | 1,920 (-14%) | 22mo | $325,000 | $169 | 32 |
| 605 W Ohio St | 0.67mi | 4/3.0 (+1) | 2,329 (+5%) | 19mo | $339,000 | $146 | 31 |
Match score weights: distance 35% · size 25% · config 20% · recency 20%. Top-matched comps best support the ARV.
Projected returns pro-forma
-3.0% appreciation · 3.0% rent growth · sell at horizon
- IRR
- -5.3%
- Equity multiple
- 0.80×
- Total profit
- $-13,235
- Equity at exit
- $35,785
- IRR
- 4.4%
- Equity multiple
- 1.32×
- Total profit
- $21,383
- Equity at exit
- $20,751
Cash invested: $67,200 (down + closing). Projections, not guarantees.
Landlord ↔ Tenant lean methodology
- Overall (STATE)
- 90 Strongly Landlord-Friendly
- State Indiana
- 90 Strongly Landlord-Friendly · R+11
- County
- — inherits STATE
- City
- — inherits STATE
ZIP-level market 46040
- Home prices YoY
- -24.4%
- Active inventory
- 303
- Price-to-rent
- 8.2×
Monthly cashflow live
- Estimated rent
- $2,440 high interval (Pro) →
- Mortgage (P&I)
- −$1,259
- Tax from tax record
- −$166 /mo · $1,988/yr
- Insurance
- −$100
- HOA
- −$0
- Vacancy / Maint / Mgmt
- −$512
- Net cashflow
- $404
Break-even live
UW: 25.0% down · 7.5% · 30yr · 1.5% tax · 5.0% vac · 8.0% maint · 8.0% mgmt
Financing live
Cash to close
- Down payment
- $60,000
- Closing costs
- $7,200
- Reserves months
- —
- Total cash needed
- —
Loan-product check · same deal, 3 products live
Conventional
25% down · 7.5% · 30yr
- Down + closing
- —
- Monthly P&I
- —
- Monthly cashflow
- —
- DSCR
- —
- Eligible?
- —
Personal DTI + credit; lowest rate.
DSCR
20% down · 8.5% · 30yr
- Down + closing
- —
- Monthly P&I
- —
- Monthly cashflow
- —
- DSCR
- —
- Eligible?
- —
No personal income docs; deal must DSCR.
Hard money
10% down · 12.0% · 12mo
- Down + closing
- —
- Monthly P&I
- —
- Monthly cashflow
- —
- DSCR
- —
- Eligible?
- —
Short-term bridge; refi at stabilization.
Rent comps 7 comps
| Address | Beds | Baths | Sqft | Rent | $/sqft | DOM | Units | Dist |
|---|---|---|---|---|---|---|---|---|
| 405 Thomas Point Dr Fortville, IN | 4.0 | 2.5 | 2132 | $2,995 | $1.40 | 23d | 1 | 0.45mi |
| 412 N Merrill St Fortville, IN | 3.0 | 3.0 | 2560 | $2,250 | $0.88 | 2d | 1 | 0.63mi |
| 650 N Main St Fortville, IN | 1.0–3.0 | 2.0 | 1189 | $1,939 | $1.63 | 1d | 4 | 0.72mi |
| 542 Jefferson St Fortville, IN | 4.0 | 3.0 | 2329 | $2,200 | $0.94 | 1d | 1 | 0.90mi |
| 570 Jefferson St Fortville, IN | 4.0 | 3.5 | 2255 | $2,299 | $1.02 | 3d | 1 | 0.91mi |
| 1670 Crossley St Fortville, IN | 4.0 | 2.5 | 2386 | $2,600 | $1.09 | 23d | 1 | 1.40mi |
| 1435 Hardin St Unit 1 Fortville, IN | 3.0 | 2.0 | 1530 | $1,900 | $1.24 | 17d | 1 | 1.46mi |
Listing history 20 events
-
2026-06-13statusdays on market $240,000 Pending 34 DOM
-
2026-06-09days on market $240,000 Active 33 DOM
-
2026-06-08days on market $240,000 Active 32 DOM
-
2026-06-07days on market $240,000 Active 31 DOM
-
2026-06-05days on market $240,000 Active 28 DOM
-
2026-06-03days on market $240,000 Active 27 DOM
-
2026-06-02days on market $240,000 Active 26 DOM
-
2026-06-02price $240,000 Active 25 DOM
-
2026-06-01days on market $250,000 Active 25 DOM
-
2026-05-31days on market $250,000 Active 24 DOM
-
2026-05-07$250,000 Active
-
2026-03-07historical
-
2025-12-18price $270,000
-
2025-12-06$289,900 Active
-
2021-09-24soldstatus $135,000 Closed 257-char remark
Show marketing remark (257 chars)
Wonderful Investment Opportunity in Fortville...! Bring your Investor / Rehab Clients for this 3-Bedroom, 1-Full Bath, 2-Story Home on a Half-Acre conveniently located to downtown Fortville; Property to be Sold As-Is as Seller Will Not be making Any Repairs
-
2021-08-20status Pending 257-char remark
Show marketing remark (257 chars)
Wonderful Investment Opportunity in Fortville...! Bring your Investor / Rehab Clients for this 3-Bedroom, 1-Full Bath, 2-Story Home on a Half-Acre conveniently located to downtown Fortville; Property to be Sold As-Is as Seller Will Not be making Any Repairs
-
2021-08-19$139,900 Active 257-char remark
Show marketing remark (257 chars)
Wonderful Investment Opportunity in Fortville...! Bring your Investor / Rehab Clients for this 3-Bedroom, 1-Full Bath, 2-Story Home on a Half-Acre conveniently located to downtown Fortville; Property to be Sold As-Is as Seller Will Not be making Any Repairs
-
2013-06-17historical
-
2013-06-07soldstatus $68,000
-
2012-11-06$69,900
ⓘ Source: listings_history table (triggers on properties + properties_extension) + one-shot
backfill from property_details.listing_events for pre-trigger history.
Tax reassessment forecast IN · Partial reset (capped growth)
- Current annual tax
- $1,988 · $166/mo
- Projected year-2 tax
- $2,014 · $168/mo
- Expected delta
- +$26/yr (+$2/mo · 1.3%)
ⓘ Screening estimate from a state-policy table — verify with the county assessor before closing.
Climate risk First Street
- Flood 1/10 Low FEMA zone X (unshaded) · 0% chance over 30 yrs
- Wildfire 1/10 Low
- Heat 3/10 Moderate 7 d/yr ≥101°F today · 18 d/yr by 30 yrs out
- Wind 2/10 Low 100% chance of damaging wind over 30 yrs
- Air quality 2/10 Low 1 unhealthy d/yr today · 2 by 30 yrs out
Nearby sold comps map
Loading sold comps map…
Walkable amenities ~0.75 mi
Loading nearby amenities…
Taxation est. · year 1
- Rental income
- $29,283
- − Mortgage interest
- −$13,444
- − Property taxes
- −$1,988
- − Insurance
- −$1,200
- − Repairs & maintenance
- −$2,343
- − Management
- −$2,343
- − Depreciation
- −$6,982
- Taxable income
- $984
- Est. tax owed @ 24.0%
- −$236
- After-tax cash flow
- $4,606/yr
For passive investors: Depreciation is non-cash, so a rental often shows a tax loss while cash-flowing — sheltering income. Rental losses are passive: they offset passive income freely, and up to $25,000/yr can offset ordinary (W-2) income if you actively participate and your MAGI is under $100k (phasing out to $0 by $150k); unused losses carry forward. On sale, claimed depreciation is recaptured at up to 25%, and gains may owe capital-gains tax (a 1031 exchange can defer both). Figures are a year-1 estimate at your 24.0% rate — not tax advice; consult a CPA.
Schools (NCES district)
- District
- Mt Vernon Community School Corporation
- NCES district ID
- 1807260
- Math proficiency
- 43% ▼ -12.00%
- Reading proficiency
- 48% ▼ -7.00%
- Median HH income
- $73,671
- Composite
- 41.3/100
- National rank
- #3514
- State rank
- #70 of 301 in IN
Livability — Fortville
- Score
- 69/100
- State rank
- #189
- US rank
- #8710
Category grades
Schools grade is shown separately in the Schools card above.
Census & demographics
- Census place
- Fortville, IN
- Population (ZIP)
- 17,891
Population outlook (Hancock County) Hauer SSP2
- Today (2025)
- 77,820 people
- By 2030
- 79,914 · +2.7%
- By 2040
- 82,734 · +6.3%
- By 2050
- 83,348 · +7.1%
- By 2075
- 82,439 · +5.9%
- By 2100
- 74,181 · -4.7%
Race, ethnicity, and origin ACS 2023
- Neighborhood character
- Predominantly White (83%)
- Race & ethnicity
- White 83% Black 6% Two or more races 4% Asian 4% Hispanic / Latino 2%
- Common ancestry
- Lithuanian 5% Romanian 2% Portuguese 2%
- Foreign-born
- 5% · Canada
- Languages at home
- 94% English-only · Other Indo-European 3% Arabic 1% Spanish 1%
Political lean MEDSL · Hancock
- 2024 margin
- Solid R (+33.7) · D 32.2% · R 65.9% · Other 1.9%
- 2008→2024 swing
- -4.1pp toward R · 2008: -29.6pp · 2024: -33.7pp
- All cycles
- 2024: R+33.7 2020: R+37.5 2016: R+44.8 2012: R+41.0 2008: R+29.6
Not yet ingested
- Civics
- —
Market trends
- HPI YoY
- ▼ -71.54%
- Current HPI
- 221.8703
- Rent YoY
- —
- Metro
- —
- State GDP YoY
- ▲ 2.90%
- F500 in state
- 18
Industry mix (Fortune 500 HQ in IN)
| Industry | F500 HQs | Revenue |
|---|---|---|
| Industrial Machinery | 2 | $37B |
|
||
| Healthcare | 1 | $177B |
|
||
| Pharmaceuticals | 1 | $45B |
|
||
| Metals / Steel | 1 | $18B |
|
||
| Agriculture | 1 | $17B |
|
||
| Packaging | 1 | $12B |
|
||
Price history
+257.7% since first listed10 events — show timeline
- 2026-05-07 Listed $250,000 MIBOR as Distributed by MLS Grid
- 2026-03-07 Listing Removed — MIBOR as Distributed by MLS Grid
- 2025-12-18 Price Changed $270,000 MIBOR as Distributed by MLS Grid
- 2025-12-06 Listed $289,900 MIBOR as Distributed by MLS Grid
- 2021-09-24 Sold (MLS) $135,000 MIBOR as Distributed by MLS Grid
- 2021-08-20 Pending — MIBOR as Distributed by MLS Grid
- 2021-08-19 Listed $139,900 MIBOR as Distributed by MLS Grid
- 2013-06-17 Listing Removed — MIBOR as Distributed by MLS Grid
- 2013-06-07 Sold (MLS) $68,000 MIBOR as Distributed by MLS Grid
- 2012-11-06 Listed $69,900 MIBOR as Distributed by MLS Grid
Property tax history
+13.8%/yrLatest (2025): $1,988 · +36.7% YoY. Source: county tax records.
Cash-flow waterfall
monthlySold comps — $/sqft
last 12 mo · ≤1 miLoading sold comps…