 Multi-family
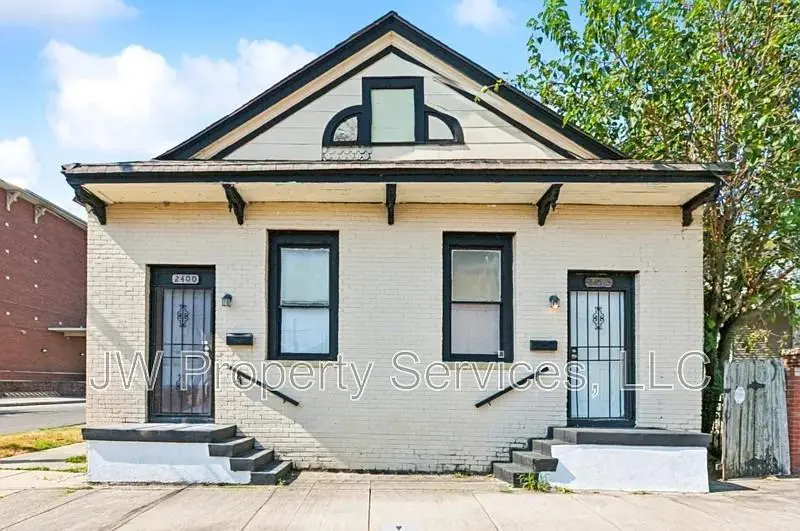
2400 02 Dumaine St · New Orleans, LA
Flood risk 8/10 · Major
- FEMA flood zone
- X (shaded)
- Chance of flooding over 30 yrs
- 0.6%
- Est. flood insurance / yr
- $507 – $1,088
Fire risk 1/10 · Minimal
- Est. fire insurance / yr
- $1,269 – $2,357
Heat risk 10/10 · Severe
- Hot days now (above 108°F)
- 7 days/yr
- Hot days in 30 yrs
- 21 days/yr
Wind risk 10/10 · Severe
- Chance of severe wind over 30 yrs
- 99.0%
Air-quality risk 4/10 · Minor
- Unhealthy air days now
- 4 days/yr
- Unhealthy air days in 30 yrs
- 4 days/yr
Risk factors via First Street. Map © Google.
Why this score? — see what drove the B- grade
The composite is a weighted blend of 9 inputs, each scored 0–100. Each bar is that input's sub-score; the figure is the points it added to the 100-point composite (weight × sub-score).
- Cash flow +25.5/30.0
- ARV discount +15.0/15.0
- DSCR +8.4/10.0
- 1% rule +6.3/10.0
- Livability +4.0/5.0
- Rent growth +2.5/5.0
- Condition / age +2.5/5.0
- Schools +1.6/10.0
- Appreciation +0.0/10.0
$198,900
🖨 Deal sheet (PDF) 📄 Offer letter ✓ Due diligence
Multi-family units
County records classify this as Multi-Family (2-4 Unit). Listing-text estimate: 1 unit. estimate disagrees with records
Listing remarks MLS
Owner Financing. Bond for Deed available. This double is part of a larger portfolio of 140+ rental units throughout New Orleans and the surrounding areas. The property is currently leased, sits on a corner lot only a half-mile from Whole Foods and Mid-City Restaurants, and 4-blocks to Esplanade Blvd. Wonderful opportunity for investment, live in one side and rent the second side, or convert this into a single family home.
Key facts
- Corner lot
- 2,975 sq ft lot
- Built 1901
Tags
Property features AI
Finance
- Financial info: Two-unit property; Tenants pay electricity, gas and water
Exterior
- Utilities: Public water; Public sewer
- Home design: Single-story property; Entry on grade (slab foundation)
- Construction: Shingle roof; Slab foundation
- Exterior features: City lot; Rectangular lot; Lot dimensions approximately 33 x 90
Interior
- Bathrooms: 2 full bathrooms
- Heating & cooling: Central heating; Central air conditioning
- Interior features: Average condition; 1-story layout
Neighborhood map
What this means for you Summary
Snapshot
- This is a 4-bed/2.0-bath multifamily listed at $199k.
Deal economics
- At list price, monthly cash flow is $395 ($5k/yr) — positive.
- The deal already cash-flows at list — no discount required.
- Meets the 1% rule at list price ($2k rent vs $199k).
- Recommended offer: $193k (3.0% below list) — sets the bar for market timing.
- Cap rate 9.1% vs local median 4.4% in New Orleans — top-decile yield for the area; either an underpriced asset or a hidden risk that comps aren't pricing in. Stress-test before assuming the spread holds.
Location & tenants
- Location reads 81/100 on livability (#3 in LA, #1,383 nationally) — a professional / high-income tenant draw. Strengths: amenities A+, commute A+, health & safety A+; Watch: crime C-, employment D.
- Orleans Parish (urban): math 11% / reading 27% proficiency, ranked #69 of 98 in LA (top 70%) — low school quality limits family demand, transient renter base, plan for 1-2y turnover; 68% free/reduced lunch — lower-income household profile, screen leases tightly.
- Market conditions: Rents soft (-0.2%/yr); 381 active listings in the ZIP; 40 comparable units currently listed for rent nearby; rentals at typical pace (median 25d on market — plan ~3-4 weeks tenant-placement turnaround); 710 units permitted in Orleans Parish in 2024 (244 in 5+ unit buildings).
- At $2,238/mo this rent would consume 51% of the median local household income ($53k/yr) (locally 3381% of renters already pay >50% of income on rent) — very limited rent-growth headroom before tenants either downsize or default.
Forward outlook
- Local home prices are declining (-3.0%/yr); year-one equity from $1k of loan paydown is wiped out by about $6k of value loss. Plan a longer hold.
- Orleans County population projected at +61% by 2050 — long-run rental-demand tailwind backs the buy-and-hold thesis.
Negotiation context
- It's been on market 51 days — a 3% lower offer ($193k) is reasonable based on typical stale-listing flexibility.
- 12 sale attempts since 25y ago; this cycle's ask is 19890% above the opening price — seller raised mid-cycle; expect resistance to lowballs.
Risks & watch-outs
- Watch-outs: flood insurance adds $66/mo; built in 1901 — expect roof / HVAC / electrical / plumbing capex.
- Climate carrying-cost: severe flood risk; severe wind risk, 99% chance of damaging wind over 30y; extreme-heat days projected 7→21/yr by 2055 (HVAC capex compounding) — expect insurance premiums to compound above CPI over the hold.
Questions for the listing agent
- It's been on market 51 days. Have you received any prior offers? Is the seller open to a 3% concession, seller financing, or rate buy-down credit?
- Built in 1901 — when were the roof, HVAC, electrical panel, plumbing, and water heater last replaced?
- What's the actual annual flood-insurance premium (NFIP or private), and is the property in a SFHA with mandatory coverage?
- Is there a deadline driving the sale (1031 exchange, divorce, estate, relocation)? That informs how much negotiation room exists.
- What's the average days-on-market for RENTAL listings here right now (not sales)? A rising rental-DOM trend means longer vacancies and softer asking-rent achievability than the comps imply.
- What's the recent tenant-quality profile in this submarket — average credit score on applications, eviction rate, late-payment / NSF rate, and stable-employment percentage? A property-management company in the area should have these aggregated.
- How much new apartment / multifamily construction is in the pipeline within 1–3 miles? Heavy new supply (>2% of stock underway) typically softens rents 12–24 months out; light construction supports rent growth.
Investment metrics
- 1% rule
- 1.13% ✓
- Cap rate
- 9.08%
- Cash-on-cash
- 9.94%
- DSCR
- 1.44
- GRM
- 7.4
CMA / ARV
- ARV (median comp)
- $387,815
- List price
- $198,900
- Delta
- -48.71%
- Verdict
- UNDERPRICED
- Comps
- 20 within 1.0 mi
Show comp detail 12 sales within ~0.75 mi
| Address | Dist | Beds/Ba | Sqft | Sold | Price | $/sf | Match |
|---|---|---|---|---|---|---|---|
| 2216-18 Saint Louis St | 0.30mi | 4/2.0 | 1,689 (+4%) | 1mo | $335,000 | $198 | 79 |
| 2612-2614 St. Philip St | 0.19mi | 4/2.0 | 1,517 (-7%) | 3mo | $299,000 | $197 | 77 |
| 917 N Prieur St | 0.27mi | 4/2.0 | 1,700 (+5%) | 4mo | $315,000 | $185 | 77 |
| 2013-15 Conti St | 0.41mi | 4/2.0 | 1,610 (-1%) | 5mo | $65,000 | $40 | 76 |
| 2643 45 Dumaine St | 0.22mi | 4/2.0 | 1,479 (-9%) | 3mo | $298,000 | $201 | 73 |
| 2025 Conti St | 0.40mi | 4/2.0 | 1,680 (+3%) | 8mo | $285,000 | $170 | 69 |
| 2617 Toulouse St | 0.26mi | 4/4.0 | 1,750 (+8%) | 1mo | $215,000 | $123 | 66 |
| 2828 30 St Ann St | 0.41mi | 4/3.5 | 1,534 (-6%) | 5mo | $265,000 | $173 | 61 |
| 2118 20 Onzaga St | 0.70mi | 4/2.0 | 1,526 (-6%) | 1mo | $182,000 | $119 | 56 |
| 1552 54 N Derbigny St | 0.72mi | 4/3.0 | 1,681 (+4%) | 5mo | $330,000 | $196 | 53 |
| 3150 52 Toulouse St | 0.66mi | 4/4.0 | 1,690 (+4%) | 3mo | $382,000 | $226 | 52 |
| 1024 26 N Rocheblave St | 0.70mi | 4/5.0 | 1,826 (+12%) | 6mo | $380,000 | $208 | 30 |
Match score weights: distance 35% · size 25% · config 20% · recency 20%. Top-matched comps best support the ARV.
Projected returns pro-forma
-3.0% appreciation · 0.0% rent growth · sell at horizon
- IRR
- -6.8%
- Equity multiple
- 0.76×
- Total profit
- $-13,605
- Equity at exit
- $29,657
- IRR
- -1.4%
- Equity multiple
- 0.92×
- Total profit
- $-4,673
- Equity at exit
- $17,197
Cash invested: $55,692 (down + closing). Projections, not guarantees.
Landlord ↔ Tenant lean methodology
- Overall (STATE)
- 90 Strongly Landlord-Friendly
- State Louisiana
- 90 Strongly Landlord-Friendly · R+12
- County
- — inherits STATE
- City
- — inherits STATE
ZIP-level market 70119
- Home prices YoY
- -34.8%
- Rents YoY
- -0.2%
- Active inventory
- 381
- Price-to-rent
- 7.4×
Monthly cashflow live
- Estimated rent
- $2,238 high interval (Pro) →
- Mortgage (P&I)
- −$1,043
- Tax from tax record
- −$181 /mo · $2,166/yr
- Insurance
- −$83
- Flood insurance flood zone
- −$66 /mo · $798/yr
- HOA
- −$0
- Vacancy / Maint / Mgmt
- −$470
- Net cashflow
- $395
Break-even live
Sensitivity live
| Price | -10% $507 | -5% $451 | +0% $395 | +5% $339 | +10% $282 |
|---|---|---|---|---|---|
| Rent | -10% $218 | -5% $306 | +0% $395 | +5% $483 | +10% $572 |
| Rate | -1.0pp $495 | -0.5pp $445 | base $395 | +0.5pp $343 | +1.0pp $291 |
UW: 25.0% down · 7.5% · 30yr · 1.5% tax · 5.0% vac · 8.0% maint · 8.0% mgmt
Financing live
Cash to close
- Down payment
- $49,725
- Closing costs
- $5,967
- Reserves months
- —
- Total cash needed
- —
Loan-product check · same deal, 3 products live
Conventional
25% down · 7.5% · 30yr
- Down + closing
- —
- Monthly P&I
- —
- Monthly cashflow
- —
- DSCR
- —
- Eligible?
- —
Personal DTI + credit; lowest rate.
DSCR
20% down · 8.5% · 30yr
- Down + closing
- —
- Monthly P&I
- —
- Monthly cashflow
- —
- DSCR
- —
- Eligible?
- —
No personal income docs; deal must DSCR.
Hard money
10% down · 12.0% · 12mo
- Down + closing
- —
- Monthly P&I
- —
- Monthly cashflow
- —
- DSCR
- —
- Eligible?
- —
Short-term bridge; refi at stabilization.
Rent comps 40 comps
| Address | Beds | Baths | Sqft | Rent | $/sqft | DOM | Units | Dist |
|---|---|---|---|---|---|---|---|---|
| 2129 Dumaine St New Orleans, LA | 3.0 | 2.0 | 1226 | $1,850 | $1.51 | 4d | 1 | 0.15mi |
| 2517 Ursulines Ave New Orleans, LA | 3.0 | 2.0 | 1136 | $1,950 | $1.72 | 24d | 1 | 0.18mi |
| 1929 Dumaine St New Orleans, LA | 3.0 | 1.0 | 1293 | $1,500 | $1.16 | 4d | 1 | 0.28mi |
| 2731 Saint Philip St Unit 2733 New Orleans, LA | 4.0 | 2.0 | 2000 | $2,600 | $1.30 | 24d | 1 | 0.33mi |
| 2320 Conti St New Orleans, LA | 3.0 | 2.0 | 1125 | $2,500 | $2.22 | 24d | 1 | 0.38mi |
| 1035 N Derbigny St New Orleans, LA | 3.0 | 1.0 | 1075 | $1,399 | $1.30 | 24d | 1 | 0.41mi |
| 315 N Miro St New Orleans, LA | 3.0 | 3.0 | 1276 | $2,300 | $1.80 | 21d | 1 | 0.42mi |
| 315 N Miro St New Orleans, LA | 3.0 | 3.0 | 1276 | $2,500 | $1.96 | 24d | 1 | 0.42mi |
| 2033 Conti St New Orleans, LA | 3.0 | 3.0 | 1249 | $2,250 | $1.80 | 15d | 1 | 0.43mi |
| 824 N Dupre St New Orleans, LA | 3.0 | 2.0 | 1315 | $2,250 | $1.71 | 17d | 1 | 0.43mi |
| 1908 Saint Louis St New Orleans, LA | 3.0 | 3.0 | 1234 | $2,300 | $1.86 | 24d | 1 | 0.44mi |
| 2105 Bienville St New Orleans, LA | 3.0 | 3.0 | 1231 | $2,350 | $1.91 | 17d | 1 | 0.46mi |
| 2331 Columbus St New Orleans, LA | 3.0 | 1.0 | 1976 | $1,850 | $0.94 | 24d | 1 | 0.47mi |
| 2024 Bienville St New Orleans, LA | 3.0 | 2.0 | 1314 | $2,100 | $1.60 | 24d | 1 | 0.50mi |
| 324 N Roman St New Orleans, LA | 3.0 | 3.0 | 2100 | $2,500 | $1.19 | 44d | 1 | 0.52mi |
| 2664 Lepage St New Orleans, LA | 3.0 | 2.0 | 1750 | $2,725 | $1.56 | 44d | 1 | 0.54mi |
| 2329 Laharpe St New Orleans, LA | 3.0 | 1.0 | 1250 | $1,000 | $0.80 | 20d | 1 | 0.54mi |
| 2738 Bienville St New Orleans, LA | 4.0 | 3.0 | 1671 | $2,200 | $1.32 | 24d | 1 | 0.56mi |
| 1525 N Broad St New Orleans, LA | 3.0 | 1.0 | 1100 | $1,600 | $1.45 | 24d | 1 | 0.58mi |
| 1466 N White St New Orleans, LA | 3.0 | 1.5 | 1500 | $2,250 | $1.50 | 4d | 1 | 0.64mi |
| 1472 N Claiborne Ave New Orleans, LA | 3.0 | 1.0 | 1312 | $1,900 | $1.45 | 16d | 1 | 0.66mi |
| 2517 Palmyra St New Orleans, LA | 3.0 | 2.0 | 1306 | $2,100 | $1.61 | 17d | 1 | 0.73mi |
| 3232 Conti St New Orleans, LA | 3.0 | 2.0 | 1140 | $3,500 | $3.07 | 44d | 1 | 0.76mi |
| 1021 Henriette Delille St New Orleans, LA | 3.0 | 2.0 | 2012 | $2,250 | $1.12 | 17d | 1 | 0.78mi |
| 326 S Dorgenois St Unit 326 New Orleans, LA | 4.0 | 3.0 | 1510 | $2,300 | $1.52 | 2d | 1 | 0.79mi |
| 1735 N Tonti St New Orleans, LA | 3.0 | 1.0 | 1197 | $1,650 | $1.38 | 24d | 1 | 0.80mi |
| 2615 Banks St New Orleans, LA | 3.0 | 2.0 | 1200 | $1,900 | $1.58 | 3d | 1 | 0.82mi |
| 1247 Kerlerec St New Orleans, LA | 3.0 | 2.0 | 1500 | $2,500 | $1.67 | 44d | 1 | 0.82mi |
| 1245 Kerlerec St New Orleans, LA | 3.0 | 2.0 | 1500 | $2,500 | $1.67 | 44d | 1 | 0.82mi |
| 1217 Kerlerec St Unit B New Orleans, LA | 3.0 | 1.0 | 1300 | $2,100 | $1.62 | 4d | 1 | 0.85mi |
| 439 N Norman C Francis Pkwy Unit 1A New Orleans, LA | 3.0 | 1.0 | 1200 | $1,700 | $1.42 | 22d | 1 | 0.86mi |
| 2652 Banks St New Orleans, LA | 3.0 | 3.5 | 1204 | $2,100 | $1.74 | 24d | 1 | 0.87mi |
| 2912 Palmyra St Unit D New Orleans, LA | 3.0 | 2.0 | 1257 | $1,650 | $1.31 | 24d | 1 | 0.88mi |
| 227 S Gayoso St Unit 2h New Orleans, LA | 3.0 | 2.0 | 1800 | $2,500 | $1.39 | 44d | 1 | 0.88mi |
| 618 N Rampart St #204 New Orleans, LA | 3.0 | 2.5 | 1904 | $4,500 | $2.36 | 44d | 1 | 0.89mi |
| 811 Burgundy St New Orleans, LA | 4.0 | 2.5 | 2059 | $5,000 | $2.43 | 44d | 1 | 0.92mi |
| 1831 N Miro St New Orleans, LA | 3.0 | 2.0 | 1882 | $2,500 | $1.33 | 44d | 1 | 0.96mi |
| 2304 Gravier St Unit 2304 New Orleans, LA | 3.0 | 2.0 | 1112 | $1,800 | $1.62 | 16d | 1 | 0.97mi |
| 1818 Paul Morphy St Unit B New Orleans, LA | 3.0 | 2.0 | 1065 | $1,800 | $1.69 | 24d | 1 | 0.97mi |
| 2539 Gravier St Unit 2541 New Orleans, LA | 3.0 | 1.0 | 1115 | $1,495 | $1.34 | 16d | 1 | 0.98mi |
Listing history 48 events
-
2026-06-18days on market $198,900 Active 51 DOM
-
2026-06-17days on market $198,900 Active 50 DOM
-
2026-06-16days on market $198,900 Active 49 DOM
-
2026-06-15days on market $198,900 Active 48 DOM
-
2026-06-13days on market $198,900 Active 46 DOM
-
2026-06-10days on market $198,900 Active 43 DOM
-
2026-06-09days on market $198,900 Active 42 DOM
-
2026-06-08days on market $198,900 Active 41 DOM
-
2026-06-07days on market $198,900 Active 40 DOM
-
2026-06-05days on market $198,900 Active 37 DOM
-
2026-06-03days on market $198,900 Active 36 DOM
-
2026-06-02days on market $198,900 Active 35 DOM
-
2026-06-01days on market $198,900 Active 34 DOM
-
2026-05-31days on market $198,900 Active 33 DOM
-
2026-05-14price $198,900 373-char remark
-
2026-05-14price $895
-
2026-04-29$995
-
2026-04-28historical $995
-
2026-04-28$224,900 Active 373-char remark
-
2026-04-26$995
-
2025-10-13historical $995
-
2025-10-09price $995
-
2025-09-30price $1,195
-
2025-09-17$1,500
-
2025-04-22price $194,900
-
2025-01-20price $198,900
-
2024-11-13historical $1,345
-
2024-11-13$1,345
-
2024-05-29historical $1,345
-
2024-05-18$1,345
-
2023-11-15historical $1,200
-
2023-09-14$1,200
-
2023-07-21soldstatus $175,000 Closed
Show marketing remark (425 chars)
Owner Financing. Bond for Deed available. This double is part of a larger portfolio of 140+ rental units throughout New Orleans and the surrounding areas. The property is currently leased, sits on a corner lot only a half-mile from Whole Foods and Mid-City Restaurants, and 4-blocks to Esplanade Blvd. Wonderful opportunity for investment, live in one side and rent the second side, or convert this into a single family home.
-
2023-07-06historical Active Under Contract
Show marketing remark (425 chars)
Owner Financing. Bond for Deed available. This double is part of a larger portfolio of 140+ rental units throughout New Orleans and the surrounding areas. The property is currently leased, sits on a corner lot only a half-mile from Whole Foods and Mid-City Restaurants, and 4-blocks to Esplanade Blvd. Wonderful opportunity for investment, live in one side and rent the second side, or convert this into a single family home.
-
2023-05-17status Active
Show marketing remark (425 chars)
Owner Financing. Bond for Deed available. This double is part of a larger portfolio of 140+ rental units throughout New Orleans and the surrounding areas. The property is currently leased, sits on a corner lot only a half-mile from Whole Foods and Mid-City Restaurants, and 4-blocks to Esplanade Blvd. Wonderful opportunity for investment, live in one side and rent the second side, or convert this into a single family home.
-
2023-05-17historical Active Under Contract
Show marketing remark (425 chars)
Owner Financing. Bond for Deed available. This double is part of a larger portfolio of 140+ rental units throughout New Orleans and the surrounding areas. The property is currently leased, sits on a corner lot only a half-mile from Whole Foods and Mid-City Restaurants, and 4-blocks to Esplanade Blvd. Wonderful opportunity for investment, live in one side and rent the second side, or convert this into a single family home.
-
2023-05-16price $199,000
Show marketing remark (425 chars)
Owner Financing. Bond for Deed available. This double is part of a larger portfolio of 140+ rental units throughout New Orleans and the surrounding areas. The property is currently leased, sits on a corner lot only a half-mile from Whole Foods and Mid-City Restaurants, and 4-blocks to Esplanade Blvd. Wonderful opportunity for investment, live in one side and rent the second side, or convert this into a single family home.
-
2023-04-24price $225,000
Show marketing remark (425 chars)
Owner Financing. Bond for Deed available. This double is part of a larger portfolio of 140+ rental units throughout New Orleans and the surrounding areas. The property is currently leased, sits on a corner lot only a half-mile from Whole Foods and Mid-City Restaurants, and 4-blocks to Esplanade Blvd. Wonderful opportunity for investment, live in one side and rent the second side, or convert this into a single family home.
-
2023-04-03price $249,000
Show marketing remark (425 chars)
Owner Financing. Bond for Deed available. This double is part of a larger portfolio of 140+ rental units throughout New Orleans and the surrounding areas. The property is currently leased, sits on a corner lot only a half-mile from Whole Foods and Mid-City Restaurants, and 4-blocks to Esplanade Blvd. Wonderful opportunity for investment, live in one side and rent the second side, or convert this into a single family home.
-
2023-03-14price $275,000
Show marketing remark (425 chars)
Owner Financing. Bond for Deed available. This double is part of a larger portfolio of 140+ rental units throughout New Orleans and the surrounding areas. The property is currently leased, sits on a corner lot only a half-mile from Whole Foods and Mid-City Restaurants, and 4-blocks to Esplanade Blvd. Wonderful opportunity for investment, live in one side and rent the second side, or convert this into a single family home.
-
2023-03-08price $299,000
Show marketing remark (425 chars)
Owner Financing. Bond for Deed available. This double is part of a larger portfolio of 140+ rental units throughout New Orleans and the surrounding areas. The property is currently leased, sits on a corner lot only a half-mile from Whole Foods and Mid-City Restaurants, and 4-blocks to Esplanade Blvd. Wonderful opportunity for investment, live in one side and rent the second side, or convert this into a single family home.
-
2023-01-24$399,000 Active
Show marketing remark (425 chars)
Owner Financing. Bond for Deed available. This double is part of a larger portfolio of 140+ rental units throughout New Orleans and the surrounding areas. The property is currently leased, sits on a corner lot only a half-mile from Whole Foods and Mid-City Restaurants, and 4-blocks to Esplanade Blvd. Wonderful opportunity for investment, live in one side and rent the second side, or convert this into a single family home.
-
2010-01-06$24,900
-
2006-08-10soldstatus $170,000
-
2002-02-08soldstatus $20,000
-
2001-10-11$23,500
-
2001-10-11$23,500
-
1990-09-05soldstatus $13,330
ⓘ Source: listings_history table (triggers on properties + properties_extension) + one-shot
backfill from property_details.listing_events for pre-trigger history.
Tax reassessment forecast LA · Resets to sale price
- Current annual tax
- $2,166 · $181/mo
- Projected year-2 tax
- $2,166 · $181/mo
- Expected delta
- $0/yr ($0/mo · 0.0%)
ⓘ Screening estimate from a state-policy table — verify with the county assessor before closing.
Climate risk First Street
- Flood 8/10 Severe FEMA zone X (shaded) · 60% chance over 30 yrs
- Wildfire 1/10 Low
- Heat 10/10 Extreme 7 d/yr ≥108°F today · 21 d/yr by 30 yrs out
- Wind 10/10 Extreme 99% chance of damaging wind over 30 yrs
- Air quality 4/10 Moderate 4 unhealthy d/yr today · 4 by 30 yrs out
Nearby sold comps map
Loading sold comps map…
Walkable amenities ~0.75 mi
Loading nearby amenities…
Taxation est. · year 1
- Rental income
- $26,853
- − Mortgage interest
- −$11,141
- − Property taxes
- −$2,166
- − Insurance
- −$1,792
- − Repairs & maintenance
- −$2,148
- − Management
- −$2,148
- − Depreciation
- −$5,786
- Taxable income
- $1,670
- Est. tax owed @ 24.0%
- −$401
- After-tax cash flow
- $4,338/yr
For passive investors: Depreciation is non-cash, so a rental often shows a tax loss while cash-flowing — sheltering income. Rental losses are passive: they offset passive income freely, and up to $25,000/yr can offset ordinary (W-2) income if you actively participate and your MAGI is under $100k (phasing out to $0 by $150k); unused losses carry forward. On sale, claimed depreciation is recaptured at up to 25%, and gains may owe capital-gains tax (a 1031 exchange can defer both). Figures are a year-1 estimate at your 24.0% rate — not tax advice; consult a CPA.
Schools (NCES district)
- District
- Orleans Parish
- NCES district ID
- 2201170
- Math proficiency
- 11% ▼ -52.00%
- Reading proficiency
- 27% ▼ -46.00%
- Median HH income
- $37,011
- Composite
- 15.78/100
- National rank
- #9271
- State rank
- #69 of 98 in LA
Livability — New Orleans
- Score
- 81/100
- State rank
- #3
- US rank
- #1383
Category grades
Schools grade is shown separately in the Schools card above.
Census & demographics
- Census place
- New Orleans, LA
- County
- Orleans Parish · 338,817 people
- City population
- 338,817
- Metro
- New Orleans-Metairie, LA
- Population (ZIP)
- 37,253
- Household income
- $53,143
- Rent vs Own
- Severe rent burden
- 3381.0
Population outlook (Orleans County) Hauer SSP2
- Today (2025)
- 513,025 people
- By 2030
- 575,781 · +12.2%
- By 2040
- 700,174 · +36.5%
- By 2050
- 826,541 · +61.1%
- By 2075
- 1,123,374 · +119.0%
- By 2100
- 1,355,609 · +164.2%
Race, ethnicity, and origin ACS 2023
- Neighborhood character
- Diverse neighborhood (Simpson 0.64)
- Race & ethnicity
- Black 44% White 40% Two or more races 10% Hispanic / Latino 9% Asian 1%
- Hispanic origin (detail)
- Mexican 2%
- Common ancestry
- Lithuanian 8% Slovak 2% Romanian 1%
- Foreign-born
- 6% · Canada, Jamaica
- Languages at home
- 91% English-only · Spanish 6% French/Haitian/Cajun 1% Other Indo-European 0%
Political lean MEDSL · Orleans
- 2024 margin
- Solid D (+67.0) · D 82.2% · R 15.2% · Other 2.7%
- 2008→2024 swing
- +6.7pp toward D · 2008: 60.3pp · 2024: 67.0pp
- All cycles
- 2024: D+67.0 2020: D+68.2 2016: D+66.2 2012: D+62.5 2008: D+60.3
Not yet ingested
- Civics
- —
Market trends
- HPI YoY
- ▼ -135.38%
- Current HPI
- 253.1929
- Rent YoY
- ▼ -0.20%
- Metro
- New Orleans-Metairie, LA
- State GDP YoY
- ▲ 3.29%
- F500 in state
- 10
Industry mix (Fortune 500 HQ in LA)
| Industry | F500 HQs | Revenue |
|---|---|---|
| Telecommunications | 2 | $23B |
|
||
| Utilities | 1 | $12B |
|
||
| Wholesale / Distribution | 1 | $5B |
|
||
| Advertising | 1 | $2B |
|
||
Price history
+1392.1% since first listed35 events — show timeline
- 2026-05-28 Rental Removed $895 TENANTTURNER2
- 2026-05-14 Price Changed $198,900 GSREIN
- 2026-05-14 Price Changed $895 TENANTTURNER2
- 2026-04-29 Listed for Rent $995 TENANTTURNER2
- 2026-04-28 Rental Removed $995 APPFOLIO
- 2026-04-28 Listed $224,900 GSREIN
- 2026-04-26 Listed for Rent $995 APPFOLIO
- 2025-10-13 Rental Removed $995 TENANTTURNER2
- 2025-10-09 Price Changed $995 TENANTTURNER2
- 2025-09-30 Price Changed $1,195 TENANTTURNER2
- 2025-09-17 Listed for Rent $1,500 TENANTTURNER2
- 2025-04-22 Price Changed $194,900 GSREIN
- 2025-01-20 Price Changed $198,900 GSREIN
- 2024-11-13 Rental Removed $1,345 GSREIN
- 2024-11-13 Listed for Rent $1,345 GSREIN
- 2024-05-29 Rental Removed $1,345 GSREIN
- 2024-05-18 Listed for Rent $1,345 GSREIN
- 2023-11-15 Rental Removed $1,200 GSREIN
- 2023-09-14 Listed for Rent $1,200 GSREIN
- 2023-07-21 Sold (MLS) $175,000 GSREIN
- 2023-07-06 Contingent — GSREIN
- 2023-05-17 Relisted — GSREIN
- 2023-05-17 Contingent — GSREIN
- 2023-05-16 Price Changed $199,000 GSREIN
- 2023-04-24 Price Changed $225,000 GSREIN
- 2023-04-03 Price Changed $249,000 GSREIN
- 2023-03-14 Price Changed $275,000 GSREIN
- 2023-03-08 Price Changed $299,000 GSREIN
- 2023-01-24 Listed $399,000 GSREIN
- 2010-01-06 Listed $24,900 GSREIN
- 2006-08-10 Sold (Public Records) $170,000 Public Records
- 2002-02-08 Sold (MLS) $20,000 GSREIN
- 2001-10-11 Listed $23,500 GSREIN
- 2001-10-11 Listed $23,500 AcadianaMLS
- 1990-09-05 Sold (Public Records) $13,330 Public Records
Property tax history
+1.3%/yrLatest (2026): $2,166 · +1.1% YoY. Source: county tax records.
Cash-flow waterfall
monthlySold comps — $/sqft
last 12 mo · ≤1 miLoading sold comps…