4 Annette Ln · Bella Vista, AR
Flood risk 1/10 · Minimal
- FEMA flood zone
- X (unshaded)
- Chance of flooding over 30 yrs
- 0.0%
- Est. flood insurance / yr
- $507 – $1,088
Fire risk 3/10 · Minor
- Est. fire insurance / yr
- $1,499 – $2,785
Heat risk 5/10 · Moderate
- Hot days now (above 105°F)
- 7 days/yr
- Hot days in 30 yrs
- 21 days/yr
Wind risk 2/10 · Minimal
- Chance of severe wind over 30 yrs
- 2.0%
Air-quality risk 2/10 · Minimal
- Unhealthy air days now
- 0 days/yr
- Unhealthy air days in 30 yrs
- 1 days/yr
Risk factors via First Street. Map © Google.
Why this score? — see what drove the D+ grade
The composite is a weighted blend of 9 inputs, each scored 0–100. Each bar is that input's sub-score; the figure is the points it added to the 100-point composite (weight × sub-score).
- ARV discount +13.8/15.0
- Cash flow +12.1/30.0
- Schools +5.2/10.0
- DSCR +3.6/10.0
- Livability +3.4/5.0
- 1% rule +3.0/10.0
- Rent growth +2.5/5.0
- Condition / age +2.5/5.0
- Appreciation +0.0/10.0
$204,000
🖨 Deal sheet 📄 Offer letter ✓ Due diligence
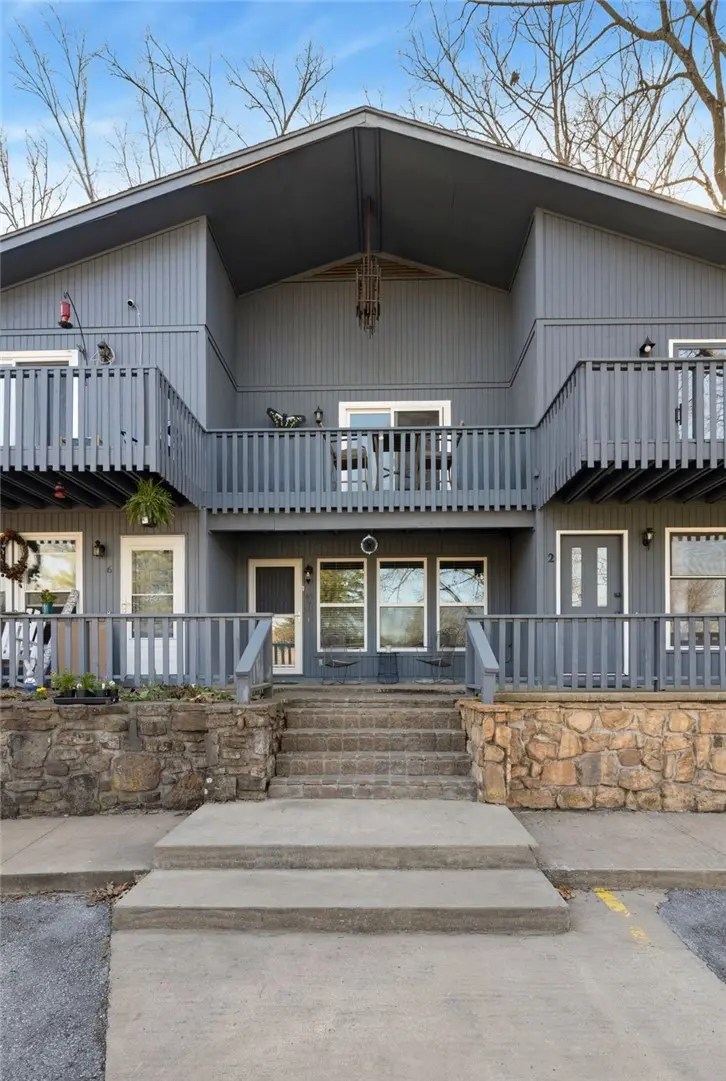
Listing remarks
Ideally situated in a central Bella Vista location, this townhome offers a convenient, low-maintenance lifestyle—perfect for first-time buyers, investors, or those looking to enjoy all the community offers. With close proximity to the Bella Vista Country Club, trails, golf courses, and recreational amenities, this property provides easy access to everyday essentials and outdoor recreation. The main level features a comfortable living area, dining space, galley-style kitchen, and a half bathroom. Upstairs, you’ll find two bedrooms, a full bathroom, and a utility room. The primary bedroom includes sliding glass doors that open to a private balcony, creating a peaceful space to rel
Key facts
- $130 HOA
- Built 1976
- Listed 80 days
Property features AI
Finance
- HOA & community: Homeowners association with a monthly fee of $130; Community includes lake access
Exterior
- Security: Smoke detectors
- Utilities: Cable available; Public water; Public sewer
- Home design: 2-story property; 25+ years old
- Construction: Masonite exterior; Architectural shingle roof; Slab foundation
- Exterior features: Concrete driveway; Balcony; Located near Lake Windsor
Interior
- Kitchen: Dishwasher; Electric cooktop; Electric oven; Electric range; Garbage disposal
- Flooring: Tile
- Bathrooms: 1 full bathroom; 1 half bathroom
- Heating & cooling: Electric heating; Central electric air conditioning
- Interior features: Ceiling fans; Window treatments; Blinds
- Laundry & utility: Electric water heater
Neighborhood map
What this means for you Summary
Snapshot
- This is a 2-bed/1.5-bath single-family listed at $204k.
Deal economics
- At list price, monthly cash flow is $-45 ($-536/yr) — negative.
- To cash-flow at today's rent, offer at most $196k (3.9% below list).
- To meet the 1% rule (rent ≥ 1% of price), the offer needs to be $163k (20.3% below list).
- Recommended offer: $163k (20.3% below list) — sets the bar for 1% rule.
- Cap rate 6.0% vs local median 3.6% in Bella Vista — top-decile yield for the area; either an underpriced asset or a hidden risk that comps aren't pricing in. Stress-test before assuming the spread holds.
Location & tenants
- Location reads 67/100 on livability (#111 in AR) — a middle-class / working-renter tenant base. Strengths: cost of living A+, housing A+, schools A; Watch: amenities F, commute F, health & safety F.
- Bentonville School District (urban): math 59% / reading 59% proficiency, ranked #3 of 238 in AR (top 1%) — acceptable for families but not a draw, mixed tenant base, ~2y average lease.
- Market conditions: 827 active listings in the ZIP; 1 comparable units currently listed for rent nearby; solid renter incomes; 4,359 units permitted in Benton County in 2024 (402 in 5+ unit buildings).
Forward outlook
- Local home prices are declining (-3.0%/yr); year-one equity from $1k of loan paydown is wiped out by about $6k of value loss. Plan a longer hold.
- Benton County population projected at +56% by 2050 — long-run rental-demand tailwind backs the buy-and-hold thesis.
Negotiation context
- It's been on market 80 days — a 6% lower offer ($192k) is reasonable based on typical stale-listing flexibility.
- Current owner paid $50k; list at $204k implies a 308% gain — meaningful room to come down on a strong offer.
Risks & watch-outs
- Climate carrying-cost: extreme-heat days projected 7→21/yr by 2055 (HVAC capex compounding) — expect insurance premiums to compound above CPI over the hold.
Questions for the listing agent
- What do current leases actually rent for vs. the listed asking? Can we see a recent rent roll and the last 12 months of T-12 income?
- It's been on market 80 days. Have you received any prior offers? Is the seller open to a 20% concession, seller financing, or rate buy-down credit?
- Built in 1976 — when were the roof, HVAC, electrical panel, plumbing, and water heater last replaced?
- What does the HOA fee cover, when was the last increase, and are there any pending special assessments or reserve-fund shortfalls?
- Why hasn't it sold? Are there any deal-killer items the seller is aware of (foundation, flood, title, zoning, code violations)?
- Is there a deadline driving the sale (1031 exchange, divorce, estate, relocation)? That informs how much negotiation room exists.
- Schools are A-rated — typically a magnet for longer-tenancy family renters. What's the average tenant stay here, and is there a school-zone premium baked into asking?
- The area grade is low — what's the realistic commute time and amenity access for the typical tenant pool here? Any planned neighborhood developments (good or bad) we should know about?
- What's the average days-on-market for RENTAL listings here right now (not sales)? A rising rental-DOM trend means longer vacancies and softer asking-rent achievability than the comps imply.
- What's the recent tenant-quality profile in this submarket — average credit score on applications, eviction rate, late-payment / NSF rate, and stable-employment percentage? A property-management company in the area should have these aggregated.
- How much new for-sale + rental construction is in the pipeline within 1–3 miles? Heavy new supply typically softens prices + rents 12–24 months out; constrained supply supports both.
Investment metrics
- 1% rule
- 0.80% ✗
- Cap rate
- 6.03%
- Cash-on-cash
- -0.94%
- DSCR
- 0.96
- GRM
- 10.5
CMA / ARV
- ARV (on-the-fly)
- $237,184
- Comps found
- 12
Show comp detail 12 sales within ~0.75 mi
| Address | Dist | Beds/Ba | Sqft | Sold | Price | $/sf | Match |
|---|---|---|---|---|---|---|---|
| 8 Pratt Ln | 0.31mi | 2/1.5 | 1,024 (-6%) | 9mo | $190,000 | $186 | 68 |
| 8 Basore Dr | 0.47mi | 2/1.0 | 1,132 (+4%) | 3mo | $183,500 | $162 | 67 |
| 5 Formby Ln | 0.65mi | 2/1.5 | 1,089 (+0%) | 4mo | $230,000 | $211 | 66 |
| 4 Orr Ln | 0.48mi | 2/1.0 | 1,050 (-4%) | 11mo | $215,000 | $205 | 61 |
| 3 Formby Ln | 0.65mi | 2/1.5 | 1,056 (-3%) | 8mo | $235,000 | $223 | 58 |
| 41 Hope Dr | 0.58mi | 2/1.5 | 1,015 (-7%) | 8mo | $235,000 | $232 | 55 |
| 18 Duvall Ln | 0.62mi | 2/2.0 | 1,152 (+6%) | 6mo | $250,000 | $217 | 54 |
| 14 Duvall Ln | 0.59mi | 2/2.0 | 1,036 (-5%) | 14mo | $234,000 | $226 | 51 |
| 16 Coverack Ln | 0.47mi | 2/2.0 | 1,244 (+14%) | 2mo | $272,500 | $219 | 50 |
| 9 Billingsley Dr | 0.71mi | 2/1.0 | 1,056 (-3%) | 12mo | $189,900 | $180 | 50 |
| 11 Duvall Ln | 0.59mi | 3/2.0 (+1) | 1,152 (+6%) | 12mo | $280,000 | $243 | 45 |
| 3 Towan Cir | 0.70mi | 2/1.5 | 1,168 (+7%) | 14mo | $255,000 | $218 | 44 |
Match score weights: distance 35% · size 25% · config 20% · recency 20%. Top-matched comps best support the ARV.
Projected returns pro-forma
-3.0% appreciation · 3.0% rent growth · sell at horizon
- IRR
- -17.9%
- Equity multiple
- 0.37×
- Total profit
- $-35,925
- Equity at exit
- $30,417
- IRR
- -10.1%
- Equity multiple
- 0.39×
- Total profit
- $-35,046
- Equity at exit
- $17,638
Cash invested: $57,120 (down + closing). Projections, not guarantees.
Landlord ↔ Tenant lean methodology
- Overall (STATE)
- 92 Strongly Landlord-Friendly
- State Arkansas
- 92 Strongly Landlord-Friendly · R+14
- County
- — inherits STATE
- City
- — inherits STATE
ZIP-level market 72715
- Home prices YoY
- -6.6%
- Active inventory
- 827
- Price-to-rent
- 10.5×
Monthly cashflow live
- Estimated rent
- $1,625 medium interval (Pro) →
- Mortgage (P&I)
- −$1,070
- Tax from tax record
- −$44 /mo · $523/yr
- Insurance
- −$85
- HOA
- −$130
- Vacancy / Maint / Mgmt
- −$341
- Net cashflow
- $-45
Break-even live
UW: 25.0% down · 7.5% · 30yr · 1.5% tax · 5.0% vac · 8.0% maint · 8.0% mgmt
Financing live
Cash to close
- Down payment
- $51,000
- Closing costs
- $6,120
- Reserves months
- —
- Total cash needed
- —
Loan-product check · same deal, 3 products live
Conventional
25% down · 7.5% · 30yr
- Down + closing
- —
- Monthly P&I
- —
- Monthly cashflow
- —
- DSCR
- —
- Eligible?
- —
Personal DTI + credit; lowest rate.
DSCR
20% down · 8.5% · 30yr
- Down + closing
- —
- Monthly P&I
- —
- Monthly cashflow
- —
- DSCR
- —
- Eligible?
- —
No personal income docs; deal must DSCR.
Hard money
10% down · 12.0% · 12mo
- Down + closing
- —
- Monthly P&I
- —
- Monthly cashflow
- —
- DSCR
- —
- Eligible?
- —
Short-term bridge; refi at stabilization.
Rent comps 1 comps
| Address | Beds | Baths | Sqft | Rent | $/sqft | DOM | Units | Dist |
|---|---|---|---|---|---|---|---|---|
| 26 Purfleet Dr Bella Vista, AR | 3.0 | 2.0 | 1276 | $1,575 | $1.23 | 14d | 1 | 1.32mi |
HOA detail
- Monthly dues
- $130 · $1,560/yr
Listing history 18 events
-
2026-06-18days on market $204,000 Active 80 DOM
-
2026-06-17days on market $204,000 Active 79 DOM
-
2026-06-15days on market $204,000 Active 77 DOM
-
2026-06-14days on market $204,000 Active 75 DOM
-
2026-06-10days on market $204,000 Active 72 DOM
-
2026-06-09days on market $204,000 Active 71 DOM
-
2026-06-08days on market $204,000 Active 70 DOM
-
2026-06-07days on market $204,000 Active 69 DOM
-
2026-06-05pricedays on market $204,000 Active 66 DOM
-
2026-06-03days on market $207,000 Active 65 DOM
-
2026-06-02days on market $207,000 Active 64 DOM
-
2026-06-01days on market $207,000 Active 63 DOM
-
2026-05-31days on market $207,000 Active 62 DOM
-
2026-05-31days on market $207,000 Active 61 DOM
-
2026-03-30price $207,000
-
2026-03-30$189,000 Active
-
2020-06-29soldstatus $50,000
-
2001-03-19soldstatus $44,000
ⓘ Source: listings_history table (triggers on properties + properties_extension) + one-shot
backfill from property_details.listing_events for pre-trigger history.
Tax reassessment forecast AR · Resets to sale price
- Current annual tax
- $523 · $44/mo
- Projected year-2 tax
- $1,306 · $109/mo
- Expected delta
- +$782/yr (+$65/mo · 149.4%)
ⓘ Screening estimate from a state-policy table — verify with the county assessor before closing.
Climate risk First Street
- Flood 1/10 Low FEMA zone X (unshaded) · 0% chance over 30 yrs
- Wildfire 3/10 Moderate
- Heat 5/10 Major 7 d/yr ≥105°F today · 21 d/yr by 30 yrs out
- Wind 2/10 Low 2% chance of damaging wind over 30 yrs
- Air quality 2/10 Low 0 unhealthy d/yr today · 1 by 30 yrs out
Nearby sold comps map
Loading sold comps map…
Walkable amenities ~0.75 mi
Loading nearby amenities…
Taxation est. · year 1
- Rental income
- $19,501
- − Mortgage interest
- −$11,427
- − Property taxes
- −$523
- − Insurance
- −$1,020
- − Repairs & maintenance
- −$1,560
- − Management
- −$1,560
- − HOA
- −$1,560
- − Depreciation
- −$5,935
- Taxable loss
- −$4,085
- Est. tax savings @ 24.0%
- +$980
- After-tax cash flow
- $445/yr
For passive investors: Depreciation is non-cash, so a rental often shows a tax loss while cash-flowing — sheltering income. Rental losses are passive: they offset passive income freely, and up to $25,000/yr can offset ordinary (W-2) income if you actively participate and your MAGI is under $100k (phasing out to $0 by $150k); unused losses carry forward. On sale, claimed depreciation is recaptured at up to 25%, and gains may owe capital-gains tax (a 1031 exchange can defer both). Figures are a year-1 estimate at your 24.0% rate — not tax advice; consult a CPA.
Schools (NCES district)
- District
- Bentonville School District
- NCES district ID
- 0503060
- Math proficiency
- 59% ▼ -8.00%
- Reading proficiency
- 59% ▼ -6.00%
- Median HH income
- $66,721
- Composite
- 51.85/100
- National rank
- #1661
- State rank
- #3 of 238 in AR
Livability — Bella Vista
- Score
- 67/100
- State rank
- #111
- US rank
- #11129
Category grades
Schools grade is shown separately in the Schools card above.
Census & demographics
- Census place
- Bella Vista, AR
- County
- Benton County · 259,241 people
- City population
- 31,638
- Metro
- Fayetteville-Springdale-Rogers, AR
- Population (ZIP)
- 17,288
- Household income
- $82,447
- Rent vs Own
- Severe rent burden
- 107.0
Population outlook (Benton County) Hauer SSP2
- Today (2025)
- 318,683 people
- By 2030
- 353,481 · +10.9%
- By 2040
- 425,280 · +33.4%
- By 2050
- 497,239 · +56.0%
- By 2075
- 662,114 · +107.8%
- By 2100
- 776,431 · +143.6%
Race, ethnicity, and origin ACS 2023
- Neighborhood character
- Predominantly White (84%)
- Race & ethnicity
- White 84% Two or more races 12% Hispanic / Latino 6% Asian 1%
- Hispanic origin (detail)
- Mexican 2% Dominican 2%
- Common ancestry
- Lithuanian 4% Slovak 4% Portuguese 2%
- Foreign-born
- 3% · Canada
- Languages at home
- 97% English-only · Spanish 2%
Political lean MEDSL · Benton
- 2024 margin
- Strong R (+27.0) · D 35.2% · R 62.1% · Other 2.7%
- 2008→2024 swing
- +9.6pp toward D · 2008: -36.5pp · 2024: -27.0pp
- All cycles
- 2024: R+27.0 2020: R+26.4 2016: R+34.9 2012: R+40.4 2008: R+36.5
Not yet ingested
- Civics
- —
Market trends
- HPI YoY
- ▼ -21.53%
- Current HPI
- 304.946
- Rent YoY
- —
- Metro
- Fayetteville-Springdale-Rogers, AR
- State GDP YoY
- ▲ 3.80%
- F500 in state
- 10
Industry mix (Fortune 500 HQ in AR)
| Industry | F500 HQs | Revenue |
|---|---|---|
| Retail | 1 | $681B |
|
||
| Food / Agriculture | 1 | $53B |
|
||
| Retail / Energy | 1 | $22B |
|
||
| Transportation / Logistics | 1 | $12B |
|
||
| Energy | 1 | $4B |
|
||
Price history
+370.5% since first listed4 events — show timeline
- 2026-03-30 Price Changed $207,000 NWARMLS
- 2026-03-30 Listed $189,000 NWARMLS
- 2020-06-29 Sold (Public Records) $50,000 Public Records
- 2001-03-19 Sold (Public Records) $44,000 Public Records
Property tax history
-0.4%/yrLatest (2025): $523 · -15.1% YoY. Source: county tax records.
Cash-flow waterfall
monthlySold comps — $/sqft
last 12 mo · ≤1 miLoading sold comps…