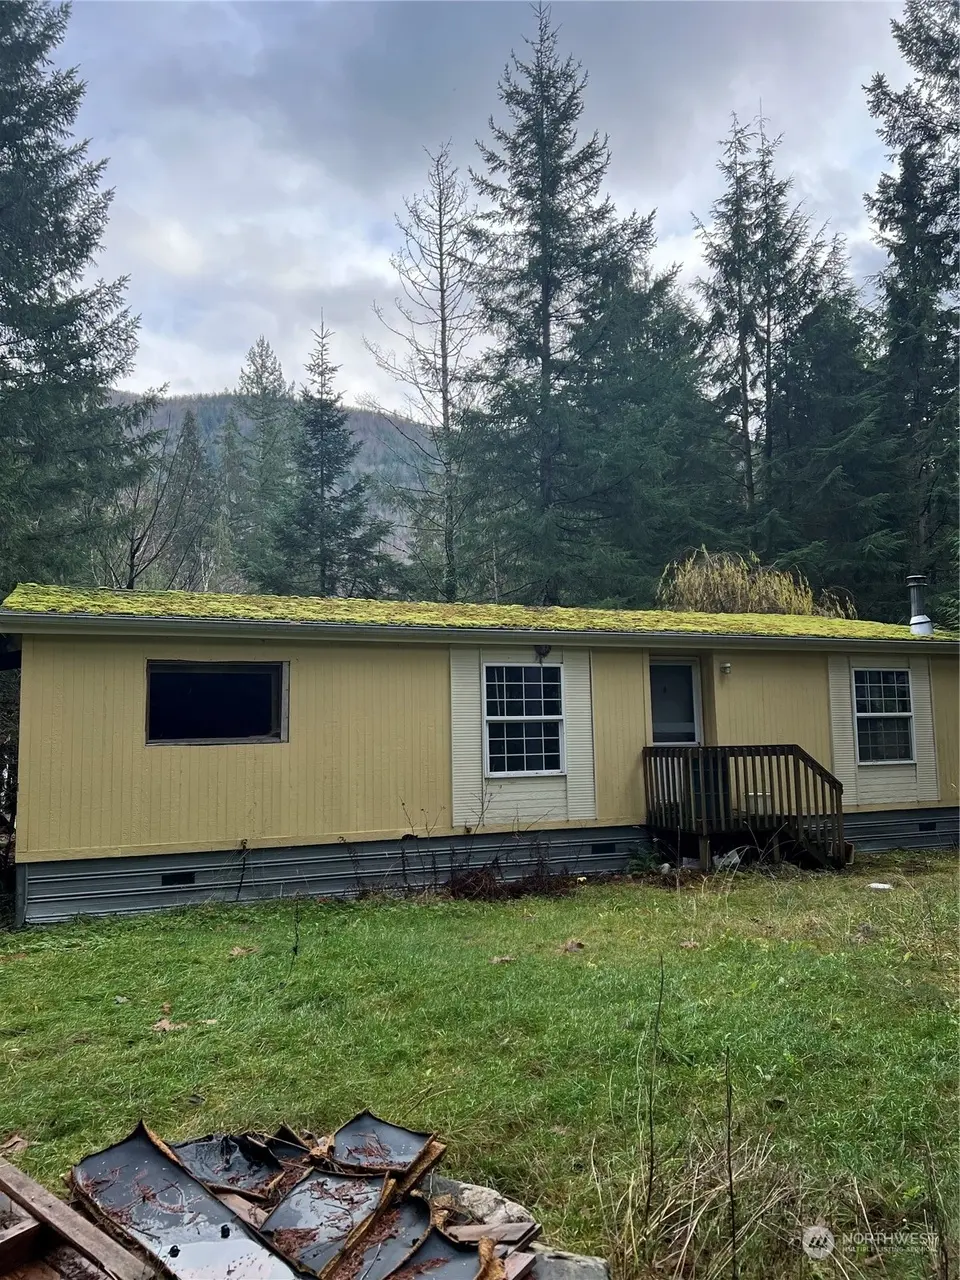
901 Ruby Valley Ct · Peaceful Valley, WA
Flood risk 4/10 · Minor
- FEMA flood zone
- X (unshaded)
- Chance of flooding over 30 yrs
- 0.23%
- Est. flood insurance / yr
- $507 – $1,088
Fire risk 3/10 · Minor
- Est. fire insurance / yr
- $604 – $1,122
Heat risk 2/10 · Minimal
- Hot days now (above 86°F)
- 7 days/yr
- Hot days in 30 yrs
- 17 days/yr
Wind risk 1/10 · Minimal
- Chance of severe wind over 30 yrs
- —
Air-quality risk 7/10 · Major
- Unhealthy air days now
- 13 days/yr
- Unhealthy air days in 30 yrs
- 14 days/yr
Risk factors via First Street. Map © Google.
Why this score? — see what drove the C- grade
The composite is a weighted blend of 9 inputs, each scored 0–100. Each bar is that input's sub-score; the figure is the points it added to the 100-point composite (weight × sub-score).
- Cash flow +18.3/30.0
- ARV discount +11.9/15.0
- DSCR +5.8/10.0
- Schools +4.2/10.0
- 1% rule +3.8/10.0
- Livability +3.0/5.0
- Rent growth +2.5/5.0
- Condition / age +2.5/5.0
- Appreciation +0.0/10.0
$249,000
🖨 Deal sheet 📄 Offer letter ✓ Due diligence
Listing remarks
Fixer upper. 1993 Mobile Home in the Peaceful Valley Area (Maple Falls). Good size lot and yard w/ privacy tucked in the trees. 1296 Sq Ft, Vaulted ceilings, Spacious main bedroom. Great size floor plan. Sits on a concrete slab. Seller is selling as is. Fixer.
Key facts
- Yard w/privacy
- 0.24 acre lot
- Built 1993
Tags
Neighborhood map
What this means for you Summary
Snapshot
- This is a 3-bed/2.0-bath manufactured listed at $249k.
Deal economics
- At list price, monthly cash flow is $230 ($3k/yr) — positive.
- The deal already cash-flows at list — no discount required.
- To meet the 1% rule (rent ≥ 1% of price), the offer needs to be $220k (11.6% below list).
- Recommended offer: $219k (12.0% below list) — sets the bar for market timing.
- Cap rate 7.4% vs local median 4.3% in Peaceful Valley — top-decile yield for the area; either an underpriced asset or a hidden risk that comps aren't pricing in. Stress-test before assuming the spread holds.
Location & tenants
- Location reads 60/100 on livability (#453 in WA) — a middle-class / working-renter tenant base. Strengths: cost of living A, housing A-; Watch: commute C-, health & safety D, schools F.
- Mount Baker School District (rural): math 40% / reading 53% proficiency, ranked #165 of 291 in WA (top 57%) — families likely to look elsewhere, expect single-tenant / working-renter base with shorter leases.
- Market conditions: 61 active listings in the ZIP; 1 comparable units currently listed for rent nearby; 1,190 units permitted in Whatcom County in 2024 (327 in 5+ unit buildings).
Forward outlook
- Local home prices are declining (-3.0%/yr); year-one equity from $2k of loan paydown is wiped out by about $7k of value loss. Plan a longer hold.
- Whatcom County population projected at +28% by 2050 — long-run rental-demand tailwind backs the buy-and-hold thesis.
Negotiation context
- It's been on market 572 days — a 12% lower offer ($219k) is reasonable based on typical stale-listing flexibility.
- 3 sale attempts since 12y ago; this cycle's ask has dropped $50k (17%) from the opening price — seller is motivated, your offer sets the floor, not the list.
- Current owner paid $58k; list at $249k implies a 329% gain — meaningful room to come down on a strong offer.
Questions for the listing agent
- It's been on market 572 days. Have you received any prior offers? Is the seller open to a 12% concession, seller financing, or rate buy-down credit?
- What does the HOA fee cover, when was the last increase, and are there any pending special assessments or reserve-fund shortfalls?
- Why hasn't it sold? Are there any deal-killer items the seller is aware of (foundation, flood, title, zoning, code violations)?
- Is there a deadline driving the sale (1031 exchange, divorce, estate, relocation)? That informs how much negotiation room exists.
- Schools are F-rated, which usually means shorter tenancies and higher turnover. Who's the typical renter profile here, and what's been the actual vacancy rate?
- What's the average days-on-market for RENTAL listings here right now (not sales)? A rising rental-DOM trend means longer vacancies and softer asking-rent achievability than the comps imply.
- What's the recent tenant-quality profile in this submarket — average credit score on applications, eviction rate, late-payment / NSF rate, and stable-employment percentage? A property-management company in the area should have these aggregated.
- How much new for-sale + rental construction is in the pipeline within 1–3 miles? Heavy new supply typically softens prices + rents 12–24 months out; constrained supply supports both.
Investment metrics
- 1% rule
- 0.88% ✗
- Cap rate
- 7.40%
- Cash-on-cash
- 3.96%
- DSCR
- 1.18
- GRM
- 9.4
CMA / ARV
- ARV (median comp)
- $276,120
- List price
- $249,000
- Delta
- -9.82%
- Verdict
- FAIR
- Comps
- 13 within 1.0 mi
Show comp detail 12 sales within ~0.75 mi
| Address | Dist | Beds/Ba | Sqft | Sold | Price | $/sf | Match |
|---|---|---|---|---|---|---|---|
| 881 Ruby Valley Ct | 0.03mi | 3/2.0 | 1,279 (-1%) | 15mo | $350,000 | $274 | 84 |
| 971 Deep Valley Dr | 0.08mi | 3/2.0 | 1,344 (+4%) | 19mo | $300,000 | $223 | 74 |
| 6164 Cedar Ln | 0.62mi | 3/2.0 | 1,296 (0%) | 0mo | $322,000 | $248 | 71 |
| 1201 Hopeful Valley Ln | 0.14mi | 3/2.0 | 1,215 (-6%) | 16mo | $289,000 | $238 | 70 |
| 8365 Holly Ln | 0.43mi | 3/2.0 | 1,293 (-0%) | 12mo | $350,000 | $271 | 69 |
| 2071 Clear Valley Dr | 0.25mi | 3/2.0 | 1,152 (-11%) | 0mo | $249,900 | $217 | 69 |
| 8333 Beaver Ct | 0.40mi | 3/2.0 | 1,320 (+2%) | 13mo | $310,000 | $235 | 68 |
| 8388 Holly Ln | 0.44mi | 2/2.0 (-1) | 1,296 (0%) | 17mo | $281,500 | $217 | 60 |
| 8461 Cimarron Way | 0.67mi | 2/2.0 (-1) | 1,296 (0%) | 4mo | $240,700 | $186 | 60 |
| 6257 Azure Way | 0.47mi | 3/2.0 | 1,174 (-9%) | 4mo | $340,000 | $290 | 59 |
| 8515 Golden Valley Dr | 0.70mi | 3/2.0 | 1,344 (+4%) | 8mo | $275,000 | $205 | 54 |
| 8283 Golden Valley Blvd | 0.49mi | 3/2.0 | 1,176 (-9%) | 9mo | $189,000 | $161 | 54 |
Match score weights: distance 35% · size 25% · config 20% · recency 20%. Top-matched comps best support the ARV.
Projected returns pro-forma
-3.0% appreciation · 3.0% rent growth · sell at horizon
- IRR
- -10.1%
- Equity multiple
- 0.63×
- Total profit
- $-25,802
- Equity at exit
- $37,127
- IRR
- -0.8%
- Equity multiple
- 0.94×
- Total profit
- $-4,008
- Equity at exit
- $21,529
Cash invested: $69,720 (down + closing). Projections, not guarantees.
Landlord ↔ Tenant lean methodology
- Overall (STATE)
- 28 Tenant-Leaning
- State Washington
- 28 Tenant-Leaning · D+8
- County
- — inherits STATE
- City
- — inherits STATE
ZIP-level market 98266
- Home prices YoY
- -14.9%
- Active inventory
- 61
- Price-to-rent
- 9.4×
Monthly cashflow live
- Estimated rent
- $2,200 medium interval (Pro) →
- Mortgage (P&I)
- −$1,306
- Tax from tax record
- −$78 /mo · $931/yr
- Insurance
- −$104
- HOA
- −$21
- Vacancy / Maint / Mgmt
- −$462
- Net cashflow
- $230
Break-even live
UW: 25.0% down · 7.5% · 30yr · 1.5% tax · 5.0% vac · 8.0% maint · 8.0% mgmt
Financing live
Cash to close
- Down payment
- $62,250
- Closing costs
- $7,470
- Reserves months
- —
- Total cash needed
- —
Loan-product check · same deal, 3 products live
Conventional
25% down · 7.5% · 30yr
- Down + closing
- —
- Monthly P&I
- —
- Monthly cashflow
- —
- DSCR
- —
- Eligible?
- —
Personal DTI + credit; lowest rate.
DSCR
20% down · 8.5% · 30yr
- Down + closing
- —
- Monthly P&I
- —
- Monthly cashflow
- —
- DSCR
- —
- Eligible?
- —
No personal income docs; deal must DSCR.
Hard money
10% down · 12.0% · 12mo
- Down + closing
- —
- Monthly P&I
- —
- Monthly cashflow
- —
- DSCR
- —
- Eligible?
- —
Short-term bridge; refi at stabilization.
Rent comps 1 comps
| Address | Beds | Baths | Sqft | Rent | $/sqft | DOM | Units | Dist |
|---|---|---|---|---|---|---|---|---|
| 8118 Pony Express Way Maple Falls, WA | 2.0 | 2.0 | 1321 | $2,200 | $1.67 | 13d | 1 | 0.44mi |
HOA detail
- Monthly dues
- $21 · $252/yr
Listing history 27 events
-
2026-06-18days on market $249,000 Active 572 DOM
-
2026-06-17days on market $249,000 Active 571 DOM
-
2026-06-16days on market $249,000 Active 570 DOM
-
2026-06-15days on market $249,000 Active 569 DOM
-
2026-06-14days on market $249,000 Active 567 DOM
-
2026-06-13days on market $249,000 Active 566 DOM
-
2026-06-10days on market $249,000 Active 564 DOM
-
2026-06-09days on market $249,000 Active 563 DOM
-
2026-06-08days on market $249,000 Active 562 DOM
-
2026-06-07days on market $249,000 Active 561 DOM
-
2026-06-05days on market $249,000 Active 558 DOM
-
2026-06-02days on market $249,000 Active 556 DOM
-
2026-06-01days on market $249,000 Active 555 DOM
-
2026-05-31days on market $249,000 Active 554 DOM
-
2026-05-30days on market $249,000 Active 553 DOM
-
2025-11-26status Active
-
2025-11-26historical
-
2025-10-17price $249,000
-
2025-09-06price $270,000
-
2024-11-23$299,000 Active
-
2014-08-29soldstatus $58,000 Sold
-
2014-08-29soldstatus $58,000
-
2014-08-22status Pending
-
2014-08-14status Pending Inspection
-
2014-06-06$68,500 Active
-
1993-08-19soldstatus $42,878
-
1992-09-28soldstatus $11,500
ⓘ Source: listings_history table (triggers on properties + properties_extension) + one-shot
backfill from property_details.listing_events for pre-trigger history.
Tax reassessment forecast WA · Resets to sale price
- Current annual tax
- $931 · $78/mo
- Projected year-2 tax
- $2,440 · $203/mo
- Expected delta
- +$1,510/yr (+$126/mo · 162.2%)
ⓘ Screening estimate from a state-policy table — verify with the county assessor before closing.
Climate risk First Street
- Flood 4/10 Moderate FEMA zone X (unshaded) · 23% chance over 30 yrs
- Wildfire 3/10 Moderate
- Heat 2/10 Low 7 d/yr ≥86°F today · 17 d/yr by 30 yrs out
- Wind 1/10 Low
- Air quality 7/10 Severe 13 unhealthy d/yr today · 14 by 30 yrs out
Nearby sold comps map
Loading sold comps map…
Walkable amenities ~0.75 mi
Loading nearby amenities…
Taxation est. · year 1
- Rental income
- $26,400
- − Mortgage interest
- −$13,948
- − Property taxes
- −$931
- − Insurance
- −$1,245
- − Repairs & maintenance
- −$2,112
- − Management
- −$2,112
- − HOA
- −$252
- − Depreciation
- −$7,244
- Taxable loss
- −$1,443
- Est. tax savings @ 24.0%
- +$346
- After-tax cash flow
- $3,105/yr
For passive investors: Depreciation is non-cash, so a rental often shows a tax loss while cash-flowing — sheltering income. Rental losses are passive: they offset passive income freely, and up to $25,000/yr can offset ordinary (W-2) income if you actively participate and your MAGI is under $100k (phasing out to $0 by $150k); unused losses carry forward. On sale, claimed depreciation is recaptured at up to 25%, and gains may owe capital-gains tax (a 1031 exchange can defer both). Figures are a year-1 estimate at your 24.0% rate — not tax advice; consult a CPA.
Schools (NCES district)
- District
- Mount Baker School District
- NCES district ID
- 5305310
- Math proficiency
- 40% ▲ 3.00%
- Reading proficiency
- 53% ▼ -1.00%
- Median HH income
- $53,695
- Composite
- 42.37/100
- National rank
- #6931
- State rank
- #165 of 291 in WA
Livability — Peaceful Valley
- Score
- 60/100
- State rank
- #453
- US rank
- #18635
Category grades
Schools grade is shown separately in the Schools card above.
Census & demographics
- Census place
- Peaceful Valley, WA
- Population (ZIP)
- 4,198
Population outlook (Whatcom County) Hauer SSP2
- Today (2025)
- 240,408 people
- By 2030
- 254,667 · +5.9%
- By 2040
- 281,365 · +17.0%
- By 2050
- 307,592 · +27.9%
- By 2075
- 375,576 · +56.2%
- By 2100
- 421,637 · +75.4%
Race, ethnicity, and origin ACS 2023
- Neighborhood character
- Predominantly White (83%)
- Race & ethnicity
- White 83% Hispanic / Latino 7% Two or more races 6% Asian 3% Native American 2%
- Hispanic origin (detail)
- Mexican 5%
- Common ancestry
- Slovak 5% Iranian 4% Subsaharan African 3%
- Foreign-born
- 9% · Canada, Philippines, Vietnam
- Languages at home
- 93% English-only · Russian/Polish/Slavic 3% Other Indo-European 2% Vietnamese 2%
Political lean MEDSL · Whatcom
- 2024 margin
- Strong D (+24.9) · D 60.8% · R 35.9% · Other 3.3%
- 2008→2024 swing
- +6.9pp toward D · 2008: 18.0pp · 2024: 24.9pp
- All cycles
- 2024: D+24.9 2020: D+23.9 2016: D+17.7 2012: D+12.1 2008: D+18.0
Not yet ingested
- Civics
- —
Market trends
- HPI YoY
- ▼ -57.36%
- Current HPI
- 327.9087
- Rent YoY
- —
- Metro
- —
- State GDP YoY
- ▲ 4.65%
- F500 in state
- 22
Industry mix (Fortune 500 HQ in WA)
| Industry | F500 HQs | Revenue |
|---|---|---|
| Retail | 2 | $269B |
|
||
| Technology / Retail | 1 | $638B |
|
||
| Technology | 1 | $245B |
|
||
| Telecommunications | 1 | $38B |
|
||
| Food / Beverage | 1 | $36B |
|
||
| Automotive / Trucks | 1 | $34B |
|
||
Price history
+2065.2% since first listed12 events — show timeline
- 2025-11-26 Relisted — NWMLS as Distributed by MLS Grid
- 2025-11-26 Delisted — NWMLS as Distributed by MLS Grid
- 2025-10-17 Price Changed $249,000 NWMLS as Distributed by MLS Grid
- 2025-09-06 Price Changed $270,000 NWMLS as Distributed by MLS Grid
- 2024-11-23 Listed $299,000 NWMLS as Distributed by MLS Grid
- 2014-08-29 Sold (Public Records) $58,000 Public Records
- 2014-08-29 Sold (MLS) $58,000 NWMLS as Distributed by MLS Grid
- 2014-08-22 Pending — NWMLS as Distributed by MLS Grid
- 2014-08-14 Pending — NWMLS as Distributed by MLS Grid
- 2014-06-06 Listed $68,500 NWMLS as Distributed by MLS Grid
- 1993-08-19 Sold (Public Records) $42,878 Public Records
- 1992-09-28 Sold (Public Records) $11,500 Public Records
Property tax history
+0.4%/yrLatest (2026): $931 · +6.4% YoY. Source: county tax records.
Cash-flow waterfall
monthlySold comps — $/sqft
last 12 mo · ≤1 miLoading sold comps…