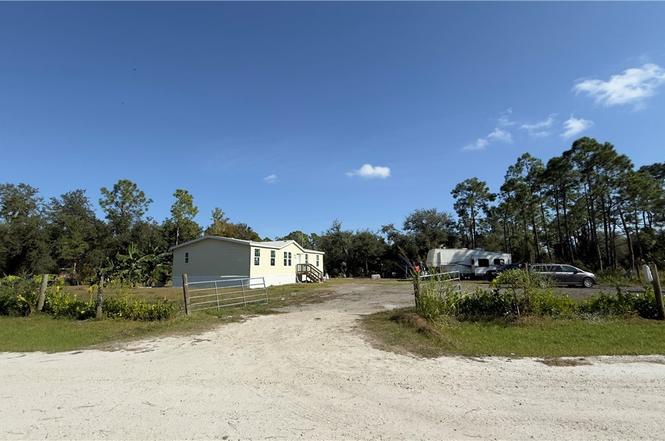
28119 Crescent Lake Dr · Punta Gorda, FL
Flood risk 1/10 · Minimal
- FEMA flood zone
- D
- Chance of flooding over 30 yrs
- 0.0%
- Est. flood insurance / yr
- $544 – $1,084
Fire risk 4/10 · Minor
- Est. fire insurance / yr
- $947 – $1,759
Heat risk 10/10 · Severe
- Hot days now (above 108°F)
- 7 days/yr
- Hot days in 30 yrs
- 28 days/yr
Wind risk 10/10 · Severe
- Chance of severe wind over 30 yrs
- 99.0%
Air-quality risk 2/10 · Minimal
- Unhealthy air days now
- 1 days/yr
- Unhealthy air days in 30 yrs
- 2 days/yr
Risk factors via First Street. Map © Google.
Why this score? — see what drove the D- grade
The composite is a weighted blend of 9 inputs, each scored 0–100. Each bar is that input's sub-score; the figure is the points it added to the 100-point composite (weight × sub-score).
- Cash flow +10.4/30.0
- ARV discount +7.5/15.0
- Schools +4.6/10.0
- Livability +3.8/5.0
- DSCR +3.0/10.0
- 1% rule +2.9/10.0
- Rent growth +2.5/5.0
- Condition / age +2.5/5.0
- Appreciation +0.0/10.0
$259,999
🖨 Deal sheet (PDF) 📄 Offer letter ✓ Due diligence
Listing remarks MLS
WATERFRONT! 3 LOTS BEING SOLD TOGETHER (LOTS 3,4,5)! NESTLED BETWEEN DOWNTOWN PUNTA GORDA AND CAPE CORAL, YOU WILL FIND TROPICAL GULF ACRES. THE AREA OFFERS OLD FLORIDA COUNTRY LIKE CHARM. BUILD YOUR HOME AND ENJOY THE VIEW OF THE LAKE/POND OR JUST RELAX AND FISH FROM YOUR BACKYARD. IN MINUTES YOU WILL BE NEAR US 41 AND I-75 PROVIDING YOU WITH EASY ACCESS TO THE GULF OF MEXICO, PUBLIC BOAT RAMPS, GOLFING, PARKS, AIRPORTS, RESTARUANTS AND SO MUCH MORE. IF YOU ARE LOOKING TO BUILD YOUR DREAM HOME WITH NO HOA FEES LOOK NO FURTHER. TROPICAL GULF ACRES HAS A BEAUTIFUL PARK WITH PUBLIC RESTROOMS AND ACTIVITIES FOR THE ENTIRE FAMILY TO ENJOY.
Key facts
- Modular home
- Natural tree buffer
- Gated entry
Tags
Neighborhood map
What this means for you Summary
Snapshot
- This is a 3-bed/2.0-bath land listed at $260k.
Deal economics
- At list price, monthly cash flow is $-137 ($-2k/yr) — negative.
- To cash-flow at today's rent, offer at most $236k (9.3% below list).
- To meet the 1% rule (rent ≥ 1% of price), the offer needs to be $205k (21.1% below list).
- Recommended offer: $205k (21.1% below list) — sets the bar for 1% rule.
- Cap rate 5.7% vs local median 2.8% in Punta Gorda — top-decile yield for the area; either an underpriced asset or a hidden risk that comps aren't pricing in. Stress-test before assuming the spread holds.
Location & tenants
- Location reads 76/100 on livability (#225 in FL, #3,567 nationally) — a middle-class / working-renter tenant base. Strengths: schools A+, crime A+, health & safety A+; Watch: cost of living D+, amenities D-, commute F.
- Charlotte (suburban): math 54% / reading 54% proficiency, ranked #22 of 73 in FL (top 30%) — acceptable for families but not a draw, mixed tenant base, ~2y average lease.
- Market conditions: 1481 active listings in the ZIP; 3 comparable units currently listed for rent nearby; rentals at typical pace (median 22d on market — plan ~3-4 weeks tenant-placement turnaround); solid renter incomes; 4,585 units permitted in Charlotte County in 2024 (703 in 5+ unit buildings).
- This rent runs 32% of the median local income ($77k/yr) — at the standard rent-burdened threshold; future hikes will face affordability resistance.
Forward outlook
- Local home prices are declining (-3.0%/yr); year-one equity from $2k of loan paydown is wiped out by about $8k of value loss. Plan a longer hold.
- Charlotte County population projected at +24% by 2050 — long-run rental-demand tailwind backs the buy-and-hold thesis.
Negotiation context
- It's been on market 123 days — a 12% lower offer ($229k) is reasonable based on typical stale-listing flexibility.
- 4 sale attempts since 10y ago with the ask held roughly flat each time — persistent listings suggest the price (not the market) is what's stuck; bring a comps-based counter.
- Current owner paid $21k; list at $260k implies a 1138% gain — meaningful room to come down on a strong offer.
Risks & watch-outs
- Climate carrying-cost: severe wind risk, 99% chance of damaging wind over 30y; extreme-heat days projected 7→28/yr by 2055 (HVAC capex compounding) — expect insurance premiums to compound above CPI over the hold.
Questions for the listing agent
- What do current leases actually rent for vs. the listed asking? Can we see a recent rent roll and the last 12 months of T-12 income?
- It's been on market 123 days. Have you received any prior offers? Is the seller open to a 21% concession, seller financing, or rate buy-down credit?
- Why hasn't it sold? Are there any deal-killer items the seller is aware of (foundation, flood, title, zoning, code violations)?
- Is there a deadline driving the sale (1031 exchange, divorce, estate, relocation)? That informs how much negotiation room exists.
- Schools are A-rated — typically a magnet for longer-tenancy family renters. What's the average tenant stay here, and is there a school-zone premium baked into asking?
- The area grade is low — what's the realistic commute time and amenity access for the typical tenant pool here? Any planned neighborhood developments (good or bad) we should know about?
- What's the average days-on-market for RENTAL listings here right now (not sales)? A rising rental-DOM trend means longer vacancies and softer asking-rent achievability than the comps imply.
- What's the recent tenant-quality profile in this submarket — average credit score on applications, eviction rate, late-payment / NSF rate, and stable-employment percentage? A property-management company in the area should have these aggregated.
- How much new for-sale + rental construction is in the pipeline within 1–3 miles? Heavy new supply typically softens prices + rents 12–24 months out; constrained supply supports both.
Investment metrics
- 1% rule
- 0.79% ✗
- Cap rate
- 5.66%
- Cash-on-cash
- -2.26%
- DSCR
- 0.90
- GRM
- 10.6
CMA / ARV
No comps found within radius.
Projected returns pro-forma
-3.0% appreciation · 3.0% rent growth · sell at horizon
- IRR
- -20.1%
- Equity multiple
- 0.30×
- Total profit
- $-50,871
- Equity at exit
- $38,767
- IRR
- -13.0%
- Equity multiple
- 0.24×
- Total profit
- $-55,532
- Equity at exit
- $22,480
Cash invested: $72,800 (down + closing). Projections, not guarantees.
Landlord ↔ Tenant lean methodology
- Overall (STATE)
- 87 Strongly Landlord-Friendly
- State Florida
- 87 Strongly Landlord-Friendly · R+3
- County
- — inherits STATE
- City
- — inherits STATE
ZIP-level market 33955
- Home prices YoY
- -24.5%
- Active inventory
- 1481
- Price-to-rent
- 10.6×
Monthly cashflow live
- Estimated rent
- $2,051 medium interval (Pro) →
- Mortgage (P&I)
- −$1,363
- Tax from tax record
- −$286 /mo · $3,435/yr
- Insurance
- −$108
- HOA
- −$0
- Vacancy / Maint / Mgmt
- −$431
- Net cashflow
- $-137
Break-even live
Sensitivity live
| Price | -10% $10 | -5% $-64 | +0% $-137 | +5% $-211 | +10% $-285 |
|---|---|---|---|---|---|
| Rent | -10% $-299 | -5% $-218 | +0% $-137 | +5% $-56 | +10% $25 |
| Rate | -1.0pp $-6 | -0.5pp $-71 | base $-137 | +0.5pp $-205 | +1.0pp $-273 |
UW: 25.0% down · 7.5% · 30yr · 1.5% tax · 5.0% vac · 8.0% maint · 8.0% mgmt
Financing live
Cash to close
- Down payment
- $65,000
- Closing costs
- $7,800
- Reserves months
- —
- Total cash needed
- —
Loan-product check · same deal, 3 products live
Conventional
25% down · 7.5% · 30yr
- Down + closing
- —
- Monthly P&I
- —
- Monthly cashflow
- —
- DSCR
- —
- Eligible?
- —
Personal DTI + credit; lowest rate.
DSCR
20% down · 8.5% · 30yr
- Down + closing
- —
- Monthly P&I
- —
- Monthly cashflow
- —
- DSCR
- —
- Eligible?
- —
No personal income docs; deal must DSCR.
Hard money
10% down · 12.0% · 12mo
- Down + closing
- —
- Monthly P&I
- —
- Monthly cashflow
- —
- DSCR
- —
- Eligible?
- —
Short-term bridge; refi at stabilization.
Rent comps 3 comps
| Address | Beds | Baths | Sqft | Rent | $/sqft | DOM | Units | Dist |
|---|---|---|---|---|---|---|---|---|
| 13263 Valrico Ter Punta Gorda, FL | 3.0 | 2.0 | 1628 | $1,500 | $0.92 | 21d | 1 | 0.15mi |
| 12378 Paramount Dr Punta Gorda, FL | 4.0 | 3.0 | 1836 | $2,295 | $1.25 | 21d | 1 | 1.23mi |
| 13239 Turnleaf Blvd Punta Gorda, FL | 4.0 | 2.5 | 1874 | $2,300 | $1.23 | 14d | 1 | 1.35mi |
Listing history 11 events
-
2026-04-11status Pending
-
2025-12-09$259,999 Active
-
2020-02-18soldstatus $21,000
-
2020-02-06soldstatus $21,000 Sold 644-char remark
Show marketing remark (644 chars)
WATERFRONT! 3 LOTS BEING SOLD TOGETHER (LOTS 3,4,5)! NESTLED BETWEEN DOWNTOWN PUNTA GORDA AND CAPE CORAL, YOU WILL FIND TROPICAL GULF ACRES. THE AREA OFFERS OLD FLORIDA COUNTRY LIKE CHARM. BUILD YOUR HOME AND ENJOY THE VIEW OF THE LAKE/POND OR JUST RELAX AND FISH FROM YOUR BACKYARD. IN MINUTES YOU WILL BE NEAR US 41 AND I-75 PROVIDING YOU WITH EASY ACCESS TO THE GULF OF MEXICO, PUBLIC BOAT RAMPS, GOLFING, PARKS, AIRPORTS, RESTARUANTS AND SO MUCH MORE. IF YOU ARE LOOKING TO BUILD YOUR DREAM HOME WITH NO HOA FEES LOOK NO FURTHER. TROPICAL GULF ACRES HAS A BEAUTIFUL PARK WITH PUBLIC RESTROOMS AND ACTIVITIES FOR THE ENTIRE FAMILY TO ENJOY.
-
2020-01-16status Pending 644-char remark
Show marketing remark (644 chars)
WATERFRONT! 3 LOTS BEING SOLD TOGETHER (LOTS 3,4,5)! NESTLED BETWEEN DOWNTOWN PUNTA GORDA AND CAPE CORAL, YOU WILL FIND TROPICAL GULF ACRES. THE AREA OFFERS OLD FLORIDA COUNTRY LIKE CHARM. BUILD YOUR HOME AND ENJOY THE VIEW OF THE LAKE/POND OR JUST RELAX AND FISH FROM YOUR BACKYARD. IN MINUTES YOU WILL BE NEAR US 41 AND I-75 PROVIDING YOU WITH EASY ACCESS TO THE GULF OF MEXICO, PUBLIC BOAT RAMPS, GOLFING, PARKS, AIRPORTS, RESTARUANTS AND SO MUCH MORE. IF YOU ARE LOOKING TO BUILD YOUR DREAM HOME WITH NO HOA FEES LOOK NO FURTHER. TROPICAL GULF ACRES HAS A BEAUTIFUL PARK WITH PUBLIC RESTROOMS AND ACTIVITIES FOR THE ENTIRE FAMILY TO ENJOY.
-
2019-06-25$24,000 Active 644-char remark
Show marketing remark (644 chars)
WATERFRONT! 3 LOTS BEING SOLD TOGETHER (LOTS 3,4,5)! NESTLED BETWEEN DOWNTOWN PUNTA GORDA AND CAPE CORAL, YOU WILL FIND TROPICAL GULF ACRES. THE AREA OFFERS OLD FLORIDA COUNTRY LIKE CHARM. BUILD YOUR HOME AND ENJOY THE VIEW OF THE LAKE/POND OR JUST RELAX AND FISH FROM YOUR BACKYARD. IN MINUTES YOU WILL BE NEAR US 41 AND I-75 PROVIDING YOU WITH EASY ACCESS TO THE GULF OF MEXICO, PUBLIC BOAT RAMPS, GOLFING, PARKS, AIRPORTS, RESTARUANTS AND SO MUCH MORE. IF YOU ARE LOOKING TO BUILD YOUR DREAM HOME WITH NO HOA FEES LOOK NO FURTHER. TROPICAL GULF ACRES HAS A BEAUTIFUL PARK WITH PUBLIC RESTROOMS AND ACTIVITIES FOR THE ENTIRE FAMILY TO ENJOY.
-
2019-04-01historical
-
2018-09-24$18,900 Active
-
2017-03-07historical
-
2016-10-20$39,000 Active
-
2006-01-06soldstatus $11,500
ⓘ Source: listings_history table (triggers on properties + properties_extension) + one-shot
backfill from property_details.listing_events for pre-trigger history.
Tax reassessment forecast FL · Resets to sale price
- Current annual tax
- $3,435 · $286/mo
- Projected year-2 tax
- $3,435 · $286/mo
- Expected delta
- $0/yr ($0/mo · 0.0%)
ⓘ Screening estimate from a state-policy table — verify with the county assessor before closing.
Climate risk First Street
- Flood 1/10 Low FEMA zone D · 0% chance over 30 yrs
- Wildfire 4/10 Moderate
- Heat 10/10 Extreme 7 d/yr ≥108°F today · 28 d/yr by 30 yrs out
- Wind 10/10 Extreme 99% chance of damaging wind over 30 yrs
- Air quality 2/10 Low 1 unhealthy d/yr today · 2 by 30 yrs out
Nearby sold comps map
Loading sold comps map…
Walkable amenities ~0.75 mi
Loading nearby amenities…
Taxation est. · year 1
- Rental income
- $24,618
- − Mortgage interest
- −$14,564
- − Property taxes
- −$3,435
- − Insurance
- −$1,300
- − Repairs & maintenance
- −$1,969
- − Management
- −$1,969
- − Depreciation
- −$7,564
- Taxable loss
- −$6,183
- Est. tax savings @ 24.0%
- +$1,484
- After-tax cash flow
- $-164/yr
For passive investors: Depreciation is non-cash, so a rental often shows a tax loss while cash-flowing — sheltering income. Rental losses are passive: they offset passive income freely, and up to $25,000/yr can offset ordinary (W-2) income if you actively participate and your MAGI is under $100k (phasing out to $0 by $150k); unused losses carry forward. On sale, claimed depreciation is recaptured at up to 25%, and gains may owe capital-gains tax (a 1031 exchange can defer both). Figures are a year-1 estimate at your 24.0% rate — not tax advice; consult a CPA.
Schools (NCES district)
- District
- Charlotte
- NCES district ID
- 1200240
- Math proficiency
- 54% ▼ -6.00%
- Reading proficiency
- 54% ▼ -1.00%
- Median HH income
- $44,864
- Composite
- 45.62/100
- National rank
- #2586
- State rank
- #22 of 73 in FL
Livability — Punta Gorda
- Score
- 76/100
- State rank
- #225
- US rank
- #3567
Category grades
Schools grade is shown separately in the Schools card above.
Census & demographics
- County
- Charlotte County · 196,994 people
- City population
- 68,831
- Metro
- Punta Gorda, FL
- Population (ZIP)
- 12,399
- Household income
- $76,943
- Rent vs Own
- Severe rent burden
- 226.0
Population outlook (Charlotte County) Hauer SSP2
- Today (2025)
- 198,646 people
- By 2030
- 210,507 · +6.0%
- By 2040
- 230,857 · +16.2%
- By 2050
- 247,148 · +24.4%
- By 2075
- 281,777 · +41.8%
- By 2100
- 293,609 · +47.8%
Race, ethnicity, and origin ACS 2023
- Neighborhood character
- Predominantly White (84%)
- Race & ethnicity
- White 84% Hispanic / Latino 10% Two or more races 9% Black 2%
- Hispanic origin (detail)
- Mexican 4% Puerto Rican 2% Cuban 4%
- Common ancestry
- Romanian 5% Italian 3% Serbian 3%
- Foreign-born
- 8% · Canada
- Languages at home
- 91% English-only · Spanish 5% Other Indo-European 1%
Political lean MEDSL · Charlotte
- 2024 margin
- Solid R (+34.0) · D 32.7% · R 66.7%
- 2008→2024 swing
- -26.7pp toward R · 2008: -7.2pp · 2024: -34.0pp
- All cycles
- 2024: R+34.0 2020: R+26.6 2016: R+27.8 2012: R+14.3 2008: R+7.2
Not yet ingested
- Civics
- —
Market trends
- HPI YoY
- ▼ -78.71%
- Current HPI
- 242.9043
- Rent YoY
- —
- Metro
- Punta Gorda, FL
- State GDP YoY
- ▲ 3.28%
- F500 in state
- 36
Industry mix (Fortune 500 HQ in FL)
| Industry | F500 HQs | Revenue |
|---|---|---|
| Industrial Technology | 2 | $29B |
|
||
| Insurance | 2 | $17B |
|
||
| Retail | 1 | $60B |
|
||
| Technology Distribution | 1 | $58B |
|
||
| Homebuilding | 1 | $35B |
|
||
| Technology Manufacturing | 1 | $35B |
|
||
Price history
+2160.9% since first listed11 events — show timeline
- 2026-04-11 Pending — FORTMLS
- 2025-12-09 Listed $259,999 FORTMLS
- 2020-02-18 Sold (Public Records) $21,000 Public Records
- 2020-02-06 Sold (MLS) $21,000 Stellar MLS as Distributed by MLS Grid
- 2020-01-16 Pending — Stellar MLS as Distributed by MLS Grid
- 2019-06-25 Listed $24,000 Stellar MLS as Distributed by MLS Grid
- 2019-04-01 Listing Removed — Stellar MLS as Distributed by MLS Grid
- 2018-09-24 Listed $18,900 Stellar MLS as Distributed by MLS Grid
- 2017-03-07 Listing Removed — FORTMLS
- 2016-10-20 Listed $39,000 FORTMLS
- 2006-01-06 Sold (Public Records) $11,500 Public Records
Property tax history
+29.2%/yrLatest (2025): $3,435 · +291.0% YoY. Source: county tax records.
Cash-flow waterfall
monthlySold comps — $/sqft
last 12 mo · ≤1 miLoading sold comps…