 🏗️ New Construction
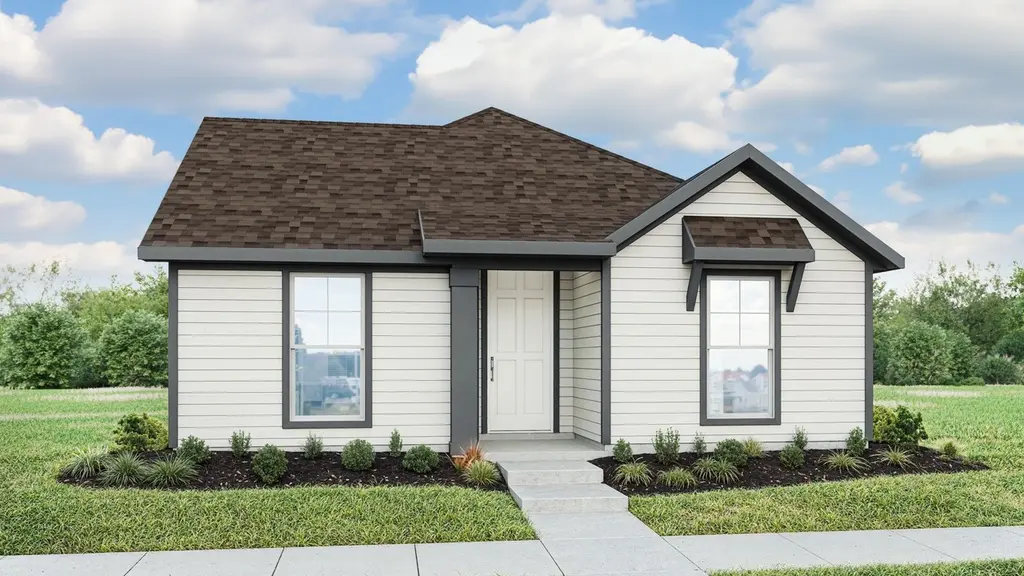
Carroll III Plan · Elgin, TX
Flood risk No data
- FEMA flood zone
- —
- Chance of flooding over 30 yrs
- —
- Est. flood insurance / yr
- —
Fire risk No data
- Est. fire insurance / yr
- —
Heat risk No data
- Hot days now (above threshold)
- —
- Hot days in 30 yrs
- —
Wind risk No data
- Chance of severe wind over 30 yrs
- —
Air-quality risk No data
- Unhealthy air days now
- —
- Unhealthy air days in 30 yrs
- —
Risk factors via First Street. Map © Google.
Why this score? — see what drove the D grade
The composite is a weighted blend of 9 inputs, each scored 0–100. Each bar is that input's sub-score; the figure is the points it added to the 100-point composite (weight × sub-score).
- Appreciation +10.0/10.0
- Cash flow +8.0/30.0
- ARV discount +7.5/15.0
- Condition / age +4.8/5.0
- Livability +3.7/5.0
- Rent growth +3.3/5.0
- 1% rule +2.7/10.0
- DSCR +2.1/10.0
- Schools +2.0/10.0
$259,990
🖨 Deal sheet (PDF) 📄 Offer letter ✓ Due diligence
Listing remarks MLS
The Carroll III floorplan is where modern design meets everyday comfort. This thoughtful layout features 3 bedrooms and 2 bathrooms, perfectly balancing private retreats with open living spaces. The alley-load garage entry enhances curb appeal, giving the front of your home a clean, welcoming look. Inside, a designated tech space provides the ideal spot for working from home, studying, or staying connected. With its smart design and timeless style, the Carroll III offers the perfect setting to create lasting memories.
Key facts
- 2 garage spots
- Listed 119 days
Tags
Neighborhood map
What this means for you Summary
Snapshot
- This is a 3-bed/2.0-bath single-family listed at $260k. Condition is rated excellent.
Deal economics
- At list price, monthly cash flow is $-287 ($-3k/yr) — negative.
- To cash-flow at today's rent, offer at most $243k (6.5% below list).
- To meet the 1% rule (rent ≥ 1% of price), the offer needs to be $218k (16.2% below list).
- Recommended offer: $218k (16.2% below list) — sets the bar for 1% rule.
Location & tenants
- Location reads 74/100 on livability (#167 in TX, #4,404 nationally) — a middle-class / working-renter tenant base. Strengths: cost of living A+, housing A+, health & safety A+; Watch: amenities F, commute F.
- Elgin ISD (rural): math 17% / reading 26% proficiency, ranked #741 of 826 in TX (top 90%) — low school quality limits family demand, transient renter base, plan for 1-2y turnover; 67% free/reduced lunch — lower-income household profile, screen leases tightly.
- Zoned schools: Neidig El (math 32% / reading 32%, grade F, #2,268 of 4,322 statewide, top 55%, 599 students, 79% FRL); Elgin Middle (math 22% / reading 24%, grade F, #1,327 of 1,662 statewide, top 81%, 780 students, 82% FRL); Elgin H S (math 12% / reading 37%, grade F, #1,264 of 1,632 statewide, top 82%, 1,672 students, 74% FRL).
- Market conditions: Rents rising (+3.1%/yr); 820 active listings in the ZIP; 26 comparable units currently listed for rent nearby; rentals at typical pace (median 20d on market — plan ~3-4 weeks tenant-placement turnaround); solid renter incomes; 17,121 units permitted in Travis County in 2024 (11,963 in 5+ unit buildings).
Forward outlook
- In year one you build about $30k of equity ($2k loan paydown + $28k appreciation (10.0% local appreciation)).
- Travis County population projected at +60% by 2050 — long-run rental-demand tailwind backs the buy-and-hold thesis.
- By year 2, paydown + projected appreciation supports a ~$49k cash-out refi (75% LTV) — recoverable capital for the next deal without selling this one.
Negotiation context
- It's been on market 119 days — a 9% lower offer ($237k) is reasonable based on typical stale-listing flexibility.
Questions for the listing agent
- What do current leases actually rent for vs. the listed asking? Can we see a recent rent roll and the last 12 months of T-12 income?
- It's been on market 119 days. Have you received any prior offers? Is the seller open to a 16% concession, seller financing, or rate buy-down credit?
- What does the HOA fee cover, when was the last increase, and are there any pending special assessments or reserve-fund shortfalls?
- Why hasn't it sold? Are there any deal-killer items the seller is aware of (foundation, flood, title, zoning, code violations)?
- Is there a deadline driving the sale (1031 exchange, divorce, estate, relocation)? That informs how much negotiation room exists.
- Schools are F-rated, which usually means shorter tenancies and higher turnover. Who's the typical renter profile here, and what's been the actual vacancy rate?
- The area grade is low — what's the realistic commute time and amenity access for the typical tenant pool here? Any planned neighborhood developments (good or bad) we should know about?
- What's the average days-on-market for RENTAL listings here right now (not sales)? A rising rental-DOM trend means longer vacancies and softer asking-rent achievability than the comps imply.
- What's the recent tenant-quality profile in this submarket — average credit score on applications, eviction rate, late-payment / NSF rate, and stable-employment percentage? A property-management company in the area should have these aggregated.
- How much new for-sale + rental construction is in the pipeline within 1–3 miles? Heavy new supply typically softens prices + rents 12–24 months out; constrained supply supports both.
Investment metrics
- 1% rule
- 0.77% ✗
- Cap rate
- 5.08%
- Cash-on-cash
- -4.33%
- DSCR
- 0.81
- GRM
- 10.9
CMA / ARV
- ARV (median comp)
- $284,627
- List price
- $259,990
- Delta
- -8.66%
- Verdict
- FAIR
- Comps
- 20 within 1.0 mi
Show comp detail 12 sales within ~0.75 mi
| Address | Dist | Beds/Ba | Sqft | Sold | Price | $/sf | Match |
|---|---|---|---|---|---|---|---|
| 13420 Barn Chime St | 0.08mi | 3/2.0 | 1,650 (+9%) | 3mo | $284,990 | $173 | 80 |
| 13605 Barn Chime St | 0.26mi | 3/2.0 | 1,610 (+6%) | 2mo | $289,990 | $180 | 76 |
| 13500 Barn Chime St | 0.15mi | 3/2.0 | 1,650 (+9%) | 3mo | $274,990 | $167 | 76 |
| 13512 Muny Pkwy | 0.19mi | 3/2.0 | 1,650 (+9%) | 3mo | $289,990 | $176 | 74 |
| 13531 Barn Chime St | 0.22mi | 3/2.0 | 1,610 (+6%) | 8mo | $324,990 | $202 | 73 |
| 13609 Barn Chime St | 0.27mi | 3/2.0 | 1,650 (+9%) | 4mo | $299,990 | $182 | 70 |
| 17920 Honey Locust Ln | 0.57mi | 3/2.0 | 1,562 (+3%) | 5mo | $234,900 | $150 | 65 |
| 13520 Knights Branch Dr | 0.57mi | 3/2.5 | 1,600 (+5%) | 2mo | $230,000 | $144 | 60 |
| 18153 Basketflower Bnd | 0.66mi | 3/2.0 | 1,442 (-5%) | 5mo | $230,000 | $160 | 56 |
| 13415 Mussel Run | 0.70mi | 3/2.0 | 1,450 (-5%) | 7mo | $235,000 | $162 | 54 |
| 17913 Honey Locust Ln | 0.59mi | 3/2.5 | 1,668 (+10%) | 2mo | $245,000 | $147 | 52 |
| 17813 Boardtree Dr | 0.58mi | 4/2.0 (+1) | 1,684 (+11%) | 3mo | $232,990 | $138 | 47 |
Match score weights: distance 35% · size 25% · config 20% · recency 20%. Top-matched comps best support the ARV.
Projected returns pro-forma
10.0% appreciation · 3.12% rent growth · sell at horizon
- IRR
- 21.2%
- Equity multiple
- 2.72×
- Total profit
- $137,037
- Equity at exit
- $256,415
- IRR
- 19.3%
- Equity multiple
- 6.25×
- Total profit
- $418,594
- Equity at exit
- $552,968
Cash invested: $79,696 (down + closing). Projections, not guarantees.
Landlord ↔ Tenant lean methodology
- Overall (STATE)
- 87 Strongly Landlord-Friendly
- State Texas
- 87 Strongly Landlord-Friendly · R+5
- County
- — inherits STATE
- City
- — inherits STATE
ZIP-level market 78621
- Home prices YoY
- 7.6%
- Rents YoY
- 3.1%
- Active inventory
- 820
- Price-to-rent
- 9.9×
Monthly cashflow live
- Estimated rent
- $2,178 high interval (Pro) →
- Mortgage (P&I)
- −$1,493
- Tax est. 1.5%
- −$356 /mo · $4,269/yr
- Insurance
- −$119
- HOA
- −$41
- Lot rent
- −$0
- Vacancy / Maint / Mgmt
- −$457
- Net cashflow
- $-287
Break-even live
Sensitivity live
| Price | -10% $-91 | -5% $-189 | +0% $-287 | +5% $-386 | +10% $-484 |
|---|---|---|---|---|---|
| Rent | -10% $-459 | -5% $-373 | +0% $-287 | +5% $-201 | +10% $-115 |
| Rate | -1.0pp $-144 | -0.5pp $-215 | base $-287 | +0.5pp $-361 | +1.0pp $-436 |
UW: 25.0% down · 7.5% · 30yr · 1.5% tax · 5.0% vac · 8.0% maint · 8.0% mgmt
Financing live
Cash to close
- Down payment
- $71,157
- Closing costs
- $8,539
- Reserves months
- —
- Total cash needed
- —
Loan-product check · same deal, 3 products live
Conventional
25% down · 7.5% · 30yr
- Down + closing
- —
- Monthly P&I
- —
- Monthly cashflow
- —
- DSCR
- —
- Eligible?
- —
Personal DTI + credit; lowest rate.
DSCR
20% down · 8.5% · 30yr
- Down + closing
- —
- Monthly P&I
- —
- Monthly cashflow
- —
- DSCR
- —
- Eligible?
- —
No personal income docs; deal must DSCR.
Hard money
10% down · 12.0% · 12mo
- Down + closing
- —
- Monthly P&I
- —
- Monthly cashflow
- —
- DSCR
- —
- Eligible?
- —
Short-term bridge; refi at stabilization.
Rent comps 26 comps
| Address | Beds | Baths | Sqft | Rent | $/sqft | DOM | Units | Dist |
|---|---|---|---|---|---|---|---|---|
| 13501 Sierra Wind Ln Elgin, TX | 4.0 | 2.5 | 2066 | $2,500 | $1.21 | 22d | 1 | 0.09mi |
| 14129 Tordillo Dr Unit NA Elgin, TX | 4.0 | 2.5 | 1874 | $2,495 | $1.33 | 1d | 1 | 0.28mi |
| 14129 Tordillo Dr Elgin, TX | 4.0 | 2.5 | 1874 | $2,675 | $1.43 | 26d | 1 | 0.28mi |
| 13804 Knights Branch Dr Elgin, TX | 3.0 | 2.5 | 1427 | $1,900 | $1.33 | 7d | 1 | 0.43mi |
| 18436 Weatherby Ln Elgin, TX | 4.0 | 2.5 | 2095 | $2,000 | $0.95 | 7d | 1 | 0.44mi |
| 13121 Blackeyed Susan Trl Elgin, TX | 4.0 | 2.0 | 1586 | $1,800 | $1.13 | 20d | 1 | 0.45mi |
| 13725 Knights Branch Dr Elgin, TX | 4.0 | 2.5 | 1800 | $2,100 | $1.17 | 26d | 1 | 0.45mi |
| 13604 Menard Way Elgin, TX | 3.0 | 2.0 | 1474 | $1,875 | $1.27 | 26d | 1 | 0.52mi |
| 13520 Knights Branch Dr Elgin, TX | 3.0 | 2.5 | 1600 | $1,850 | $1.16 | 4d | 1 | 0.55mi |
| 13501 Mussel Run Elgin, TX | 4.0 | 2.0 | 1667 | $1,800 | $1.08 | 19d | 1 | 0.66mi |
| 13124 Maidenhair Trl Elgin, TX | 4.0 | 2.0 | 1448 | $1,775 | $1.23 | 19d | 1 | 0.67mi |
| 13124 Maidenhair Trl Elgin, TX | 4.0 | 2.0 | 1448 | $1,775 | $1.23 | 26d | 1 | 0.67mi |
| 13305 Banquete St Elgin, TX | 4.0 | 2.0 | 1707 | $1,995 | $1.17 | 46d | 1 | 0.68mi |
| 17812 Prairie Verbena Ln Elgin, TX | 3.0 | 2.5 | 2049 | $2,199 | $1.07 | 46d | 1 | 0.78mi |
| 101 Bandara Woods Blvd Elgin, TX | 3.0 | 2.0 | 1499 | $1,769 | $1.18 | 17d | 1 | 1.07mi |
| 401 Bandara Woods Blvd Elgin, TX | 3.0 | 2.0 | 1665 | $1,875 | $1.13 | 46d | 1 | 1.18mi |
| 23408 Tiny Moons Way Elgin, TX | 4.0 | 2.5 | 2000 | $1,960 | $0.98 | 23d | 1 | 1.38mi |
| 13817 County Line Rd Elgin, TX | 1.0–3.0 | 1.0–2.0 | 937 | $1,890 | $2.02 | 0d | 6 | 1.39mi |
| 18505 Quiet Range Dr Unit 18505 Elgin, TX | 4.0 | 2.0 | 1794 | $1,785 | $0.99 | 7d | 1 | 1.41mi |
| 18505 Quiet Range Dr Elgin, TX | 4.0 | 2.0 | 1794 | $1,950 | $1.09 | 26d | 1 | 1.41mi |
| 722 Lavaca Loop Elgin, TX | 4.0 | 2.5 | 2075 | $1,895 | $0.91 | 20d | 1 | 1.41mi |
| 13249 Illumination Rd Unit R2 Elgin, TX | 4.0 | 3.0 | 2000 | $600 | $0.30 | 20d | 1 | 1.43mi |
| 13249 Illumination Rd Unit R3 Elgin, TX | 4.0 | 3.0 | 2000 | $560 | $0.28 | 24d | 1 | 1.43mi |
| 18525 Quiet Range Dr Elgin, TX | 4.0 | 2.0 | 1794 | $1,725 | $0.96 | 20d | 1 | 1.44mi |
| 18721 Quiet Range Dr Elgin, TX | 3.0–5.0 | 2.0–3.5 | 1773 | $2,085 | $1.18 | 0d | 1 | 1.48mi |
| 13249 Illumination Rd Unit R4 Elgin, TX | 4.0 | 3.0 | 2000 | $589 | $0.29 | 46d | 1 | 1.50mi |
HOA detail
- Monthly dues
- $41 · $492/yr
Listing history 17 events
-
2026-06-22days on market $259,990 Active 119 DOM
-
2026-06-21days on market $259,990 Active 118 DOM
-
2026-06-18days on market $259,990 Active 115 DOM
-
2026-06-17days on market $259,990 Active 114 DOM
-
2026-06-16days on market $259,990 Active 113 DOM
-
2026-06-15days on market $259,990 Active 112 DOM
-
2026-06-13days on market $259,990 Active 110 DOM
-
2026-06-09days on market $259,990 Active 106 DOM
-
2026-06-08days on market $259,990 Active 105 DOM
-
2026-06-07days on market $259,990 Active 104 DOM
-
2026-06-04days on market $259,990 Active 101 DOM
-
2026-06-03days on market $259,990 Active 100 DOM
-
2026-06-02days on market $259,990 Active 99 DOM
-
2026-06-01days on market $259,990 Active 98 DOM
-
2026-05-31days on market $259,990 Active 97 DOM
-
2026-03-29price $249,990 523-char remark
Show marketing remark (523 chars)
The Carroll III floorplan is where modern design meets everyday comfort. This thoughtful layout features 3 bedrooms and 2 bathrooms, perfectly balancing private retreats with open living spaces. The alley-load garage entry enhances curb appeal, giving the front of your home a clean, welcoming look. Inside, a designated tech space provides the ideal spot for working from home, studying, or staying connected. With its smart design and timeless style, the Carroll III offers the perfect setting to create lasting memories.
-
2026-02-23$269,990 Active 523-char remark
Show marketing remark (523 chars)
The Carroll III floorplan is where modern design meets everyday comfort. This thoughtful layout features 3 bedrooms and 2 bathrooms, perfectly balancing private retreats with open living spaces. The alley-load garage entry enhances curb appeal, giving the front of your home a clean, welcoming look. Inside, a designated tech space provides the ideal spot for working from home, studying, or staying connected. With its smart design and timeless style, the Carroll III offers the perfect setting to create lasting memories.
ⓘ Source: listings_history table (triggers on properties + properties_extension) + one-shot
backfill from property_details.listing_events for pre-trigger history.
Nearby sold comps map
Loading sold comps map…
Walkable amenities ~0.75 mi
Loading nearby amenities…
Taxation est. · year 1
- Rental income
- $26,137
- − Mortgage interest
- −$15,944
- − Property taxes
- −$4,269
- − Insurance
- −$1,423
- − Repairs & maintenance
- −$2,091
- − Management
- −$2,091
- − HOA
- −$492
- − Depreciation
- −$8,280
- Taxable loss
- −$8,453
- Est. tax savings @ 24.0%
- +$2,029
- After-tax cash flow
- $-1,419/yr
For passive investors: Depreciation is non-cash, so a rental often shows a tax loss while cash-flowing — sheltering income. Rental losses are passive: they offset passive income freely, and up to $25,000/yr can offset ordinary (W-2) income if you actively participate and your MAGI is under $100k (phasing out to $0 by $150k); unused losses carry forward. On sale, claimed depreciation is recaptured at up to 25%, and gains may owe capital-gains tax (a 1031 exchange can defer both). Figures are a year-1 estimate at your 24.0% rate — not tax advice; consult a CPA.
Condition & rehab AI · 7 photos
This Carroll III home in Elgin, TX, presents as move-in ready with excellent exterior and interior conditions. Minor updates to the exterior and interior can further enhance its value and appeal.
Value-add opportunities
- Both Painting the exterior — Fresh paint can enhance curb appeal and value.
- Both Landscaping improvements — Enhanced landscaping can improve curb appeal and attract potential buyers/renters.
- Both Interior updates — Updating the interior can increase the home's appeal and value.
- Rental HVAC maintenance — A clean and efficient HVAC system is crucial for rental properties.
- Both Kitchen and bathroom updates — Modernizing these spaces can significantly increase the home's value and appeal to buyers/renters.
Renovation cost estimate screening
Value-add ROI direction
- Both Painting the exterior — Fresh paint can enhance curb appeal and value. ↑
- Both Landscaping improvements — Enhanced landscaping can improve curb appeal and attract potential buyers/renters. ↑
- Both Interior updates — Updating the interior can increase the home's appeal and value. ↑
- Rental HVAC maintenance — A clean and efficient HVAC system is crucial for rental properties. ↑
- Both Kitchen and bathroom updates — Modernizing these spaces can significantly increase the home's value and appeal to buyers/renters. ↑
ⓘ Cost ranges are severity-bucket heuristics (US national rule-of-thumb). Get contractor quotes + a written scope before underwriting a rehab budget.
Schools (NCES district)
- District
- Elgin ISD
- NCES district ID
- 4818360
- Math proficiency
- 17% ▼ -9.00%
- Reading proficiency
- 26% ▼ -5.00%
- Median HH income
- $55,176
- Composite
- 19.62/100
- National rank
- #8749
- State rank
- #741 of 826 in TX
Livability — Elgin
- Score
- 74/100
- State rank
- #167
- US rank
- #4404
Category grades
Schools grade is shown separately in the Schools card above.
Census & demographics
- Census place
- Elgin, TX
- County
- Bastrop County · 68,601 people
- City population
- 27,860
- Metro
- Austin-Round Rock-Georgetown, TX
- Population (ZIP)
- 30,411
- Household income
- $98,534
- Rent vs Own
- Severe rent burden
- 235.0
Population outlook (Travis County) Hauer SSP2
- Today (2025)
- 1,545,133 people
- By 2030
- 1,729,269 · +11.9%
- By 2040
- 2,097,596 · +35.8%
- By 2050
- 2,463,890 · +59.5%
- By 2075
- 3,249,374 · +110.3%
- By 2100
- 3,801,868 · +146.1%
Race, ethnicity, and origin ACS 2023
- Neighborhood character
- Diverse neighborhood (Simpson 0.64)
- Race & ethnicity
- Hispanic / Latino 46% White 38% Two or more races 19% Black 11% Native American 1%
- Hispanic origin (detail)
- Mexican 38%
- Common ancestry
- Slovak 2% Italian 2% Romanian 1%
- Foreign-born
- 17% · Canada, Vietnam
- Languages at home
- 63% English-only · Spanish 36%
Political lean MEDSL · Travis
- 2024 margin
- Solid D (+39.3) · D 68.8% · R 29.4% · Other 1.8%
- 2008→2024 swing
- +9.9pp toward D · 2008: 29.4pp · 2024: 39.3pp
- All cycles
- 2024: D+39.3 2020: D+45.0 2016: D+38.9 2012: D+23.9 2008: D+29.4
Not yet ingested
- Civics
- —
Market trends
- HPI YoY
- ▲ 29.47%
- Current HPI
- 416.87
- Rent YoY
- ▲ 3.12%
- Metro
- Austin-Round Rock-Georgetown, TX
- State GDP YoY
- ▲ 3.95%
- F500 in state
- 110
Industry mix (Fortune 500 HQ in TX)
| Industry | F500 HQs | Revenue |
|---|---|---|
| Energy | 16 | $1,198B |
|
||
| Technology | 5 | $198B |
|
||
| Engineering / Construction | 4 | $72B |
|
||
| Energy Services | 3 | $60B |
|
||
| Utilities | 3 | $41B |
|
||
| Healthcare | 2 | $330B |
|
||
Price history
-7.4% since first listed2 events — show timeline
- 2026-03-29 Price Changed $249,990 Zillow
- 2026-02-23 Listed $269,990 Zillow
Cash-flow waterfall
monthlySold comps — $/sqft
last 12 mo · ≤1 miLoading sold comps…