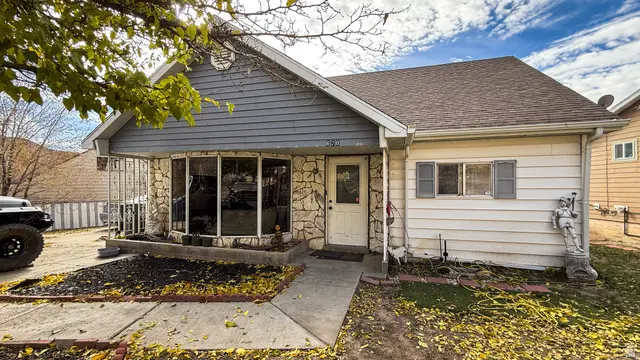
620 Edgehill Dr · East Carbon, UT
Flood risk 1/10 · Minimal
- FEMA flood zone
- X (unshaded)
- Chance of flooding over 30 yrs
- 0.0%
- Est. flood insurance / yr
- $507 – $1,088
Fire risk 7/10 · Major
- Est. fire insurance / yr
- $453 – $841
Heat risk 3/10 · Minor
- Hot days now (above threshold)
- —
- Hot days in 30 yrs
- —
Wind risk 1/10 · Minimal
- Chance of severe wind over 30 yrs
- —
Air-quality risk 2/10 · Minimal
- Unhealthy air days now
- 1 days/yr
- Unhealthy air days in 30 yrs
- 2 days/yr
Risk factors via First Street. Map © Google.
Why this score? — see what drove the C grade
The composite is a weighted blend of 9 inputs, each scored 0–100. Each bar is that input's sub-score; the figure is the points it added to the 100-point composite (weight × sub-score).
- Cash flow +20.6/30.0
- ARV discount +7.5/15.0
- DSCR +6.5/10.0
- 1% rule +5.4/10.0
- Appreciation +5.0/10.0
- Schools +3.4/10.0
- Rent growth +2.5/5.0
- Livability +2.5/5.0
- Condition / age +2.2/5.0
$115,000
🖨 Deal sheet (PDF) 📄 Offer letter ✓ Due diligence
Listing remarks
$5,000 Price Improvement! Discover this charming four-bedroom, two-bath home nestled at the edge of the mountains, where you can enjoy crisp, clean air and easy access to the great outdoors. Whether you love hiking, biking, off-road vehicles, or simply taking in the views, this cozy home makes the perfect base for all your adventures. The home could use a few updates, but with your personal touch, it's sure to become a place you'll be proud to call your own. Square footage figures are provided as a courtesy estimate only. Buyer is advised to obtain an independent measurement.
Key facts
- Crisp clean air
- 7,405 sq ft lot
- 4 parking spots
Tags
Property features AI
Finance
- Financial info: $1,269 annual tax (provided)
- HOA & community: Subdivision: Sunnyside Sub
Exterior
- Parking: 4 covered parking spaces (4 open spaces)
- Utilities: Natural gas connected; Electricity connected; Public sewer connected; Culinary water connected
- Home design: North-facing; Single-family home; 2 stories; Built and standing
- Construction: Frame and stone construction; Asphalt roof
- Exterior features: Located on a cul-de-sac; Partially fenced yard; Paved road and sidewalks; Gradual slope terrain; Mountain view; Mature trees
Interior
- Kitchen: Range/oven (free-standing)
- Bedrooms: One main-level bedroom
- Flooring: Carpet
- Bathrooms: One full bathroom
- Heating & cooling: Space heater (heating present)
- Interior features: Free-standing range/oven; Partial basement; 8 total rooms
- Laundry & utility: Has heating (space heater)
Neighborhood map
What this means for you Summary
Snapshot
- This is a 3-bed/1.0-bath single-family listed at $115k. Condition is rated fair.
Deal economics
- At list price, monthly cash flow is $153 ($2k/yr) — positive.
- The deal already cash-flows at list — no discount required.
- Meets the 1% rule at list price ($1k rent vs $115k).
- Recommended offer: $112k (3.0% below list) — sets the bar for market timing.
Location & tenants
- Location reads: area grade C — affects rentability + tenant quality, not the cash-flow math above.
- Carbon District (town): math 36% / reading 43% proficiency, ranked #53 of 80 in UT (top 66%) — families likely to look elsewhere, expect single-tenant / working-renter base with shorter leases.
- Zoned schools: Bruin Point School (math 24% / reading 24%, grade F, #474 of 585 statewide, top 83%, 97 students, 76% FRL); Mont Harmon Middle (math 36% / reading 44%, grade F, #72 of 138 statewide, top 53%, 601 students, 45% FRL); Carbon High (math 17% / reading 42%, grade F, #124 of 171 statewide, top 74%, 1,023 students, 34% FRL).
- Market conditions: 30 active listings in the ZIP; 1 comparable units currently listed for rent nearby; 196 units permitted in Carbon County in 2024 (168 in 5+ unit buildings).
Forward outlook
- In year one you build about $4k of equity ($795 loan paydown + $3k appreciation (3.0% local appreciation)).
- Carbon County population projected at -22% by 2050 — secular population decline; favor cash flow + early exit over multi-decade hold.
- At projected returns (3.0% appreciation + 3.0% rent growth), your $32k cash investment doubles in ~5 years — after that, you're playing with house money.
- By year 8, paydown + projected appreciation supports a ~$31k cash-out refi (75% LTV) — recoverable capital for the next deal without selling this one.
Negotiation context
- It's been on market 37 days — a 3% lower offer ($112k) is reasonable based on typical stale-listing flexibility.
Risks & watch-outs
- Watch-outs: built in 1945 — expect roof / HVAC / electrical / plumbing capex.
- Climate carrying-cost: major wildfire risk — expect insurance premiums to compound above CPI over the hold.
Questions for the listing agent
- It's been on market 37 days. Have you received any prior offers? Is the seller open to a 3% concession, seller financing, or rate buy-down credit?
- Have any recent inspections been done? Can we get a copy of the seller's disclosures and any deferred-maintenance estimates?
- Built in 1945 — when were the roof, HVAC, electrical panel, plumbing, and water heater last replaced?
- Is there a deadline driving the sale (1031 exchange, divorce, estate, relocation)? That informs how much negotiation room exists.
- What's the average days-on-market for RENTAL listings here right now (not sales)? A rising rental-DOM trend means longer vacancies and softer asking-rent achievability than the comps imply.
- What's the recent tenant-quality profile in this submarket — average credit score on applications, eviction rate, late-payment / NSF rate, and stable-employment percentage? A property-management company in the area should have these aggregated.
- How much new for-sale + rental construction is in the pipeline within 1–3 miles? Heavy new supply typically softens prices + rents 12–24 months out; constrained supply supports both.
Investment metrics
- 1% rule
- 1.04% ✓
- Cap rate
- 7.89%
- Cash-on-cash
- 5.71%
- DSCR
- 1.25
- GRM
- 8.0
CMA / ARV
No comps found within radius.
Projected returns pro-forma
3.0% appreciation · 3.0% rent growth · sell at horizon
- IRR
- 12.8%
- Equity multiple
- 1.73×
- Total profit
- $23,633
- Equity at exit
- $51,709
- IRR
- 14.8%
- Equity multiple
- 3.19×
- Total profit
- $70,493
- Equity at exit
- $79,690
Cash invested: $32,200 (down + closing). Projections, not guarantees.
Landlord ↔ Tenant lean methodology
- Overall (STATE)
- 86 Strongly Landlord-Friendly
- State Utah
- 86 Strongly Landlord-Friendly · R+15
- County
- — inherits STATE
- City
- — inherits STATE
ZIP-level market 84520
- Active inventory
- 30
- Price-to-rent
- 8.0×
Monthly cashflow live
- Estimated rent
- $1,200 medium interval (Pro) →
- Mortgage (P&I)
- −$603
- Tax est. 1.5%
- −$144 /mo · $1,725/yr
- Insurance
- −$48
- HOA
- −$0
- Vacancy / Maint / Mgmt
- −$252
- Net cashflow
- $153
Break-even live
Sensitivity live
| Price | -10% $233 | -5% $193 | +0% $153 | +5% $114 | +10% $74 |
|---|---|---|---|---|---|
| Rent | -10% $58 | -5% $106 | +0% $153 | +5% $201 | +10% $248 |
| Rate | -1.0pp $211 | -0.5pp $183 | base $153 | +0.5pp $123 | +1.0pp $93 |
UW: 25.0% down · 7.5% · 30yr · 1.5% tax · 5.0% vac · 8.0% maint · 8.0% mgmt
Financing live
Cash to close
- Down payment
- $28,750
- Closing costs
- $3,450
- Reserves months
- —
- Total cash needed
- —
Loan-product check · same deal, 3 products live
Conventional
25% down · 7.5% · 30yr
- Down + closing
- —
- Monthly P&I
- —
- Monthly cashflow
- —
- DSCR
- —
- Eligible?
- —
Personal DTI + credit; lowest rate.
DSCR
20% down · 8.5% · 30yr
- Down + closing
- —
- Monthly P&I
- —
- Monthly cashflow
- —
- DSCR
- —
- Eligible?
- —
No personal income docs; deal must DSCR.
Hard money
10% down · 12.0% · 12mo
- Down + closing
- —
- Monthly P&I
- —
- Monthly cashflow
- —
- DSCR
- —
- Eligible?
- —
Short-term bridge; refi at stabilization.
Rent comps 1 comps
| Address | Beds | Baths | Sqft | Rent | $/sqft | DOM | Units | Dist |
|---|---|---|---|---|---|---|---|---|
| 178 W Geneva East Carbon, UT | 2.0 | 1.0 | 1384 | $1,200 | $0.87 | 25d | 1 | 0.94mi |
Listing history 17 events
-
2026-06-22days on market $115,000 Active 37 DOM
-
2026-06-18days on market $115,000 Active 34 DOM
-
2026-06-17remarks 583-char remark
-
2026-06-17days on market $115,000 Active 33 DOM
-
2026-06-16days on market $115,000 Active 32 DOM
-
2026-06-15days on market $115,000 Active 31 DOM
-
2026-06-14pricedays on market $115,000 Active 29 DOM
-
2026-06-10days on market $120,000 Active 26 DOM
-
2026-06-09days on market $120,000 Active 25 DOM
-
2026-06-08days on market $120,000 Active 24 DOM
-
2026-06-07days on market $120,000 Active 23 DOM
-
2026-06-03days on market $120,000 Active 19 DOM
-
2026-06-02days on market $120,000 Active 18 DOM
-
2026-06-01days on market $120,000 Active 17 DOM
-
2026-05-31days on market $120,000 Active 16 DOM
-
2026-05-31days on market $120,000 Active 15 DOM
-
2026-05-16$120,000 Active 556-char remark
ⓘ Source: listings_history table (triggers on properties + properties_extension) + one-shot
backfill from property_details.listing_events for pre-trigger history.
Climate risk First Street
- Flood 1/10 Low FEMA zone X (unshaded) · 0% chance over 30 yrs
- Wildfire 7/10 Severe
- Heat 3/10 Moderate
- Wind 1/10 Low
- Air quality 2/10 Low 1 unhealthy d/yr today · 2 by 30 yrs out
Nearby sold comps map
Loading sold comps map…
Walkable amenities ~0.75 mi
Loading nearby amenities…
Taxation est. · year 1
- Rental income
- $14,400
- − Mortgage interest
- −$6,442
- − Property taxes
- −$1,725
- − Insurance
- −$575
- − Repairs & maintenance
- −$1,152
- − Management
- −$1,152
- − Depreciation
- −$3,345
- Taxable income
- $9
- Est. tax owed @ 24.0%
- −$2
- After-tax cash flow
- $1,837/yr
For passive investors: Depreciation is non-cash, so a rental often shows a tax loss while cash-flowing — sheltering income. Rental losses are passive: they offset passive income freely, and up to $25,000/yr can offset ordinary (W-2) income if you actively participate and your MAGI is under $100k (phasing out to $0 by $150k); unused losses carry forward. On sale, claimed depreciation is recaptured at up to 25%, and gains may owe capital-gains tax (a 1031 exchange can defer both). Figures are a year-1 estimate at your 24.0% rate — not tax advice; consult a CPA.
Condition & rehab AI · 12 photos
This home requires moderate renovations, focusing on structural repairs and interior updates to improve its condition and resale value.
Repairs flagged
- Major Exposed subfloor in kitchen and bath — Structural damage
- Major Missing countertops in kitchen and bath — Aesthetic and functional issues
Value-add opportunities
- Resale Paint interior walls — Enhances curb appeal and interior aesthetics
- Resale Replace carpeted flooring — Improves living space and resale value
- Resale Replace countertops in kitchen and bath — Restores functionality and aesthetics
Renovation cost estimate screening
| Repair item | Severity | Est. cost |
|---|---|---|
| Exposed subfloor in kitchen and bath · Structural damage | Major | $15,000–50,000 |
| Missing countertops in kitchen and bath · Aesthetic and functional issues | Major | $15,000–50,000 |
| Total estimated repair cost · 2 items | $30,000–100,000 |
Value-add ROI direction
- Resale Paint interior walls — Enhances curb appeal and interior aesthetics ↑
- Resale Replace carpeted flooring — Improves living space and resale value ↑
- Resale Replace countertops in kitchen and bath — Restores functionality and aesthetics ↑
ⓘ Cost ranges are severity-bucket heuristics (US national rule-of-thumb). Get contractor quotes + a written scope before underwriting a rehab budget.
Schools (NCES district)
- District
- Carbon District
- NCES district ID
- 4900150
- Math proficiency
- 36% ▼ -7.00%
- Reading proficiency
- 43% ▼ -4.00%
- Median HH income
- $45,189
- Composite
- 33.6/100
- National rank
- #5416
- State rank
- #53 of 80 in UT
Livability — East Carbon
No livability data for this city. (Only ~50 U.S. cities are tracked.)
Census & demographics
- Census place
- East Carbon, UT
- Population (ZIP)
- 991
Population outlook (Carbon County) Hauer SSP2
- Today (2025)
- 18,972 people
- By 2030
- 18,081 · -4.7%
- By 2040
- 16,260 · -14.3%
- By 2050
- 14,895 · -21.5%
- By 2075
- 13,123 · -30.8%
- By 2100
- 13,066 · -31.1%
Race, ethnicity, and origin ACS 2023
- Neighborhood character
- Predominantly White (81%)
- Race & ethnicity
- White 81% Hispanic / Latino 18% Two or more races 6% Native American 1%
- Hispanic origin (detail)
- Mexican 16%
- Common ancestry
- Italian 10% Lithuanian 3% Portuguese 2%
- Languages at home
- 99% English-only · Spanish 1%
Political lean MEDSL · Carbon
- 2024 margin
- Solid R (+44.4) · D 26.7% · R 71.1% · Other 2.1%
- 2008→2024 swing
- -36.4pp toward R · 2008: -8.0pp · 2024: -44.4pp
- All cycles
- 2024: R+44.4 2020: R+45.9 2016: R+44.6 2012: R+36.4 2008: R+8.0
Not yet ingested
- Civics
- —
Market trends
- HPI YoY
- —
- Current HPI
- —
- Rent YoY
- —
- Metro
- —
- State GDP YoY
- ▲ 3.54%
- F500 in state
- 2
Industry mix (Fortune 500 HQ in UT)
| Industry | F500 HQs | Revenue |
|---|---|---|
| Financial Services | 1 | $3B |
|
||
Price history
-4.2% since first listed2 events — show timeline
- 2026-06-14 Price Changed $115,000 WFRMLS
- 2026-05-16 Listed $120,000 WFRMLS
Cash-flow waterfall
monthlySold comps — $/sqft
last 12 mo · ≤1 miLoading sold comps…