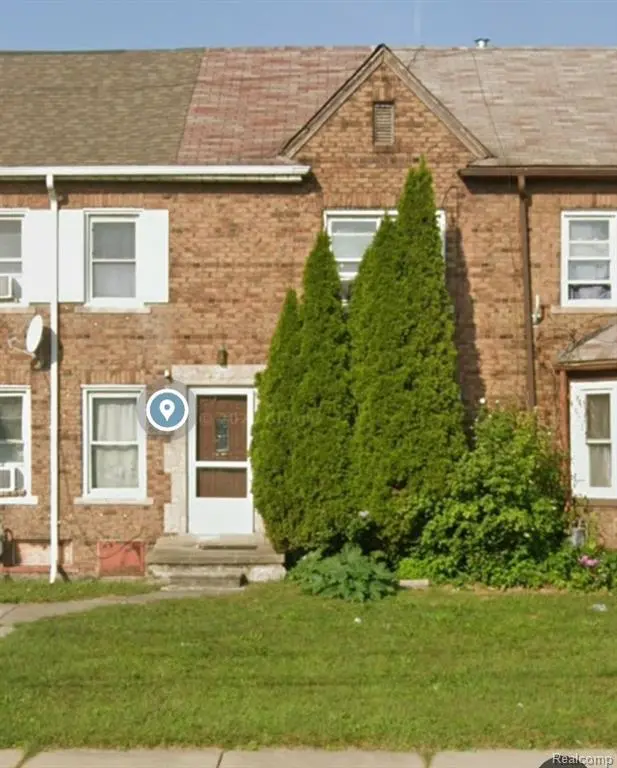
6257 Miller Rd · Dearborn, MI
Flood risk 1/10 · Minimal
- FEMA flood zone
- X (unshaded)
- Chance of flooding over 30 yrs
- 0.0%
- Est. flood insurance / yr
- $473 – $860
Fire risk 1/10 · Minimal
- Est. fire insurance / yr
- $784 – $1,456
Heat risk 3/10 · Minor
- Hot days now (above 96°F)
- 7 days/yr
- Hot days in 30 yrs
- 15 days/yr
Wind risk 2/10 · Minimal
- Chance of severe wind over 30 yrs
- —
Air-quality risk 3/10 · Minor
- Unhealthy air days now
- 2 days/yr
- Unhealthy air days in 30 yrs
- 4 days/yr
Risk factors via First Street. Map © Google.
Why this score? — see what drove the C grade
The composite is a weighted blend of 9 inputs, each scored 0–100. Each bar is that input's sub-score; the figure is the points it added to the 100-point composite (weight × sub-score).
- Cash flow +18.8/30.0
- ARV discount +11.0/15.0
- DSCR +5.9/10.0
- 1% rule +5.2/10.0
- Rent growth +5.0/5.0
- Livability +4.0/5.0
- Schools +2.8/10.0
- Condition / age +2.5/5.0
- Appreciation +0.0/10.0
$125,000
🖨 Deal sheet (PDF) 📄 Offer letter ✓ Due diligence
Listing remarks MLS
Great investment opportunity or the perfect starter home located in the heart of Dearborn! This property offers incredible potential for both homeowners and investors alike. Conveniently situated near shopping, dining, schools, and major freeways, it provides easy access to everything the city has to offer. Featuring a functional layout, this home is ready for your personal touch or to generate immediate rental income. Whether you're looking to expand your portfolio or settle into your first home, 6257 Miller is a fantastic opportunity you don't want to miss! Property sold AS IS. Buyer to assume repairs and obtain Certificate of Occupancy. All data and measurements are approx. Buyer and buyer's agent to verify all information.
Key facts
- Easy access
- Heart of dearborn
- Functional layout
Tags
Property features AI
Finance
- Financial info: Annual tax amount listed (amount excluded per instructions)
Exterior
- Parking: No garage
- Utilities: Public water; Public sewer
- Home design: Single family residence; Two levels; Ground-level entry with steps; Brick construction
- Construction: Brick exterior; Asphalt roof; Unfinished basement
- Exterior features: Asphalt roof; Paved road access; Exterior lighting
Interior
- Kitchen: Free-standing electric range; Free-standing refrigerator; Dishwasher not listed
- Bedrooms: Total of 4 rooms (bedrooms not specifically listed)
- Bathrooms: 1 full bathroom; 1 half bathroom
- Heating & cooling: Forced air heating; Natural gas heating; No cooling system
- Interior features: Gas water heater; Unfinished basement; Lighting (exterior lighting noted)
- Laundry & utility: Washer; Dryer
Neighborhood map
What this means for you Summary
Snapshot
- This is a 2-bed/2.0-bath townhouse listed at $125k.
Deal economics
- At list price, monthly cash flow is $127 ($2k/yr) — positive.
- The deal already cash-flows at list — no discount required.
- Meets the 1% rule at list price ($1k rent vs $125k).
- Recommended offer: $121k (3.0% below list) — sets the bar for market timing.
- Cap rate 7.5% vs local median 4.3% in Dearborn — top-decile yield for the area; either an underpriced asset or a hidden risk that comps aren't pricing in. Stress-test before assuming the spread holds.
Location & tenants
- Location reads 80/100 on livability (#84 in MI, #1,904 nationally) — a professional / high-income tenant draw. Strengths: commute A+, cost of living A+, housing A+; Watch: amenities D, schools D-.
- Dearborn City School District (urban): math 26% / reading 39% proficiency, ranked #325 of 540 in MI (top 60%) — families likely to look elsewhere, expect single-tenant / working-renter base with shorter leases; 66% free/reduced lunch — lower-income household profile, screen leases tightly.
- Market conditions: Rents rising fast (+13.2%/yr); 102 active listings in the ZIP; 7 comparable units currently listed for rent nearby; rentals at typical pace (median 25d on market — plan ~3-4 weeks tenant-placement turnaround); lower-income renter base — watch delinquency; 2,639 units permitted in Wayne County in 2024 (1,216 in 5+ unit buildings).
- This rent runs 36% of the median local income ($42k/yr) — at the standard rent-burdened threshold; future hikes will face affordability resistance.
Forward outlook
- Local home prices are declining (-3.0%/yr); year-one equity from $864 of loan paydown is wiped out by about $4k of value loss. Plan a longer hold.
- Wayne County population projected at -17% by 2050 — secular population decline; favor cash flow + early exit over multi-decade hold.
- At projected returns (-3.0% appreciation + 8.0% rent growth), your $35k cash investment doubles in ~10 years — after that, you're playing with house money.
Negotiation context
- It's been on market 43 days — a 3% lower offer ($121k) is reasonable based on typical stale-listing flexibility.
- 2 sale attempts with the ask held roughly flat each time — persistent listings suggest the price (not the market) is what's stuck; bring a comps-based counter.
Risks & watch-outs
- Watch-outs: built in 1931 — expect roof / HVAC / electrical / plumbing capex.
Questions for the listing agent
- It's been on market 43 days. Have you received any prior offers? Is the seller open to a 3% concession, seller financing, or rate buy-down credit?
- Built in 1931 — when were the roof, HVAC, electrical panel, plumbing, and water heater last replaced?
- Is there a deadline driving the sale (1031 exchange, divorce, estate, relocation)? That informs how much negotiation room exists.
- Schools are D-rated, which usually means shorter tenancies and higher turnover. Who's the typical renter profile here, and what's been the actual vacancy rate?
- What's the average days-on-market for RENTAL listings here right now (not sales)? A rising rental-DOM trend means longer vacancies and softer asking-rent achievability than the comps imply.
- What's the recent tenant-quality profile in this submarket — average credit score on applications, eviction rate, late-payment / NSF rate, and stable-employment percentage? A property-management company in the area should have these aggregated.
- How much new for-sale + rental construction is in the pipeline within 1–3 miles? Heavy new supply typically softens prices + rents 12–24 months out; constrained supply supports both.
Investment metrics
- 1% rule
- 1.02% ✓
- Cap rate
- 7.51%
- Cash-on-cash
- 4.34%
- DSCR
- 1.19
- GRM
- 8.2
CMA / ARV
- ARV (median comp)
- $135,615
- List price
- $125,000
- Delta
- -7.83%
- Verdict
- FAIR
- Comps
- 16 within 1.0 mi
Projected returns pro-forma
-3.0% appreciation · 8.0% rent growth · sell at horizon
- IRR
- -3.9%
- Equity multiple
- 0.84×
- Total profit
- $-5,436
- Equity at exit
- $18,638
- IRR
- 10.8%
- Equity multiple
- 2.04×
- Total profit
- $36,372
- Equity at exit
- $10,808
Cash invested: $35,000 (down + closing). Projections, not guarantees.
Landlord ↔ Tenant lean methodology
- Overall (STATE)
- 62 Landlord-Friendly
- State Michigan
- 62 Landlord-Friendly · EVEN
- County
- — inherits STATE
- City
- — inherits STATE
ZIP-level market 48126
- Rents YoY
- 13.2%
- Active inventory
- 102
- Price-to-rent
- 8.2×
Monthly cashflow live
- Estimated rent
- $1,272 high interval (Pro) →
- Mortgage (P&I)
- −$656
- Tax from tax record
- −$171 /mo · $2,050/yr
- Insurance
- −$52
- HOA
- −$0
- Vacancy / Maint / Mgmt
- −$267
- Net cashflow
- $127
Break-even live
Sensitivity live
| Price | -10% $197 | -5% $162 | +0% $127 | +5% $91 | +10% $56 |
|---|---|---|---|---|---|
| Rent | -10% $26 | -5% $76 | +0% $127 | +5% $177 | +10% $227 |
| Rate | -1.0pp $190 | -0.5pp $158 | base $127 | +0.5pp $94 | +1.0pp $61 |
UW: 25.0% down · 7.5% · 30yr · 1.5% tax · 5.0% vac · 8.0% maint · 8.0% mgmt
Financing live
Cash to close
- Down payment
- $31,250
- Closing costs
- $3,750
- Reserves months
- —
- Total cash needed
- —
Loan-product check · same deal, 3 products live
Conventional
25% down · 7.5% · 30yr
- Down + closing
- —
- Monthly P&I
- —
- Monthly cashflow
- —
- DSCR
- —
- Eligible?
- —
Personal DTI + credit; lowest rate.
DSCR
20% down · 8.5% · 30yr
- Down + closing
- —
- Monthly P&I
- —
- Monthly cashflow
- —
- DSCR
- —
- Eligible?
- —
No personal income docs; deal must DSCR.
Hard money
10% down · 12.0% · 12mo
- Down + closing
- —
- Monthly P&I
- —
- Monthly cashflow
- —
- DSCR
- —
- Eligible?
- —
Short-term bridge; refi at stabilization.
Rent comps 7 comps
| Address | Beds | Baths | Sqft | Rent | $/sqft | DOM | Units | Dist |
|---|---|---|---|---|---|---|---|---|
| 7100 Freda St Dearborn, MI | 1.0 | 1.0 | 900 | $895 | $0.99 | 44d | 3 | 0.66mi |
| 6225 Middlesex St Unit 5 Dearborn, MI | 2.0 | 1.0 | 700 | $950 | $1.36 | 5d | 1 | 0.75mi |
| 6225 Middlesex St Unit 5 Dearborn, MI | 2.0 | 1.0 | 700 | $950 | $1.36 | 13d | 1 | 0.75mi |
| 6406 Mead St Dearborn, MI | 2.0 | 1.0 | 904 | $1,100 | $1.22 | 24d | 1 | 1.20mi |
| 4326 Maple St Dearborn, MI | 2.0 | 1.5 | 873 | $1,695 | $1.94 | 24d | 1 | 1.26mi |
| 8283 Pinehurst St Unit 2 Detroit, MI | 2.0 | 1.0 | 1000 | $900 | $0.90 | 44d | 1 | 1.33mi |
| 4810 Ternes St Dearborn, MI | 2.0 | 1.0 | 720 | $1,350 | $1.88 | 18d | 1 | 1.43mi |
Listing history 15 events
-
2026-06-18days on market $125,000 Active 43 DOM
-
2026-06-17days on market $125,000 Active 42 DOM
-
2026-06-16days on market $125,000 Active 41 DOM
-
2026-06-15days on market $125,000 Active 40 DOM
-
2026-06-13days on market $125,000 Active 38 DOM
-
2026-06-09days on market $125,000 Active 34 DOM
-
2026-06-08days on market $125,000 Active 33 DOM
-
2026-06-07days on market $125,000 Active 32 DOM
-
2026-06-04days on market $125,000 Active 29 DOM
-
2026-06-03days on market $125,000 Active 28 DOM
-
2026-06-02days on market $125,000 Active 27 DOM
-
2026-06-01days on market $125,000 Active 26 DOM
-
2026-05-31days on market $125,000 Active 25 DOM
-
2026-05-06$125,000 Active 742-char remark
Show marketing remark (736 chars)
Great investment opportunity or the perfect starter home located in the heart of Dearborn! This property offers incredible potential for both homeowners and investors alike. Conveniently situated near shopping, dining, schools, and major freeways, it provides easy access to everything the city has to offer. Featuring a functional layout, this home is ready for your personal touch or to generate immediate rental income. Whether you're looking to expand your portfolio or settle into your first home, 6257 Miller is a fantastic opportunity you don't want to miss! Property sold AS IS. Buyer to assume repairs and obtain Certificate of Occupancy. All data and measurements are approx. Buyer and buyer's agent to verify all information.
-
2026-05-06$125,000 Active 736-char remark
Show marketing remark (736 chars)
Great investment opportunity or the perfect starter home located in the heart of Dearborn! This property offers incredible potential for both homeowners and investors alike. Conveniently situated near shopping, dining, schools, and major freeways, it provides easy access to everything the city has to offer. Featuring a functional layout, this home is ready for your personal touch or to generate immediate rental income. Whether you're looking to expand your portfolio or settle into your first home, 6257 Miller is a fantastic opportunity you don't want to miss! Property sold AS IS. Buyer to assume repairs and obtain Certificate of Occupancy. All data and measurements are approx. Buyer and buyer's agent to verify all information.
ⓘ Source: listings_history table (triggers on properties + properties_extension) + one-shot
backfill from property_details.listing_events for pre-trigger history.
Tax reassessment forecast MI · Partial reset (capped growth)
- Current annual tax
- $2,050 · $171/mo
- Projected year-2 tax
- $2,050 · $171/mo
- Expected delta
- $0/yr ($0/mo · 0.0%)
ⓘ Screening estimate from a state-policy table — verify with the county assessor before closing.
Climate risk First Street
- Flood 1/10 Low FEMA zone X (unshaded) · 0% chance over 30 yrs
- Wildfire 1/10 Low
- Heat 3/10 Moderate 7 d/yr ≥96°F today · 15 d/yr by 30 yrs out
- Wind 2/10 Low
- Air quality 3/10 Moderate 2 unhealthy d/yr today · 4 by 30 yrs out
Nearby sold comps map
Loading sold comps map…
Walkable amenities ~0.75 mi
Loading nearby amenities…
Taxation est. · year 1
- Rental income
- $15,267
- − Mortgage interest
- −$7,002
- − Property taxes
- −$2,050
- − Insurance
- −$625
- − Repairs & maintenance
- −$1,221
- − Management
- −$1,221
- − Depreciation
- −$3,636
- Taxable loss
- −$489
- Est. tax savings @ 24.0%
- +$117
- After-tax cash flow
- $1,637/yr
For passive investors: Depreciation is non-cash, so a rental often shows a tax loss while cash-flowing — sheltering income. Rental losses are passive: they offset passive income freely, and up to $25,000/yr can offset ordinary (W-2) income if you actively participate and your MAGI is under $100k (phasing out to $0 by $150k); unused losses carry forward. On sale, claimed depreciation is recaptured at up to 25%, and gains may owe capital-gains tax (a 1031 exchange can defer both). Figures are a year-1 estimate at your 24.0% rate — not tax advice; consult a CPA.
Schools (NCES district)
- District
- Dearborn City School District
- NCES district ID
- 2611600
- Math proficiency
- 26% ▼ -14.00%
- Reading proficiency
- 39% ▼ -8.00%
- Median HH income
- $46,884
- Composite
- 27.93/100
- National rank
- #6864
- State rank
- #325 of 540 in MI
Livability — Dearborn
- Score
- 80/100
- State rank
- #84
- US rank
- #1904
Category grades
Schools grade is shown separately in the Schools card above.
Census & demographics
- Census place
- Dearborn, MI
- County
- Wayne County · 1,562,939 people
- City population
- 86,476
- Metro
- Detroit-Warren-Dearborn, MI
- Population (ZIP)
- 51,997
- Household income
- $42,140
- Rent vs Own
- Severe rent burden
- 2742.0
Population outlook (Wayne County) Hauer SSP2
- Today (2025)
- 1,675,273 people
- By 2030
- 1,620,300 · -3.3%
- By 2040
- 1,502,341 · -10.3%
- By 2050
- 1,384,039 · -17.4%
- By 2075
- 1,124,592 · -32.9%
- By 2100
- 881,193 · -47.4%
Race, ethnicity, and origin ACS 2023
- Neighborhood character
- Predominantly White (90%)
- Race & ethnicity
- White 90% Two or more races 4% Black 3% Asian 2% Hispanic / Latino 1%
- Common ancestry
- Arab 8% Romanian 2% Armenian 1%
- Foreign-born
- 43% · Canada, South Korea
- Languages at home
- 26% English-only · Arabic 70% Other Indo-European 2% Spanish 1%
Political lean MEDSL · Wayne
- 2024 margin
- Strong D (+29.0) · D 62.7% · R 33.7% · Other 3.6%
- 2008→2024 swing
- -20.5pp toward R · 2008: 49.5pp · 2024: 29.0pp
- All cycles
- 2024: D+29.0 2020: D+38.1 2016: D+37.3 2012: D+46.9 2008: D+49.5
Not yet ingested
- Civics
- —
Market trends
- HPI YoY
- ▼ -266.09%
- Current HPI
- 241.0732
- Rent YoY
- ▲ 13.15%
- Metro
- Detroit-Warren-Dearborn, MI
- State GDP YoY
- ▲ 1.37%
- F500 in state
- 28
Industry mix (Fortune 500 HQ in MI)
| Industry | F500 HQs | Revenue |
|---|---|---|
| Automotive Parts | 3 | $48B |
|
||
| Automotive | 2 | $372B |
|
||
| Chemicals | 1 | $45B |
|
||
| Automotive Retail | 1 | $29B |
|
||
| Healthcare / Medical Devices | 1 | $23B |
|
||
| Automotive Technology | 1 | $20B |
|
||
Price history
+0.0% since first listed2 events — show timeline
- 2026-05-06 Listed $125,000 REALCOMP
- 2026-05-06 Listed $125,000 MiRealSource-MiMLS
Property tax history
+6.5%/yrLatest (2025): $2,050 · +2.3% YoY. Source: county tax records.
Cash-flow waterfall
monthlySold comps — $/sqft
last 12 mo · ≤1 miLoading sold comps…