 6-Plex
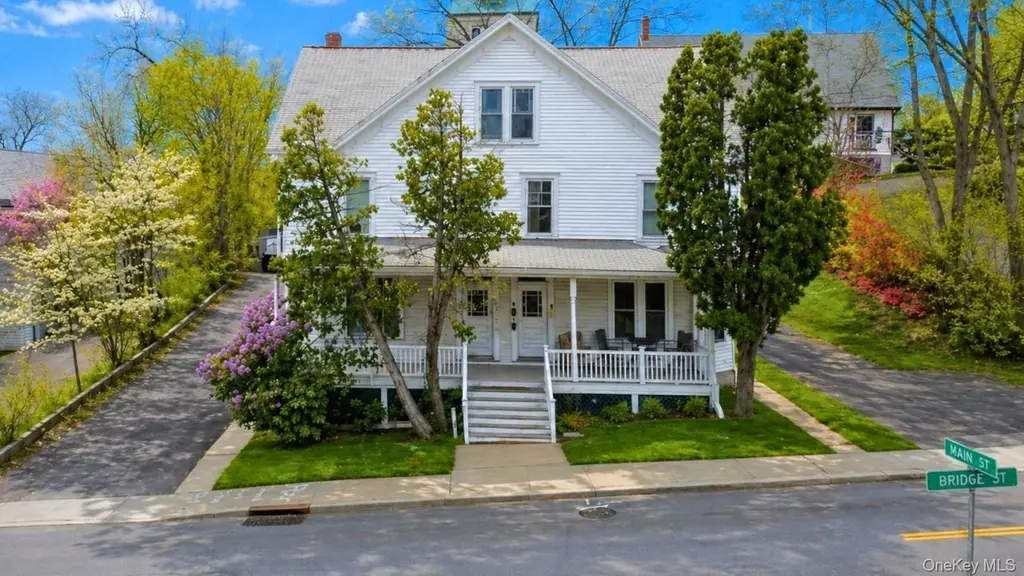
91 Bridge St #93 · Catskill, NY
Flood risk 6/10 · Moderate
- FEMA flood zone
- X (unshaded)
- Chance of flooding over 30 yrs
- 0.27%
- Est. flood insurance / yr
- $473 – $860
Fire risk 1/10 · Minimal
- Est. fire insurance / yr
- $691 – $1,283
Heat risk 4/10 · Minor
- Hot days now (above 99°F)
- 7 days/yr
- Hot days in 30 yrs
- 17 days/yr
Wind risk 4/10 · Minor
- Chance of severe wind over 30 yrs
- 9.0%
Air-quality risk 2/10 · Minimal
- Unhealthy air days now
- 0 days/yr
- Unhealthy air days in 30 yrs
- 1 days/yr
Risk factors via First Street. Map © Google.
Why this score? — see what drove the A- grade
The composite is a weighted blend of 9 inputs, each scored 0–100. Each bar is that input's sub-score; the figure is the points it added to the 100-point composite (weight × sub-score).
- Cash flow +30.0/30.0
- 1% rule +10.0/10.0
- DSCR +10.0/10.0
- Appreciation +10.0/10.0
- ARV discount +7.5/15.0
- Schools +4.1/10.0
- Livability +3.5/5.0
- Rent growth +2.5/5.0
- Condition / age +2.5/5.0
$539,000
🖨 Deal sheet (PDF) 📄 Offer letter ✓ Due diligence
Multi-family units
County records classify this as Multi-Family (5+ Unit). Listing-text estimate: 6 units. confirmed
5+ unit building — per-unit beds/baths from public records are typically unavailable; the breakdown below (if shown) is an estimate from the listing text.
Listing remarks MLS
6 Unit Diamond in the rough investment opportunity. This is a rehab project with earning power potential of 100,000/yr. Needs approx 200,000 in repairs including roof. Being sold as-is with a dilapidated 4 car garage that can be converted into ADU/Workshop/Studio, off street parking, full basement/solid foundation, heat and hot water included. 3 of 6 units are rented. 3 are vacant. We are not selling the cap rate. Steps to Main St and waterfront parks. 1/2 mile to Rip Van Winkle Bridge. This is not for the novice investor. Being sold as-is, no inspection contingencies.
Key facts
- Waterfront parks
- Steps to main st
- Off street parking
Tags
Neighborhood map
What this means for you Summary
Snapshot
- This is a 6 × 9-bed/6.0-bath units multifamily listed at $539k.
Deal economics
- At list price, monthly cash flow is $7k ($90k/yr) — positive. Per door: $1k/mo.
- The deal already cash-flows at list — no discount required.
- Meets the 1% rule at list price ($14k rent vs $539k).
- Recommended offer: $531k (1.5% below list) — sets the bar for market timing.
- Cap rate 22.9% vs local median 2.9% in Catskill — top-decile yield for the area; either an underpriced asset or a hidden risk that comps aren't pricing in. Stress-test before assuming the spread holds.
Location & tenants
- Location reads 69/100 on livability (#483 in NY) — a middle-class / working-renter tenant base. Strengths: health & safety A+, crime B+; Watch: schools C-, amenities F, commute F.
- Catskill Central School District (town): math 45% / reading 51% proficiency, ranked #429 of 590 in NY (top 73%) — families likely to look elsewhere, expect single-tenant / working-renter base with shorter leases.
- Market conditions: 105 active listings in the ZIP; 97 units permitted in Greene County in 2024 (0 in 5+ unit buildings).
- At $13,805/mo this rent would consume 227% of the median local household income ($73k/yr) (locally 318% of renters already pay >50% of income on rent) — very limited rent-growth headroom before tenants either downsize or default.
Forward outlook
- In year one you build about $58k of equity ($4k loan paydown + $54k appreciation (10.0% local appreciation)).
- Greene County population projected at -22% by 2050 — secular population decline; favor cash flow + early exit over multi-decade hold.
- At projected returns (10.0% appreciation + 3.0% rent growth), your $151k cash investment doubles in ~2 years — after that, you're playing with house money.
- By year 2, paydown + projected appreciation supports a ~$93k cash-out refi (75% LTV) — recoverable capital for the next deal without selling this one.
Negotiation context
- It's been on market 28 days — a 2% lower offer ($531k) is reasonable based on typical stale-listing flexibility.
- Current owner paid $435k; 24% above their basis — modest negotiation headroom, anchor on the comps not their cost.
Risks & watch-outs
- Watch-outs: built in 1930 — expect roof / HVAC / electrical / plumbing capex.
- Climate carrying-cost: major flood risk — expect insurance premiums to compound above CPI over the hold.
Questions for the listing agent
- Can we see the unit-by-unit rent roll, current vacancy, and any below-market leases? What's the average tenancy length?
- What capital expenditures (roof, boiler, parking lot, exteriors) have been made in the last 5 years, and what's planned in the next 2?
- Built in 1930 — when were the roof, HVAC, electrical panel, plumbing, and water heater last replaced?
- Is there a deadline driving the sale (1031 exchange, divorce, estate, relocation)? That informs how much negotiation room exists.
- What's the average days-on-market for RENTAL listings here right now (not sales)? A rising rental-DOM trend means longer vacancies and softer asking-rent achievability than the comps imply.
- What's the recent tenant-quality profile in this submarket — average credit score on applications, eviction rate, late-payment / NSF rate, and stable-employment percentage? A property-management company in the area should have these aggregated.
- How much new apartment / multifamily construction is in the pipeline within 1–3 miles? Heavy new supply (>2% of stock underway) typically softens rents 12–24 months out; light construction supports rent growth.
Investment metrics
- 1% rule
- 2.56% ✓
- Cap rate
- 22.90%
- Cash-on-cash
- 59.32%
- DSCR
- 3.64
- GRM
- 3.3
CMA / ARV
- ARV (median comp)
- $1,382,433
- List price
- $539,000
- Delta
- -61.01%
- Verdict
- UNDERPRICED
- Comps
- 6 within 1.0 mi
Projected returns pro-forma
10.0% appreciation · 3.0% rent growth · sell at horizon
- IRR
- 71.6%
- Equity multiple
- 6.09×
- Total profit
- $768,742
- Equity at exit
- $485,574
- IRR
- 65.4%
- Equity multiple
- 13.52×
- Total profit
- $1,890,235
- Equity at exit
- $1,047,158
Cash invested: $150,920 (down + closing). Projections, not guarantees.
Landlord ↔ Tenant lean methodology
- Overall (STATE)
- 15 Strongly Tenant-Friendly
- State New York
- 15 Strongly Tenant-Friendly · D+10
- County
- — inherits STATE
- City
- — inherits STATE
ZIP-level market 12414
- Home prices YoY
- 11.9%
- Active inventory
- 105
- Price-to-rent
- 19.5×
Monthly cashflow live
- Estimated rent
- $13,805 medium interval (Pro) →
- Mortgage (P&I)
- −$2,827
- Tax from tax record
- −$394 /mo · $4,734/yr
- Insurance
- −$225
- HOA
- −$0
- Vacancy / Maint / Mgmt
- −$2,899
- Net cashflow
- $7,460
Break-even live
Sensitivity live
| Price | -10% $7,765 | -5% $7,613 | +0% $7,460 | +5% $7,308 | +10% $7,155 |
|---|---|---|---|---|---|
| Rent | -10% $6,370 | -5% $6,915 | +0% $7,460 | +5% $8,006 | +10% $8,551 |
| Rate | -1.0pp $7,732 | -0.5pp $7,597 | base $7,460 | +0.5pp $7,321 | +1.0pp $7,179 |
6-unit breakdown (identical units grouped — click to expand)
| Units | Beds | Baths | Est. rent |
|---|---|---|---|
| 6× units | 9 | 6 | $13,806 |
| #1 | 9 | 6 | $2,301 |
| #2 | 9 | 6 | $2,301 |
| #3 | 9 | 6 | $2,301 |
| #4 | 9 | 6 | $2,301 |
| #5 | 9 | 6 | $2,301 |
| #6 | 9 | 6 | $2,301 |
| Total (6 units) | $13,805 | ||
UW: 25.0% down · 7.5% · 30yr · 1.5% tax · 5.0% vac · 8.0% maint · 8.0% mgmt
Financing live
Cash to close
- Down payment
- $134,750
- Closing costs
- $16,170
- Reserves months
- —
- Total cash needed
- —
Loan-product check · same deal, 3 products live
Conventional
25% down · 7.5% · 30yr
- Down + closing
- —
- Monthly P&I
- —
- Monthly cashflow
- —
- DSCR
- —
- Eligible?
- —
Personal DTI + credit; lowest rate.
DSCR
20% down · 8.5% · 30yr
- Down + closing
- —
- Monthly P&I
- —
- Monthly cashflow
- —
- DSCR
- —
- Eligible?
- —
No personal income docs; deal must DSCR.
Hard money
10% down · 12.0% · 12mo
- Down + closing
- —
- Monthly P&I
- —
- Monthly cashflow
- —
- DSCR
- —
- Eligible?
- —
Short-term bridge; refi at stabilization.
Listing history 4 events
-
2026-05-01$539,000 Active 575-char remark
Show marketing remark (575 chars)
6 Unit Diamond in the rough investment opportunity. This is a rehab project with earning power potential of 100,000/yr. Needs approx 200,000 in repairs including roof. Being sold as-is with a dilapidated 4 car garage that can be converted into ADU/Workshop/Studio, off street parking, full basement/solid foundation, heat and hot water included. 3 of 6 units are rented. 3 are vacant. We are not selling the cap rate. Steps to Main St and waterfront parks. 1/2 mile to Rip Van Winkle Bridge. This is not for the novice investor. Being sold as-is, no inspection contingencies.
-
2022-09-23soldstatus $435,000
-
1998-09-28soldstatus $60,000
-
1993-10-27soldstatus $140,000
ⓘ Source: listings_history table (triggers on properties + properties_extension) + one-shot
backfill from property_details.listing_events for pre-trigger history.
Tax reassessment forecast NY · Partial reset (capped growth)
- Current annual tax
- $4,734 · $394/mo
- Projected year-2 tax
- $6,921 · $577/mo
- Expected delta
- +$2,188/yr (+$182/mo · 46.2%)
ⓘ Screening estimate from a state-policy table — verify with the county assessor before closing.
Climate risk First Street
- Flood 6/10 Major FEMA zone X (unshaded) · 27% chance over 30 yrs
- Wildfire 1/10 Low
- Heat 4/10 Moderate 7 d/yr ≥99°F today · 17 d/yr by 30 yrs out
- Wind 4/10 Moderate 9% chance of damaging wind over 30 yrs
- Air quality 2/10 Low 0 unhealthy d/yr today · 1 by 30 yrs out
Nearby sold comps map
Loading sold comps map…
Walkable amenities ~0.75 mi
Loading nearby amenities…
Taxation est. · year 1
- Rental income
- $165,660
- − Mortgage interest
- −$30,192
- − Property taxes
- −$4,734
- − Insurance
- −$2,695
- − Repairs & maintenance
- −$13,253
- − Management
- −$13,253
- − Depreciation
- −$15,680
- Taxable income
- $85,853
- Est. tax owed @ 24.0%
- −$20,605
- After-tax cash flow
- $68,919/yr
For passive investors: Depreciation is non-cash, so a rental often shows a tax loss while cash-flowing — sheltering income. Rental losses are passive: they offset passive income freely, and up to $25,000/yr can offset ordinary (W-2) income if you actively participate and your MAGI is under $100k (phasing out to $0 by $150k); unused losses carry forward. On sale, claimed depreciation is recaptured at up to 25%, and gains may owe capital-gains tax (a 1031 exchange can defer both). Figures are a year-1 estimate at your 24.0% rate — not tax advice; consult a CPA.
Schools (NCES district)
- District
- Catskill Central School District
- NCES district ID
- 3606720
- Math proficiency
- 45% ▼ -9.00%
- Reading proficiency
- 51% ▲ 8.00%
- Median HH income
- $44,960
- Composite
- 40.63/100
- National rank
- #3685
- State rank
- #429 of 590 in NY
Livability — Catskill
- Score
- 69/100
- State rank
- #483
- US rank
- #8498
Category grades
Schools grade is shown separately in the Schools card above.
Census & demographics
- Census place
- Catskill, NY
- County
- Greene County · 10,169 people
- City population
- 10,169
- Metro
- nan
- Population (ZIP)
- 10,169
- Household income
- $73,036
- Rent vs Own
- Severe rent burden
- 318.0
Population outlook (Greene County) Hauer SSP2
- Today (2025)
- 44,963 people
- By 2030
- 43,126 · -4.1%
- By 2040
- 38,756 · -13.8%
- By 2050
- 34,913 · -22.4%
- By 2075
- 28,156 · -37.4%
- By 2100
- 22,296 · -50.4%
Race, ethnicity, and origin ACS 2023
- Neighborhood character
- Predominantly White (77%)
- Race & ethnicity
- White 77% Hispanic / Latino 10% Two or more races 8% Black 6%
- Hispanic origin (detail)
- Puerto Rican 7%
- Common ancestry
- Scotch-Irish 3% Iranian 3% Lithuanian 3%
- Foreign-born
- 4% · Canada, Mexico
- Languages at home
- 91% English-only · Spanish 5% Other Indo-European 2% Russian/Polish/Slavic 1%
Political lean MEDSL · Greene
- 2024 margin
- R (+17.0) · D 41.5% · R 58.5%
- 2008→2024 swing
- -7.1pp toward R · 2008: -9.9pp · 2024: -17.0pp
- All cycles
- 2024: R+17.0 2020: R+15.6 2016: R+27.4 2012: R+11.1 2008: R+9.9
Not yet ingested
- Civics
- —
Market trends
- HPI YoY
- ▲ 52.47%
- Current HPI
- 494.3394
- Rent YoY
- —
- Metro
- nan
- State GDP YoY
- ▲ 2.60%
- F500 in state
- 92
Industry mix (Fortune 500 HQ in NY)
| Industry | F500 HQs | Revenue |
|---|---|---|
| Financial Services | 10 | $950B |
|
||
| Consumer Goods | 9 | $162B |
|
||
| Insurance | 4 | $225B |
|
||
| Telecommunications | 2 | $144B |
|
||
| Pharmaceuticals | 2 | $112B |
|
||
| Media / Entertainment | 2 | $69B |
|
||
Price history
+285.0% since first listed4 events — show timeline
- 2026-05-01 Listed $539,000 OneKey® MLS as Distributed by MLS Grid
- 2022-09-23 Sold (Public Records) $435,000 Public Records
- 1998-09-28 Sold (Public Records) $60,000 Public Records
- 1993-10-27 Sold (Public Records) $140,000 Public Records
Property tax history
+1.9%/yrLatest (2025): $4,734 · +3.0% YoY. Source: county tax records.
Cash-flow waterfall
monthlySold comps — $/sqft
last 12 mo · ≤1 miLoading sold comps…