246 E 51st St Apt 11 · New York, NY
Flood risk 4/10 · Minor
- FEMA flood zone
- X (unshaded)
- Chance of flooding over 30 yrs
- 0.13%
- Est. flood insurance / yr
- $507 – $1,088
Fire risk 1/10 · Minimal
- Est. fire insurance / yr
- $691 – $1,283
Heat risk 6/10 · Moderate
- Hot days now (above 99°F)
- 7 days/yr
- Hot days in 30 yrs
- 15 days/yr
Wind risk 6/10 · Moderate
- Chance of severe wind over 30 yrs
- 27.0%
Air-quality risk 4/10 · Minor
- Unhealthy air days now
- 5 days/yr
- Unhealthy air days in 30 yrs
- 6 days/yr
Risk factors via First Street. Map © Google.
Why this score? — see what drove the C+ grade
The composite is a weighted blend of 9 inputs, each scored 0–100. Each bar is that input's sub-score; the figure is the points it added to the 100-point composite (weight × sub-score).
- Cash flow +19.6/30.0
- ARV discount +7.5/15.0
- Appreciation +7.5/10.0
- DSCR +6.2/10.0
- 1% rule +5.2/10.0
- Schools +5.0/10.0
- Rent growth +4.7/5.0
- Livability +3.8/5.0
- Condition / age +2.5/5.0
$599,999
🖨 Deal sheet (PDF) 📄 Offer letter ✓ Due diligence
Listing remarks
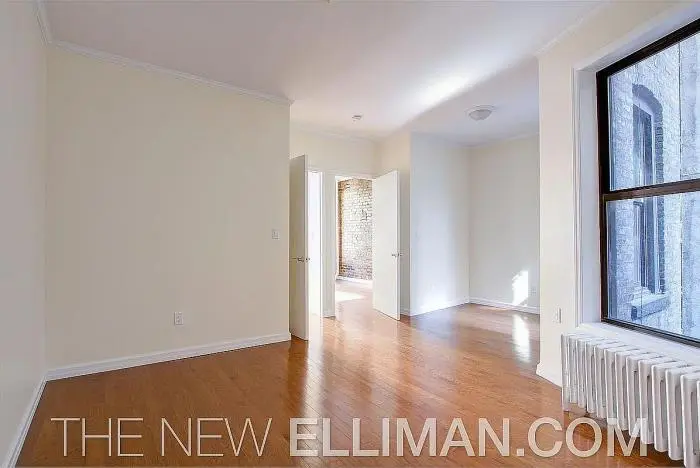
A Midtown Sanctuary with Character to Spare Tucked into a classic 1926 pre-war walk-up in the heart of Turtle Bay, this true two-bedroom is the kind of apartment that feels like a real New York home. Exposed brick, new hardwood floors, and a good layout give the space an intimacy that modern buildings simply can& apos; t replicate. The layout delivers on the two-bedroom promise & mdash; both bedrooms are genuine rooms, each with well-sized closets, not converted alcoves. The apartment is move-in ready: a combination washer/dryer in-unit means no laundromat runs, and three modern Midea U-shaped air conditioners keep every room comfortable year-round. Location-wise, it& apos; s
Key facts
- Built 1926
- Listed 72 days
Property features AI
Interior
- Bathrooms: 1 full bathroom
- Interior features: One full bathroom
Neighborhood map
What this means for you Summary
Snapshot
- This is a 2-bed/1.0-bath condo listed at $600k.
Deal economics
- At list price, monthly cash flow is $690 ($8k/yr) — positive.
- The deal already cash-flows at list — no discount required.
- Meets the 1% rule at list price ($6k rent vs $600k).
- Recommended offer: $564k (6.0% below list) — sets the bar for market timing.
- Cap rate 7.7% vs local median 2.6% in New York — top-decile yield for the area; either an underpriced asset or a hidden risk that comps aren't pricing in. Stress-test before assuming the spread holds.
Location & tenants
- Location reads 75/100 on livability (#268 in NY, #4,188 nationally) — a middle-class / working-renter tenant base. Strengths: amenities A+, commute A+, health & safety A; Watch: crime F, cost of living F.
- Market conditions: Rents rising fast (+8.7%/yr); 715 active listings in the ZIP; 40 comparable units currently listed for rent nearby; rentals leasing fast (median 9d on market — plan ~1-2 weeks tenant-placement turnaround); high-income renter base; 4,467 units permitted in New York County in 2024 (4,463 in 5+ unit buildings).
- This rent runs 43% of the median local income ($172k/yr) — at the standard rent-burdened threshold; future hikes will face affordability resistance.
Forward outlook
- In year one you build about $34k of equity ($4k loan paydown + $30k appreciation (5.0% local appreciation)).
- New York County population projected at +21% by 2050 — long-run rental-demand tailwind backs the buy-and-hold thesis.
- At projected returns (5.0% appreciation + 8.0% rent growth), your $168k cash investment doubles in ~4 years — after that, you're playing with house money.
- By year 2, paydown + projected appreciation supports a ~$54k cash-out refi (75% LTV) — recoverable capital for the next deal without selling this one.
Negotiation context
- It's been on market 72 days — a 6% lower offer ($564k) is reasonable based on typical stale-listing flexibility.
- 6 sale attempts since 14y ago with the ask held roughly flat each time — persistent listings suggest the price (not the market) is what's stuck; bring a comps-based counter.
Risks & watch-outs
- Watch-outs: built in 1926 — expect roof / HVAC / electrical / plumbing capex.
- Climate carrying-cost: major wind risk, 27% chance of damaging wind over 30y; extreme-heat days projected 7→15/yr by 2055 (HVAC capex compounding) — expect insurance premiums to compound above CPI over the hold.
Questions for the listing agent
- It's been on market 72 days. Have you received any prior offers? Is the seller open to a 6% concession, seller financing, or rate buy-down credit?
- Built in 1926 — when were the roof, HVAC, electrical panel, plumbing, and water heater last replaced?
- Any open or pending special assessments — roof, HVAC, plumbing, elevator, façade? What's the per-unit balance and payoff schedule, and is the seller paying it off at close or rolling it to the buyer?
- Why hasn't it sold? Are there any deal-killer items the seller is aware of (foundation, flood, title, zoning, code violations)?
- Is there a deadline driving the sale (1031 exchange, divorce, estate, relocation)? That informs how much negotiation room exists.
- Schools are B-rated — typically a magnet for longer-tenancy family renters. What's the average tenant stay here, and is there a school-zone premium baked into asking?
- Crime grade is F in this area — have there been break-ins, vandalism, or insurance claims at this property in the last 3 years? What carrier currently insures it and at what premium?
- What's the average days-on-market for RENTAL listings here right now (not sales)? A rising rental-DOM trend means longer vacancies and softer asking-rent achievability than the comps imply.
- What's the recent tenant-quality profile in this submarket — average credit score on applications, eviction rate, late-payment / NSF rate, and stable-employment percentage? A property-management company in the area should have these aggregated.
- How much new apartment / multifamily construction is in the pipeline within 1–3 miles? Heavy new supply (>2% of stock underway) typically softens rents 12–24 months out; light construction supports rent growth.
Investment metrics
- 1% rule
- 1.02% ✓
- Cap rate
- 7.67%
- Cash-on-cash
- 4.93%
- DSCR
- 1.22
- GRM
- 8.2
CMA / ARV
No comps found within radius.
Projected returns pro-forma
4.97% appreciation · 8.0% rent growth · sell at horizon
- IRR
- 19.6%
- Equity multiple
- 2.27×
- Total profit
- $213,536
- Equity at exit
- $338,813
- IRR
- 21.7%
- Equity multiple
- 5.08×
- Total profit
- $685,993
- Equity at exit
- $583,756
Cash invested: $168,000 (down + closing). Projections, not guarantees.
Landlord ↔ Tenant lean methodology
- Overall (CITY)
- 0 Strongly Tenant-Friendly
- State New York
- 15 Strongly Tenant-Friendly · D+10
- County
- — inherits STATE
- City New York
- 0 Strongly Tenant-Friendly · D+34
ZIP-level market 10022
- Home prices YoY
- 2.4%
- Rents YoY
- 8.7%
- Active inventory
- 715
- Price-to-rent
- 8.2×
Monthly cashflow live
- Estimated rent
- $6,122 high interval (Pro) →
- Mortgage (P&I)
- −$3,146
- Tax est. 1.5%
- −$750 /mo · $9,000/yr
- Insurance
- −$250
- HOA
- −$0
- Vacancy / Maint / Mgmt
- −$1,286
- Net cashflow
- $690
Break-even live
Sensitivity live
| Price | -10% $1,104 | -5% $897 | +0% $690 | +5% $482 | +10% $275 |
|---|---|---|---|---|---|
| Rent | -10% $206 | -5% $448 | +0% $690 | +5% $932 | +10% $1,173 |
| Rate | -1.0pp $992 | -0.5pp $842 | base $690 | +0.5pp $534 | +1.0pp $376 |
UW: 25.0% down · 7.5% · 30yr · 1.5% tax · 5.0% vac · 8.0% maint · 8.0% mgmt
Financing live
Cash to close
- Down payment
- $150,000
- Closing costs
- $18,000
- Reserves months
- —
- Total cash needed
- —
Loan-product check · same deal, 3 products live
Conventional
25% down · 7.5% · 30yr
- Down + closing
- —
- Monthly P&I
- —
- Monthly cashflow
- —
- DSCR
- —
- Eligible?
- —
Personal DTI + credit; lowest rate.
DSCR
20% down · 8.5% · 30yr
- Down + closing
- —
- Monthly P&I
- —
- Monthly cashflow
- —
- DSCR
- —
- Eligible?
- —
No personal income docs; deal must DSCR.
Hard money
10% down · 12.0% · 12mo
- Down + closing
- —
- Monthly P&I
- —
- Monthly cashflow
- —
- DSCR
- —
- Eligible?
- —
Short-term bridge; refi at stabilization.
Rent comps 40 comps
| Address | Beds | Baths | Sqft | Rent | $/sqft | DOM | Units | Dist |
|---|---|---|---|---|---|---|---|---|
| 300 E 51st St New York, NY | 2.0 | 1.0–2.0 | 875 | $7,930 | $9.06 | 4d | 3 | 0.08mi |
| 220 E 49th St Unit 1021974P New York, NY | 2.0 | 1.0 | 742 | $5,190 | $6.99 | 16d | 1 | 0.12mi |
| 340 E 51st St New York, NY | 2.0 | 1.0–2.0 | 791 | $7,630 | $9.65 | 5d | 3 | 0.14mi |
| 333 E 52nd St Unit 2177 New York, NY | 2.0 | 1.0 | 600 | $4,900 | $8.17 | 23d | 1 | 0.15mi |
| 340 E 52nd St #1527 New York, NY | 1.0 | 1.0 | 575 | $7,890 | $13.72 | 0d | 2 | 0.16mi |
| 160 E 48th St New York, NY | 3.0 | 1.0–2.0 | 878 | $8,572 | $9.76 | 5d | 9 | 0.19mi |
| 959 1st Ave Unit 6X New York, NY | 1.0 | 1.0 | 739 | $6,000 | $8.12 | 26d | 1 | 0.20mi |
| 301 E 47th St #1737 New York, NY | 2.0 | 1.0 | 600 | $5,380 | $8.97 | 22d | 1 | 0.21mi |
| 235 E 55th St Unit 36B New York, NY | 1.0 | 1.0 | 650 | $4,800 | $7.38 | 26d | 1 | 0.21mi |
| 940 1st Ave Unit 2040 New York, NY | 2.0 | 1.5 | 600 | $6,810 | $11.35 | 0d | 1 | 0.22mi |
| 135 E 47th St Unit 22F New York, NY | 1.0 | 1.0 | 700 | $7,500 | $10.71 | 23d | 1 | 0.23mi |
| 135 E 47th St New York, NY | 1.0 | 1.0 | 580 | $6,350 | $10.94 | 0d | 1 | 0.24mi |
| 123 E 54th St #1251 New York, NY | 1.0–2.0 | 1.0 | 600 | $6,090 | $10.15 | 0d | 2 | 0.27mi |
| 300 E 46th St New York, NY | 2.0–3.0 | 1.0 | 716 | $4,300 | $6.00 | 26d | 2 | 0.28mi |
| 420 E 54th St New York, NY | 3.0 | 1.0–2.5 | 1018 | $10,299 | $10.12 | 0d | 12 | 0.29mi |
| 330 E 46th St #1794 New York, NY | 1.0 | 1.0 | 489 | $4,990 | $10.19 | 26d | 2 | 0.30mi |
| 150 E 57th St New York, NY | 5.0 | 1.0–7.5 | 2750 | $15,738 | $5.72 | 3d | 5 | 0.30mi |
| 400 E 57th St #2106 New York, NY | 2.0 | 1.0–2.0 | 903 | $8,590 | $9.51 | 5d | 3 | 0.36mi |
| 230 E 44th St #2165 New York, NY | 1.0–2.0 | 1.0 | 568 | $5,320 | $9.36 | 26d | 2 | 0.37mi |
| 117 E 57th St New York, NY | 1.0 | 1.0 | 732 | $5,975 | $8.16 | 6d | 2 | 0.38mi |
| 329 E 58th St #807 New York, NY | 2.0 | 1.0 | 650 | $5,860 | $9.02 | 9d | 1 | 0.38mi |
| 227 E 59th St #635 New York, NY | 2.0 | 1.0 | 500 | $7,500 | $15.00 | 18d | 2 | 0.41mi |
| 599 E 56th St Unit 1817 New York, NY | 1.0 | 1.0 | 625 | $4,850 | $7.76 | 26d | 1 | 0.43mi |
| 252 E 61st St #638 New York, NY | 1.0 | 1.0 | 666 | $5,530 | $8.30 | 3d | 2 | 0.48mi |
| 18 W 48th St Unit 670 New York, NY | 1.0 | 1.0 | 631 | $7,730 | $12.25 | 9d | 1 | 0.55mi |
| 15 W 55th St #736 New York, NY | 2.0–3.0 | 1.0–2.0 | 1250 | $8,210 | $6.57 | 0d | 2 | 0.56mi |
| 151 E 62nd St Unit 1021834P New York, NY | 1.0 | 1.0 | 398 | $6,812 | $17.12 | 9d | 1 | 0.57mi |
| 403 E 62nd St Unit 14C New York, NY | 1.0 | 1.0 | 650 | $4,900 | $7.54 | 23d | 1 | 0.60mi |
| 225 E 63rd St #1675 New York, NY | 1.0 | 1.0 | 627 | $5,230 | $8.34 | 26d | 2 | 0.61mi |
| 220 E 65th St New York, NY | 1.0 | 1.0 | 700 | $5,950 | $8.50 | 3d | 1 | 0.66mi |
| 77 W 55th St Unit 15H New York, NY | 1.0 | 1.0 | 750 | $4,900 | $6.53 | 23d | 1 | 0.67mi |
| 138 E 38th St New York, NY | 3.0 | 1.0–2.0 | 750 | $6,420 | $8.56 | 26d | 4 | 0.68mi |
| 70 W 45th St #1131 New York, NY | 1.0–2.0 | 1.0–2.0 | 902 | $8,370 | $9.27 | 9d | 2 | 0.69mi |
| 556 3rd Ave New York, NY | 1.0 | 1.0 | 540 | $5,635 | $10.44 | 3d | 2 | 0.72mi |
| 556 3rd Ave New York, NY | 1.0 | 1.0 | 580 | $5,240 | $9.03 | 21d | 2 | 0.72mi |
| 556 3rd Ave Unit 2244 New York, NY | 1.0 | 1.0 | 500 | $5,640 | $11.28 | 0d | 1 | 0.72mi |
| 400 E 66th St Unit 1016404P New York, NY | 1.0–2.0 | 1.0–2.0 | 791 | $17,070 | $21.58 | 5d | 2 | 0.76mi |
| 41 Park Ave New York, NY | 2.0 | 1.0–2.0 | 815 | $8,170 | $10.02 | 9d | 3 | 0.77mi |
| 30 Park Ave #1347 New York, NY | 2.0 | 1.0 | 950 | $9,570 | $10.07 | 3d | 3 | 0.82mi |
| 222 E 34th St #999 New York, NY | 1.0 | 1.0 | 554 | $5,490 | $9.91 | 7d | 1 | 0.86mi |
HOA detail condo
- Monthly dues
- $0 · $0/yr
- Assessments
- None detected in remarks — confirm with the listing agent.
Listing history 20 events
-
2026-06-21days on market $599,999 Active 72 DOM
-
2026-06-18days on market $599,999 Active 69 DOM
-
2026-06-17days on market $599,999 Active 68 DOM
-
2026-06-15days on market $599,999 Active 66 DOM
-
2026-06-13days on market $599,999 Active 64 DOM
-
2026-06-10days on market $599,999 Active 60 DOM
-
2026-06-08days on market $599,999 Active 59 DOM
-
2026-06-03days on market $599,999 Active 54 DOM
-
2026-06-01days on market $599,999 Active 52 DOM
-
2026-05-31days on market $599,999 Active 51 DOM
-
2026-04-06$599,999 Active
-
2020-02-09historical
-
2020-02-09historical Temporarily Off Market
-
2020-01-08$699,000 Active
-
2020-01-06$699,000 Active
-
2020-01-06$699,000
-
2015-05-30$590,000
-
2013-02-27soldstatus
-
2013-02-15soldstatus
-
2012-10-11$479,000
ⓘ Source: listings_history table (triggers on properties + properties_extension) + one-shot
backfill from property_details.listing_events for pre-trigger history.
Climate risk First Street
- Flood 4/10 Moderate FEMA zone X (unshaded) · 13% chance over 30 yrs
- Wildfire 1/10 Low
- Heat 6/10 Major 7 d/yr ≥99°F today · 15 d/yr by 30 yrs out
- Wind 6/10 Major 27% chance of damaging wind over 30 yrs
- Air quality 4/10 Moderate 5 unhealthy d/yr today · 6 by 30 yrs out
Nearby sold comps map
Loading sold comps map…
Walkable amenities ~0.75 mi
Loading nearby amenities…
Taxation est. · year 1
- Rental income
- $73,461
- − Mortgage interest
- −$33,609
- − Property taxes
- −$9,000
- − Insurance
- −$3,000
- − Repairs & maintenance
- −$5,877
- − Management
- −$5,877
- − Depreciation
- −$17,455
- Taxable loss
- −$1,357
- Est. tax savings @ 24.0%
- +$326
- After-tax cash flow
- $8,602/yr
For passive investors: Depreciation is non-cash, so a rental often shows a tax loss while cash-flowing — sheltering income. Rental losses are passive: they offset passive income freely, and up to $25,000/yr can offset ordinary (W-2) income if you actively participate and your MAGI is under $100k (phasing out to $0 by $150k); unused losses carry forward. On sale, claimed depreciation is recaptured at up to 25%, and gains may owe capital-gains tax (a 1031 exchange can defer both). Figures are a year-1 estimate at your 24.0% rate — not tax advice; consult a CPA.
Schools (NCES district)
No district data.
Livability — New York
- Score
- 75/100
- State rank
- #268
- US rank
- #4188
Category grades
Schools grade is shown separately in the Schools card above.
Census & demographics
- Census place
- New York, NY
- County
- New York County · 1,599,927 people
- City population
- 7,731,280
- Metro
- New York-Newark-Jersey City, NY-NJ-PA
- Population (ZIP)
- 34,049
- Household income
- $172,026
- Rent vs Own
- Severe rent burden
- 2256.0
Population outlook (New York County) Hauer SSP2
- Today (2025)
- 1,825,725 people
- By 2030
- 1,904,611 · +4.3%
- By 2040
- 2,052,719 · +12.4%
- By 2050
- 2,206,601 · +20.9%
- By 2075
- 2,509,427 · +37.4%
- By 2100
- 2,702,933 · +48.0%
Race, ethnicity, and origin ACS 2023
- Neighborhood character
- Predominantly White (73%)
- Race & ethnicity
- White 73% Asian 12% Hispanic / Latino 8% Two or more races 7% Black 2%
- Hispanic origin (detail)
- Mexican 1% Puerto Rican 1% Dominican 1%
- Common ancestry
- Romanian 5% Scotch-Irish 5% Lithuanian 2%
- Foreign-born
- 24% · Canada, China, South Korea
- Languages at home
- 75% English-only · Spanish 6% Other Indo-European 6% Chinese 3%
Political lean MEDSL · New York
- 2024 margin
- Solid D (+64.8) · D 82.4% · R 17.6%
- 2008→2024 swing
- -7.4pp toward R · 2008: 72.2pp · 2024: 64.8pp
- All cycles
- 2024: D+64.8 2020: D+74.5 2016: D+77.2 2012: D+69.6 2008: D+72.2
Not yet ingested
- Civics
- —
Market trends
- HPI YoY
- ▲ 4.97%
- Current HPI
- 215.7225
- Rent YoY
- ▲ 8.69%
- Metro
- New York-Newark-Jersey City, NY-NJ-PA
- State GDP YoY
- ▲ 2.60%
- F500 in state
- 92
Industry mix (Fortune 500 HQ in NY)
| Industry | F500 HQs | Revenue |
|---|---|---|
| Financial Services | 10 | $950B |
|
||
| Consumer Goods | 9 | $162B |
|
||
| Insurance | 4 | $225B |
|
||
| Telecommunications | 2 | $144B |
|
||
| Pharmaceuticals | 2 | $112B |
|
||
| Media / Entertainment | 2 | $69B |
|
||
Price history
+25.3% since first listed10 events — show timeline
- 2026-04-06 Listed $599,999 Fizber.com
- 2020-02-09 Listing Removed — OneKey® MLS as Distributed by MLS Grid
- 2020-02-09 Delisted — RLS at REBNY
- 2020-01-08 Listed $699,000 OneKey® MLS as Distributed by MLS Grid
- 2020-01-06 Listed $699,000 RLS at REBNY
- 2020-01-06 Listed $699,000 RLS at REBNY
- 2015-05-30 Listed $590,000 RLS at REBNY
- 2013-02-27 Sold (MLS) — RLS at REBNY
- 2013-02-15 Sold (MLS) — RLS at REBNY
- 2012-10-11 Listed $479,000 RLS at REBNY
Cash-flow waterfall
monthlySold comps — $/sqft
last 12 mo · ≤1 miLoading sold comps…