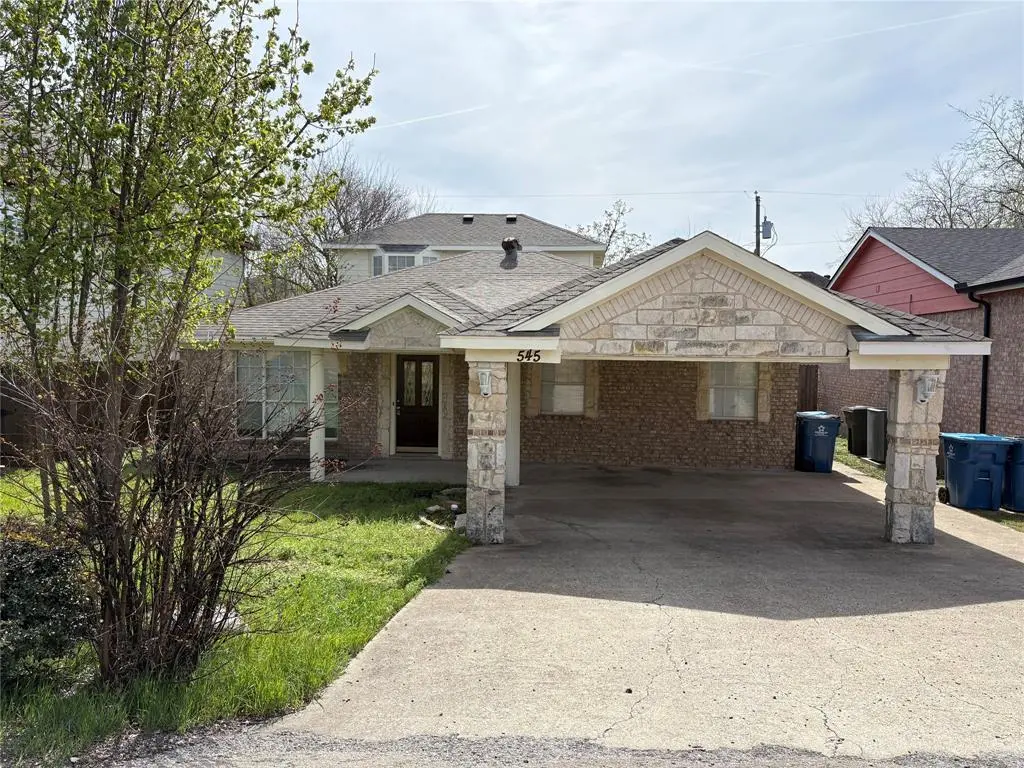
545 Tubbs · Rockwall, TX
Flood risk 1/10 · Minimal
- FEMA flood zone
- X (unshaded)
- Chance of flooding over 30 yrs
- 0.0%
- Est. flood insurance / yr
- $507 – $1,088
Fire risk 5/10 · Moderate
- Est. fire insurance / yr
- $1,222 – $2,270
Heat risk 7/10 · Major
- Hot days now (above 109°F)
- 7 days/yr
- Hot days in 30 yrs
- 25 days/yr
Wind risk 6/10 · Moderate
- Chance of severe wind over 30 yrs
- 27.0%
Air-quality risk 2/10 · Minimal
- Unhealthy air days now
- 2 days/yr
- Unhealthy air days in 30 yrs
- 2 days/yr
Risk factors via First Street. Map © Google.
Why this score? — see what drove the C- grade
The composite is a weighted blend of 9 inputs, each scored 0–100. Each bar is that input's sub-score; the figure is the points it added to the 100-point composite (weight × sub-score).
- ARV discount +15.0/15.0
- Cash flow +12.8/30.0
- Schools +5.0/10.0
- 1% rule +4.4/10.0
- Livability +3.9/5.0
- DSCR +3.8/10.0
- Rent growth +2.9/5.0
- Condition / age +2.5/5.0
- Appreciation +0.0/10.0
$255,000
🖨 Deal sheet (PDF) 📄 Offer letter ✓ Due diligence
Listing remarks MLS
Brick and Stone home two story with galley type kitchen. Large master with walkin closets and in Rockwall ISD. Does need some TLC. Buyers should obtain a free. preq. , letter with Wells Fargo Home Mort. ,or an entity which is a joint venture with a mort. consultant or online at wellsfargo. Buyers have option to provide proof of funds. Call agent for details in submitting an offer.
Key facts
- Private retreat
- Bright living areas
- 4,791 sq ft lot
Tags
Property features AI
Finance
- Financial info: No second mortgage reported; Listing offered with an exclusive right to sell
- HOA & community: No homeowners association
Exterior
- Parking: Covered parking space; 2-space carport; Driveway
- Utilities: City sewer; City water; Electricity connected; Not in a municipal utility district
- Home design: Single-family residence; Two levels; Residential property in the Rockwall Lake subdivision
- Construction: Built in 2000; Shingle roof; Slab foundation
- Exterior features: Back yard fencing; Lot under 0.5 acre (approximately 0.11 acre / 4,791 sq ft)
Interior
- Kitchen: Dishwasher; Disposal; Electric range
- Bedrooms: Primary bedroom located on the 2nd level (approx. 18 x 18); Three additional bedrooms on the 1st level (approx. 13 x 14; 11 x 12; 12 x 12)
- Flooring: Carpet; Ceramic tile
- Bathrooms: Two full bathrooms
- Heating & cooling: Central heating
- Interior features: Chandelier and decorative lighting; One living area and one dining area; Seven total rooms
- Laundry & utility: Separate utility room (approx. 4 x 4)
Neighborhood map
What this means for you Summary
Snapshot
- This is a 4-bed/2.0-bath single-family listed at $255k.
Deal economics
- At list price, monthly cash flow is $-24 ($-290/yr) — negative.
- To cash-flow at today's rent, offer at most $251k (1.7% below list).
- To meet the 1% rule (rent ≥ 1% of price), the offer needs to be $241k (5.6% below list).
- Recommended offer: $241k (5.6% below list) — sets the bar for 1% rule.
- Cap rate 6.2% vs local median 2.9% in Rockwall — top-decile yield for the area; either an underpriced asset or a hidden risk that comps aren't pricing in. Stress-test before assuming the spread holds.
Location & tenants
- Location reads 77/100 on livability (#86 in TX, #3,043 nationally) — a middle-class / working-renter tenant base. Strengths: employment A+, housing A+, crime A-; Watch: amenities F, commute F.
- Rockwall ISD (suburban): math 54% / reading 54% proficiency, ranked #83 of 826 in TX (top 10%) — acceptable for families but not a draw, mixed tenant base, ~2y average lease.
- Zoned schools: Amanda Rochell El (math 38% / reading 34%, grade F, #1,921 of 4,322 statewide, top 45%, 408 students, 65% FRL); Maurine Cain Middle (math 50% / reading 51%, grade C, #333 of 1,662 statewide, top 21%, 1,122 students, 31% FRL); Rockwall-Heath H S (math 50% / reading 61%, grade C, #364 of 1,632 statewide, top 23%, 2,912 students, 28% FRL) — zoned schools average 41% FRL vs 24% district-wide (17 pts higher); higher-poverty schools than district average — tighter screening recommended.
- Market conditions: Rents rising (+1.5%/yr); 978 active listings in the ZIP; 40 comparable units currently listed for rent nearby; rentals at typical pace (median 24d on market — plan ~3-4 weeks tenant-placement turnaround); high-income renter base; 1,810 units permitted in Rockwall County in 2024 (0 in 5+ unit buildings).
Forward outlook
- Local home prices are declining (-3.0%/yr); year-one equity from $2k of loan paydown is wiped out by about $8k of value loss. Plan a longer hold.
- Rockwall County population projected at +56% by 2050 — long-run rental-demand tailwind backs the buy-and-hold thesis.
Negotiation context
- It's been on market 34 days — a 3% lower offer ($247k) is reasonable based on typical stale-listing flexibility.
- 4 sale attempts since 13y ago with the ask held roughly flat each time — persistent listings suggest the price (not the market) is what's stuck; bring a comps-based counter.
- Current owner paid $124k; list at $255k implies a 106% gain — meaningful room to come down on a strong offer.
Risks & watch-outs
- Climate carrying-cost: major wind risk, 27% chance of damaging wind over 30y; moderate wildfire risk; extreme-heat days projected 7→25/yr by 2055 (HVAC capex compounding) — expect insurance premiums to compound above CPI over the hold.
Questions for the listing agent
- What do current leases actually rent for vs. the listed asking? Can we see a recent rent roll and the last 12 months of T-12 income?
- It's been on market 34 days. Have you received any prior offers? Is the seller open to a 6% concession, seller financing, or rate buy-down credit?
- Is there a deadline driving the sale (1031 exchange, divorce, estate, relocation)? That informs how much negotiation room exists.
- Schools are B-rated — typically a magnet for longer-tenancy family renters. What's the average tenant stay here, and is there a school-zone premium baked into asking?
- What's the average days-on-market for RENTAL listings here right now (not sales)? A rising rental-DOM trend means longer vacancies and softer asking-rent achievability than the comps imply.
- What's the recent tenant-quality profile in this submarket — average credit score on applications, eviction rate, late-payment / NSF rate, and stable-employment percentage? A property-management company in the area should have these aggregated.
- How much new for-sale + rental construction is in the pipeline within 1–3 miles? Heavy new supply typically softens prices + rents 12–24 months out; constrained supply supports both.
Investment metrics
- 1% rule
- 0.94% ✗
- Cap rate
- 6.18%
- Cash-on-cash
- -0.41%
- DSCR
- 0.98
- GRM
- 8.8
CMA / ARV
- ARV (on-the-fly)
- $386,616
- Comps found
- 12
Show comp detail 12 sales within ~0.75 mi
| Address | Dist | Beds/Ba | Sqft | Sold | Price | $/sf | Match |
|---|---|---|---|---|---|---|---|
| 426 Bass Rd | 0.05mi | 4/2.0 | 1,988 (-8%) | 9mo | $270,000 | $136 | 76 |
| 3690 Sycamore Ln | 0.21mi | 4/3.0 | 2,171 (-0%) | 16mo | $329,900 | $152 | 73 |
| 113 Windmill Ridge Dr | 0.43mi | 4/2.5 | 2,324 (+7%) | 0mo | $350,000 | $151 | 66 |
| 3159 Market Center Dr | 0.34mi | 3/2.0 (-1) | 2,250 (+4%) | 12mo | $392,000 | $174 | 63 |
| 3196 Market Center Dr | 0.26mi | 4/2.0 | 1,909 (-12%) | 9mo | $360,000 | $189 | 61 |
| 3020 Paint Brush Trl | 0.54mi | 4/2.0 | 1,936 (-11%) | 4mo | $345,000 | $178 | 53 |
| 157 Lakeside Dr | 0.42mi | 3/2.0 (-1) | 1,968 (-9%) | 12mo | $299,000 | $152 | 49 |
| 3985 FM 3097 | 0.41mi | 4/3.0 | 1,947 (-10%) | 13mo | $359,900 | $185 | 49 |
| 734 Brazos Way | 0.72mi | 4/2.0 | 2,012 (-7%) | 9mo | $399,900 | $199 | 46 |
| 3134 Oak Dr | 0.74mi | 4/3.0 | 2,414 (+11%) | 9mo | $524,999 | $217 | 36 |
| 751 Micah Dr | 0.72mi | 4/3.0 | 2,405 (+11%) | 14mo | $595,000 | $247 | 33 |
| 2913 Goldenwave St | 0.61mi | 3/2.5 (-1) | 1,872 (-14%) | 18mo | $319,900 | $171 | 26 |
Match score weights: distance 35% · size 25% · config 20% · recency 20%. Top-matched comps best support the ARV.
Projected returns pro-forma
-3.0% appreciation · 1.47% rent growth · sell at horizon
- IRR
- -18.8%
- Equity multiple
- 0.35×
- Total profit
- $-46,372
- Equity at exit
- $38,021
- IRR
- -14.9%
- Equity multiple
- 0.21×
- Total profit
- $-56,325
- Equity at exit
- $22,048
Cash invested: $71,400 (down + closing). Projections, not guarantees.
Landlord ↔ Tenant lean methodology
- Overall (STATE)
- 87 Strongly Landlord-Friendly
- State Texas
- 87 Strongly Landlord-Friendly · R+5
- County
- — inherits STATE
- City
- — inherits STATE
ZIP-level market 75032
- Home prices YoY
- -22.9%
- Rents YoY
- 1.5%
- Active inventory
- 978
- Price-to-rent
- 8.8×
Monthly cashflow live
- Estimated rent
- $2,406 high interval (Pro) →
- Mortgage (P&I)
- −$1,337
- Tax from tax record
- −$482 /mo · $5,779/yr
- Insurance
- −$106
- HOA
- −$0
- Vacancy / Maint / Mgmt
- −$505
- Net cashflow
- $-24
Break-even live
Sensitivity live
| Price | -10% $120 | -5% $48 | +0% $-24 | +5% $-96 | +10% $-169 |
|---|---|---|---|---|---|
| Rent | -10% $-214 | -5% $-119 | +0% $-24 | +5% $71 | +10% $166 |
| Rate | -1.0pp $104 | -0.5pp $41 | base $-24 | +0.5pp $-90 | +1.0pp $-157 |
UW: 25.0% down · 7.5% · 30yr · 1.5% tax · 5.0% vac · 8.0% maint · 8.0% mgmt
Financing live
Cash to close
- Down payment
- $63,750
- Closing costs
- $7,650
- Reserves months
- —
- Total cash needed
- —
Loan-product check · same deal, 3 products live
Conventional
25% down · 7.5% · 30yr
- Down + closing
- —
- Monthly P&I
- —
- Monthly cashflow
- —
- DSCR
- —
- Eligible?
- —
Personal DTI + credit; lowest rate.
DSCR
20% down · 8.5% · 30yr
- Down + closing
- —
- Monthly P&I
- —
- Monthly cashflow
- —
- DSCR
- —
- Eligible?
- —
No personal income docs; deal must DSCR.
Hard money
10% down · 12.0% · 12mo
- Down + closing
- —
- Monthly P&I
- —
- Monthly cashflow
- —
- DSCR
- —
- Eligible?
- —
Short-term bridge; refi at stabilization.
Rent comps 40 comps
| Address | Beds | Baths | Sqft | Rent | $/sqft | DOM | Units | Dist |
|---|---|---|---|---|---|---|---|---|
| 464 Bass Rd Rockwall, TX | 4.0 | 3.0 | 2220 | $2,450 | $1.10 | 45d | 1 | 0.06mi |
| 436 Perch Rd Rockwall, TX | 3.0 | 3.0 | 1888 | $2,866 | $1.52 | 1d | 1 | 0.10mi |
| 221 Dartmouth Dr Rockwall, TX | 3.0 | 2.0 | 1828 | $2,215 | $1.21 | 26d | 1 | 0.11mi |
| 552 Trout St Rockwall, TX | 3.0 | 2.0 | 1415 | $2,195 | $1.55 | 9d | 1 | 0.12mi |
| 552 Trout St Rockwall, TX | 3.0 | 2.0 | 1415 | $2,195 | $1.55 | 19d | 1 | 0.12mi |
| 112 Walnut Ln Rockwall, TX | 3.0 | 2.0 | 1491 | $1,895 | $1.27 | 18d | 1 | 0.14mi |
| 349 Bass Rd Rockwall, TX | 3.0 | 2.0 | 1594 | $1,649 | $1.03 | 17d | 1 | 0.17mi |
| 3729 Sycamore Ln Rockwall, TX | 3.0 | 2.0 | 1842 | $2,250 | $1.22 | 45d | 1 | 0.26mi |
| 147 Southlake Dr Rockwall, TX | 3.0 | 2.0 | 1637 | $2,095 | $1.28 | 26d | 1 | 0.33mi |
| 132 Brookshore Dr Rockwall, TX | 4.0 | 2.0 | 2029 | $2,200 | $1.08 | 45d | 1 | 0.33mi |
| 607 Pendleton Dr Rockwall, TX | 4.0 | 2.0 | 2000 | $2,249 | $1.12 | 26d | 1 | 0.35mi |
| 140 Trout St Rockwall, TX | 3.0 | 2.0 | 1680 | $1,950 | $1.16 | 45d | 1 | 0.41mi |
| 140 Trout St Rockwall, TX | 3.0 | 2.0 | 1480 | $1,950 | $1.32 | 23d | 1 | 0.41mi |
| 625 Primrose Ln Rockwall, TX | 4.0 | 2.0 | 1714 | $1,995 | $1.16 | 23d | 1 | 0.43mi |
| 204 Parkway Ct Rockwall, TX | 3.0 | 2.0 | 1674 | $2,425 | $1.45 | 22d | 1 | 0.43mi |
| 3107 Wildflower Way Rockwall, TX | 4.0 | 2.0 | 2071 | $2,350 | $1.13 | 26d | 1 | 0.47mi |
| 3083 Wildflower Way Rockwall, TX | 3.0 | 2.0 | 1768 | $2,286 | $1.29 | 1d | 1 | 0.52mi |
| 2917 Newport Dr Rockwall, TX | 4.0 | 2.5 | 2500 | $2,900 | $1.16 | 26d | 1 | 1.15mi |
| 644 Stafford Cir Rockwall, TX | 4.0 | 2.0 | 2413 | $3,250 | $1.35 | 26d | 1 | 1.22mi |
| 2316 Graystone Dr Rockwall, TX | 3.0 | 2.5 | 2414 | $2,240 | $0.93 | 4d | 1 | 1.24mi |
| 1429 Greenbrook Dr Rockwall, TX | 3.0 | 2.0 | 1584 | $2,150 | $1.36 | 26d | 1 | 1.24mi |
| 1827 Mystic St Rockwall, TX | 3.0 | 2.0 | 1834 | $5,850 | $3.19 | 4d | 1 | 1.24mi |
| 2820 Deer Ridge Dr Rockwall, TX | 4.0 | 2.5 | 2637 | $2,595 | $0.98 | 45d | 1 | 1.28mi |
| 672 Channel Ridge Dr Rockwall, TX | 3.0 | 2.0 | 2588 | $3,200 | $1.24 | 14d | 1 | 1.29mi |
| 1460 Stewart Dr Rockwall, TX | 5.0 | 2.5 | 2945 | $2,400 | $0.81 | 0d | 1 | 1.29mi |
| 1452 Hickory Creek Ln Rockwall, TX | 3.0 | 2.0 | 1498 | $1,995 | $1.33 | 26d | 1 | 1.31mi |
| 1464 Greenbrook Dr Rockwall, TX | 4.0 | 2.5 | 2280 | $2,076 | $0.91 | 14d | 1 | 1.31mi |
| 1454 Lochspring Dr Rockwall, TX | 3.0 | 2.0 | 1799 | $2,400 | $1.33 | 26d | 1 | 1.32mi |
| 1516 Englewood Dr Rockwall, TX | 5.0 | 2.5 | 2945 | $2,525 | $0.86 | 9d | 1 | 1.34mi |
| 3049 Coolwood Ln Rockwall, TX | 3.0 | 2.0 | 1603 | $1,950 | $1.22 | 20d | 1 | 1.34mi |
| 1476 Hickory Creek Ln Rockwall, TX | 3.0 | 2.0 | 1498 | $1,855 | $1.24 | 21d | 1 | 1.35mi |
| 3028 Misty Ridge Ln Rockwall, TX | 3.0 | 2.0 | 1843 | $1,075 | $0.58 | 7d | 1 | 1.35mi |
| 3081 Coolwood Ln Rockwall, TX | 3.0 | 2.0 | 1840 | $2,150 | $1.17 | 26d | 1 | 1.39mi |
| 3060 Misty Ridge Ln Rockwall, TX | 3.0 | 2.0 | 1611 | $2,075 | $1.29 | 14d | 1 | 1.39mi |
| 3022 Dusty Ridge Dr Rockwall, TX | 3.0 | 2.0 | 1790 | $2,125 | $1.19 | 45d | 1 | 1.39mi |
| 1038 Signal Ridge Pl Rockwall, TX | 3.0 | 2.0 | 1643 | $1,695 | $1.03 | 3d | 1 | 1.40mi |
| 311 Julian Dr Rockwall, TX | 3.0 | 2.0 | 2166 | $2,400 | $1.11 | 9d | 1 | 1.41mi |
| 1473 Madison Dr Rockwall, TX | 3.0 | 2.0 | 1693 | $2,100 | $1.24 | 45d | 1 | 1.42mi |
| 2065 Pontchartrain Dr Rockwall, TX | 3.0 | 2.5 | 2295 | $2,750 | $1.20 | 26d | 1 | 1.43mi |
| 2065 Pontchartrain Dr Rockwall, TX | 3.0 | 2.5 | 2295 | $3,000 | $1.31 | 45d | 1 | 1.43mi |
Listing history 28 events
-
2026-06-21days on market $255,000 Active 34 DOM
-
2026-06-18days on market $255,000 Active 31 DOM
-
2026-06-17days on market $255,000 Active 30 DOM
-
2026-06-16days on market $255,000 Active 29 DOM
-
2026-06-15days on market $255,000 Active 28 DOM
-
2026-06-13days on market $255,000 Active 26 DOM
-
2026-06-13days on market $255,000 Active 25 DOM
-
2026-06-09days on market $255,000 Active 22 DOM
-
2026-06-08days on market $255,000 Active 21 DOM
-
2026-06-07days on market $255,000 Active 20 DOM
-
2026-06-04days on market $255,000 Active 17 DOM
-
2026-06-03days on market $255,000 Active 16 DOM
-
2026-06-02days on market $255,000 Active 15 DOM
-
2026-06-01days on market $255,000 Active 14 DOM
-
2026-06-01price $255,000 Active 13 DOM
-
2026-05-31days on market $260,000 Active 13 DOM
-
2026-05-15$260,000 Active
-
2014-03-07soldstatus Closed 383-char remark
Show marketing remark (383 chars)
Brick and Stone home two story with galley type kitchen. Large master with walkin closets and in Rockwall ISD. Does need some TLC. Buyers should obtain a free. preq. , letter with Wells Fargo Home Mort. ,or an entity which is a joint venture with a mort. consultant or online at wellsfargo. Buyers have option to provide proof of funds. Call agent for details in submitting an offer.
-
2014-02-13status Pending 383-char remark
Show marketing remark (383 chars)
Brick and Stone home two story with galley type kitchen. Large master with walkin closets and in Rockwall ISD. Does need some TLC. Buyers should obtain a free. preq. , letter with Wells Fargo Home Mort. ,or an entity which is a joint venture with a mort. consultant or online at wellsfargo. Buyers have option to provide proof of funds. Call agent for details in submitting an offer.
-
2014-01-10$85,000 Active 383-char remark
Show marketing remark (383 chars)
Brick and Stone home two story with galley type kitchen. Large master with walkin closets and in Rockwall ISD. Does need some TLC. Buyers should obtain a free. preq. , letter with Wells Fargo Home Mort. ,or an entity which is a joint venture with a mort. consultant or online at wellsfargo. Buyers have option to provide proof of funds. Call agent for details in submitting an offer.
-
2013-11-07historical
-
2013-06-13status Active
-
2013-06-09status Pending
-
2013-05-26historical Active Option Contract
-
2013-05-22$100,000 Active
-
2006-02-02soldstatus
-
2005-08-18soldstatus
-
2002-06-06soldstatus $123,900
ⓘ Source: listings_history table (triggers on properties + properties_extension) + one-shot
backfill from property_details.listing_events for pre-trigger history.
Tax reassessment forecast TX · Resets to sale price
- Current annual tax
- $5,779 · $482/mo
- Projected year-2 tax
- $5,779 · $482/mo
- Expected delta
- $0/yr ($0/mo · 0.0%)
ⓘ Screening estimate from a state-policy table — verify with the county assessor before closing.
Climate risk First Street
- Flood 1/10 Low FEMA zone X (unshaded) · 0% chance over 30 yrs
- Wildfire 5/10 Major
- Heat 7/10 Severe 7 d/yr ≥109°F today · 25 d/yr by 30 yrs out
- Wind 6/10 Major 27% chance of damaging wind over 30 yrs
- Air quality 2/10 Low 2 unhealthy d/yr today · 2 by 30 yrs out
Nearby sold comps map
Loading sold comps map…
Walkable amenities ~0.75 mi
Loading nearby amenities…
Taxation est. · year 1
- Rental income
- $28,875
- − Mortgage interest
- −$14,284
- − Property taxes
- −$5,779
- − Insurance
- −$1,275
- − Repairs & maintenance
- −$2,310
- − Management
- −$2,310
- − Depreciation
- −$7,418
- Taxable loss
- −$4,501
- Est. tax savings @ 24.0%
- +$1,080
- After-tax cash flow
- $790/yr
For passive investors: Depreciation is non-cash, so a rental often shows a tax loss while cash-flowing — sheltering income. Rental losses are passive: they offset passive income freely, and up to $25,000/yr can offset ordinary (W-2) income if you actively participate and your MAGI is under $100k (phasing out to $0 by $150k); unused losses carry forward. On sale, claimed depreciation is recaptured at up to 25%, and gains may owe capital-gains tax (a 1031 exchange can defer both). Figures are a year-1 estimate at your 24.0% rate — not tax advice; consult a CPA.
Schools (NCES district)
- District
- Rockwall ISD
- NCES district ID
- 4837650
- Math proficiency
- 54% ▼ -13.00%
- Reading proficiency
- 54% ▼ -8.00%
- Median HH income
- $88,800
- Composite
- 49.82/100
- National rank
- #1952
- State rank
- #83 of 826 in TX
Livability — Rockwall
- Score
- 77/100
- State rank
- #86
- US rank
- #3043
Category grades
Schools grade is shown separately in the Schools card above.
Census & demographics
- Census place
- Rockwall, TX
- County
- Rockwall County · 132,930 people
- City population
- 84,191
- Metro
- Dallas-Fort Worth-Arlington, TX
- Population (ZIP)
- 39,865
- Household income
- $135,742
- Rent vs Own
- Severe rent burden
- 636.0
Population outlook (Rockwall County) Hauer SSP2
- Today (2025)
- 118,396 people
- By 2030
- 132,209 · +11.7%
- By 2040
- 159,538 · +34.7%
- By 2050
- 185,299 · +56.5%
- By 2075
- 243,489 · +105.7%
- By 2100
- 277,814 · +134.6%
Race, ethnicity, and origin ACS 2023
- Neighborhood character
- Predominantly White (67%)
- Race & ethnicity
- White 67% Hispanic / Latino 17% Two or more races 9% Black 9% Asian 3%
- Hispanic origin (detail)
- Mexican 11% Puerto Rican 1%
- Common ancestry
- Slovak 3% Lithuanian 2% Italian 2%
- Foreign-born
- 10% · Canada
- Languages at home
- 84% English-only · Spanish 10% Other Indo-European 2% Arabic 1%
Political lean MEDSL · Rockwall
- 2024 margin
- Solid R (+40.9) · D 29.1% · R 70.0%
- 2008→2024 swing
- +5.3pp toward D · 2008: -46.2pp · 2024: -40.9pp
- All cycles
- 2024: R+40.9 2020: R+37.7 2016: R+47.5 2012: R+53.3 2008: R+46.2
Not yet ingested
- Civics
- —
Market trends
- HPI YoY
- ▼ -61.97%
- Current HPI
- 209.0229
- Rent YoY
- ▲ 1.47%
- Metro
- Dallas-Fort Worth-Arlington, TX
- State GDP YoY
- ▲ 3.95%
- F500 in state
- 110
Industry mix (Fortune 500 HQ in TX)
| Industry | F500 HQs | Revenue |
|---|---|---|
| Energy | 16 | $1,198B |
|
||
| Technology | 5 | $198B |
|
||
| Engineering / Construction | 4 | $72B |
|
||
| Energy Services | 3 | $60B |
|
||
| Utilities | 3 | $41B |
|
||
| Healthcare | 2 | $330B |
|
||
Price history
+109.8% since first listed12 events — show timeline
- 2026-05-15 Listed $260,000 NTREIS
- 2014-03-07 Sold (MLS) — NTREIS
- 2014-02-13 Pending — NTREIS
- 2014-01-10 Listed $85,000 NTREIS
- 2013-11-07 Listing Removed — NTREIS
- 2013-06-13 Relisted — NTREIS
- 2013-06-09 Pending — NTREIS
- 2013-05-26 Contingent — NTREIS
- 2013-05-22 Listed $100,000 NTREIS
- 2006-02-02 Sold (Public Records) — Public Records
- 2005-08-18 Sold (Public Records) — Public Records
- 2002-06-06 Sold (Public Records) $123,900 Public Records
Property tax history
+6.1%/yrLatest (2025): $5,779 · +8.6% YoY. Source: county tax records.
Cash-flow waterfall
monthlySold comps — $/sqft
last 12 mo · ≤1 miLoading sold comps…