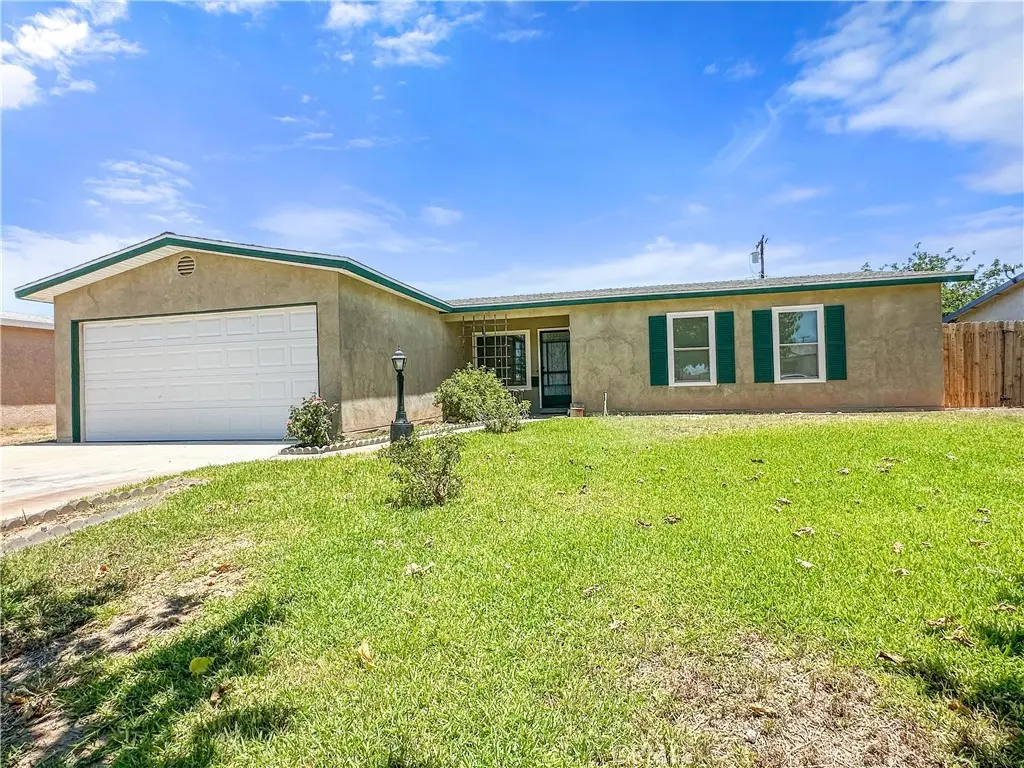
630 N 10 th St · Blythe, CA
Flood risk 1/10 · Minimal
- FEMA flood zone
- D
- Chance of flooding over 30 yrs
- 0.0%
- Est. flood insurance / yr
- $544 – $1,084
Fire risk 2/10 · Minimal
- Est. fire insurance / yr
- $659 – $1,223
Heat risk 9/10 · Severe
- Hot days now (above 116°F)
- 7 days/yr
- Hot days in 30 yrs
- 18 days/yr
Wind risk 1/10 · Minimal
- Chance of severe wind over 30 yrs
- —
Air-quality risk 2/10 · Minimal
- Unhealthy air days now
- 1 days/yr
- Unhealthy air days in 30 yrs
- 1 days/yr
Risk factors via First Street. Map © Google.
Why this score? — see what drove the D grade
The composite is a weighted blend of 9 inputs, each scored 0–100. Each bar is that input's sub-score; the figure is the points it added to the 100-point composite (weight × sub-score).
- ARV discount +13.8/15.0
- Cash flow +12.3/30.0
- Livability +3.7/5.0
- DSCR +3.6/10.0
- Schools +2.6/10.0
- Rent growth +2.5/5.0
- Condition / age +2.5/5.0
- 1% rule +2.3/10.0
- Appreciation +0.0/10.0
$220,000
🖨 Deal sheet (PDF) 📄 Offer letter ✓ Due diligence
Listing remarks
Charming 3-Bedroom Home with Bonus Workshop Space! Welcome to this move-in ready 3-bedroom, 2-bathroom home offering 1,460 sq ft of inviting living space. Inside, you’ll find brand new carpet, fresh interior paint, and energy-efficient windows and doors that help reduce utility costs and maintain year-round comfort. The spacious family room is perfect for relaxing or entertaining, and the home is equipped with reliable gas heating to keep you warm during cooler months. A versatile bonus room adds even more value — ideal for a home workshop, craft area, welding station, or extra storage space for your hobbies and projects. Enjoy outdoor living with a fully fenced backyard feat
Key facts
- Cozy rear porch
- Bonus workshop space
- Sprinkler system
Tags
Property features AI
Finance
- Other: Single-family unit (1 total unit); No ADU; No accessibility features; No common walls
- Financial info: Assessments: Unknown
- HOA & community: Street lighting; Sidewalks
Exterior
- Parking: Attached garage with 2 garage spaces; 2 uncovered parking spaces; Driveway; Attached carport; Total of 4 parking spaces
- Utilities: Natural gas connected; Electricity connected (standard); Water connected (District/Public); Public sewer
- Home design: House; One story; Entry at front door; Facing information not specified
- Construction: Stucco exterior; Shingle roof; Concrete slab foundation; Built year source: other
- Exterior features: Rear wood porch; Wood patio; Front and rear sprinklers; Lawn and yard; Chain link and wood fencing; No pool
Interior
- Kitchen: Microwave; Refrigerator; Trash compactor; Gas oven; Dishwasher; Formal dining room
- Bedrooms: 3 bedrooms on the main level; Primary bedroom
- Flooring: Tile; Carpet; Wood; Laminate
- Bathrooms: 2 full bathrooms; Tile counters; Shower-in-tub; Walk-in shower; Bathtub
- Heating & cooling: Central heating (furnace); Central cooling
- Interior features: Ceiling fan; Insulated doors; Formica counters; Front door entry; Double pane windows with blinds; One-level home; Turnkey condition; Has view
- Laundry & utility: Indoor laundry room; Individual laundry room; Electric dryer hookup
Neighborhood map
What this means for you Summary
Snapshot
- This is a 3-bed/2.0-bath single-family listed at $220k.
Deal economics
- At list price, monthly cash flow is $-41 ($-490/yr) — negative.
- To cash-flow at today's rent, offer at most $213k (3.3% below list).
- To meet the 1% rule (rent ≥ 1% of price), the offer needs to be $161k (26.8% below list).
- Recommended offer: $161k (26.8% below list) — sets the bar for 1% rule.
- Cap rate 6.1% vs local median 4.6% in Blythe — top-decile yield for the area; either an underpriced asset or a hidden risk that comps aren't pricing in. Stress-test before assuming the spread holds.
Location & tenants
- Location reads 74/100 on livability (#143 in CA, #4,910 nationally) — a middle-class / working-renter tenant base. Strengths: commute A+, housing A+, health & safety A+; Watch: employment D, amenities F.
- Palo Verde Unified (town): math 20% / reading 34% proficiency, ranked #1,133 of 1,400 in CA (top 81%) — low school quality limits family demand, transient renter base, plan for 1-2y turnover; 64% free/reduced lunch — lower-income household profile, screen leases tightly.
- Zoned schools: Ruth Brown Elementary (614 students, 88% FRL); Palo Verde High (820 students, 76% FRL) — zoned schools average 82% FRL vs 64% district-wide (18 pts higher); higher-poverty schools than district average — tighter screening recommended.
- Market conditions: 192 active listings in the ZIP; 4 comparable units currently listed for rent nearby; rentals at typical pace (median 15d on market — plan ~3-4 weeks tenant-placement turnaround); 9,195 units permitted in Riverside County in 2024 (1,512 in 5+ unit buildings).
Forward outlook
- Local home prices are declining (-3.0%/yr); year-one equity from $2k of loan paydown is wiped out by about $7k of value loss. Plan a longer hold.
- Riverside County population projected at +22% by 2050 — long-run rental-demand tailwind backs the buy-and-hold thesis.
Negotiation context
- It's been on market 55 days — a 3% lower offer ($213k) is reasonable based on typical stale-listing flexibility.
- 2 sale attempts with the ask held roughly flat each time — persistent listings suggest the price (not the market) is what's stuck; bring a comps-based counter.
Risks & watch-outs
- Climate carrying-cost: extreme-heat days projected 7→18/yr by 2055 (HVAC capex compounding) — expect insurance premiums to compound above CPI over the hold.
Questions for the listing agent
- What do current leases actually rent for vs. the listed asking? Can we see a recent rent roll and the last 12 months of T-12 income?
- It's been on market 55 days. Have you received any prior offers? Is the seller open to a 27% concession, seller financing, or rate buy-down credit?
- Built in 1965 — when were the roof, HVAC, electrical panel, plumbing, and water heater last replaced?
- Is there a deadline driving the sale (1031 exchange, divorce, estate, relocation)? That informs how much negotiation room exists.
- Schools are F-rated, which usually means shorter tenancies and higher turnover. Who's the typical renter profile here, and what's been the actual vacancy rate?
- The area grade is low — what's the realistic commute time and amenity access for the typical tenant pool here? Any planned neighborhood developments (good or bad) we should know about?
- What's the average days-on-market for RENTAL listings here right now (not sales)? A rising rental-DOM trend means longer vacancies and softer asking-rent achievability than the comps imply.
- What's the recent tenant-quality profile in this submarket — average credit score on applications, eviction rate, late-payment / NSF rate, and stable-employment percentage? A property-management company in the area should have these aggregated.
- How much new for-sale + rental construction is in the pipeline within 1–3 miles? Heavy new supply typically softens prices + rents 12–24 months out; constrained supply supports both.
Investment metrics
- 1% rule
- 0.73% ✗
- Cap rate
- 6.07%
- Cash-on-cash
- -0.80%
- DSCR
- 0.96
- GRM
- 11.4
CMA / ARV
- ARV (median comp)
- $255,652
- List price
- $220,000
- Delta
- -13.95%
- Verdict
- UNDERPRICED
- Comps
- 20 within 1.0 mi
Show comp detail 12 sales within ~0.75 mi
| Address | Dist | Beds/Ba | Sqft | Sold | Price | $/sf | Match |
|---|---|---|---|---|---|---|---|
| 430 N 8th St | 0.29mi | 4/2.0 (+1) | 1,405 (-3%) | 2mo | $210,000 | $149 | 74 |
| 660 N 9th St | 0.07mi | 3/2.0 | 1,282 (-12%) | 5mo | $245,000 | $191 | 74 |
| 449 N 7th | 0.33mi | 4/2.0 (+1) | 1,524 (+5%) | 6mo | $55,000 | $36 | 66 |
| 340 N 9th | 0.34mi | 4/2.0 (+1) | 1,571 (+8%) | 0mo | $241,000 | $153 | 65 |
| 158 Eunice Cir | 0.70mi | 3/2.0 | 1,426 (-2%) | 1mo | $290,000 | $203 | 64 |
| 391 N 9th St | 0.29mi | 4/2.0 (+1) | 1,571 (+8%) | 5mo | $240,000 | $153 | 63 |
| 361 N 9th St | 0.32mi | 3/2.0 | 1,276 (-12%) | 3mo | $225,000 | $176 | 62 |
| 431 N 9th | 0.24mi | 3/2.0 | 1,636 (+13%) | 6mo | $210,000 | $128 | 62 |
| 173 Eunice Cir | 0.73mi | 3/2.0 | 1,422 (-2%) | 5mo | $259,000 | $182 | 59 |
| 285 N Acacia Ave | 0.42mi | 2/1.0 (-1) | 1,338 (-8%) | 5mo | $172,000 | $129 | 55 |
| 951 E Avenue B | 0.46mi | 4/2.0 (+1) | 1,282 (-12%) | 5mo | $230,000 | $179 | 50 |
| 260 E Oasis St | 0.66mi | 3/2.0 | 1,290 (-11%) | 4mo | $245,000 | $190 | 48 |
Match score weights: distance 35% · size 25% · config 20% · recency 20%. Top-matched comps best support the ARV.
Projected returns pro-forma
-3.0% appreciation · 3.0% rent growth · sell at horizon
- IRR
- -17.7%
- Equity multiple
- 0.38×
- Total profit
- $-38,353
- Equity at exit
- $32,803
- IRR
- -9.9%
- Equity multiple
- 0.40×
- Total profit
- $-37,164
- Equity at exit
- $19,022
Cash invested: $61,600 (down + closing). Projections, not guarantees.
Landlord ↔ Tenant lean methodology
- Overall (STATE)
- 18 Strongly Tenant-Friendly
- State California
- 18 Strongly Tenant-Friendly · D+13
- County
- — inherits STATE
- City
- — inherits STATE
ZIP-level market 92225
- Home prices YoY
- -15.8%
- Active inventory
- 192
- Price-to-rent
- 11.4×
Monthly cashflow live
- Estimated rent
- $1,611 medium interval (Pro) →
- Mortgage (P&I)
- −$1,154
- Tax from tax record
- −$68 /mo · $819/yr
- Insurance
- −$92
- HOA
- −$0
- Vacancy / Maint / Mgmt
- −$338
- Net cashflow
- $-41
Break-even live
Sensitivity live
| Price | -10% $84 | -5% $21 | +0% $-41 | +5% $-103 | +10% $-165 |
|---|---|---|---|---|---|
| Rent | -10% $-168 | -5% $-104 | +0% $-41 | +5% $23 | +10% $86 |
| Rate | -1.0pp $70 | -0.5pp $15 | base $-41 | +0.5pp $-98 | +1.0pp $-156 |
UW: 25.0% down · 7.5% · 30yr · 1.5% tax · 5.0% vac · 8.0% maint · 8.0% mgmt
Financing live
Cash to close
- Down payment
- $55,000
- Closing costs
- $6,600
- Reserves months
- —
- Total cash needed
- —
Loan-product check · same deal, 3 products live
Conventional
25% down · 7.5% · 30yr
- Down + closing
- —
- Monthly P&I
- —
- Monthly cashflow
- —
- DSCR
- —
- Eligible?
- —
Personal DTI + credit; lowest rate.
DSCR
20% down · 8.5% · 30yr
- Down + closing
- —
- Monthly P&I
- —
- Monthly cashflow
- —
- DSCR
- —
- Eligible?
- —
No personal income docs; deal must DSCR.
Hard money
10% down · 12.0% · 12mo
- Down + closing
- —
- Monthly P&I
- —
- Monthly cashflow
- —
- DSCR
- —
- Eligible?
- —
Short-term bridge; refi at stabilization.
Rent comps 4 comps
| Address | Beds | Baths | Sqft | Rent | $/sqft | DOM | Units | Dist |
|---|---|---|---|---|---|---|---|---|
| 400 N Palm Dr Blythe, CA | 2.0–3.0 | 1.0–1.5 | 928 | $1,100 | $1.18 | 15d | 1 | 1.11mi |
| 450 W Barnard St Blythe, CA | 2.0–3.0 | 1.0–2.0 | 935 | $1,095 | $1.17 | 15d | 2 | 1.11mi |
| 460 River Valley Ave Blythe, CA | 3.0 | 2.0 | 1344 | $2,600 | $1.93 | 15d | 1 | 1.12mi |
| 551 S 3rd St Blythe, CA | 2.0–3.0 | 1.0–2.0 | 885 | $1,120 | $1.27 | 15d | 9 | 1.32mi |
Listing history 22 events
-
2026-06-22days on market $220,000 Active 55 DOM
-
2026-06-21days on market $220,000 Active 54 DOM
-
2026-06-19days on market $220,000 Active 52 DOM
-
2026-06-18days on market $220,000 Active 51 DOM
-
2026-06-17days on market $220,000 Active 50 DOM
-
2026-06-16days on market $220,000 Active 49 DOM
-
2026-06-15days on market $220,000 Active 48 DOM
-
2026-06-14days on market $220,000 Active 46 DOM
-
2026-06-12days on market $220,000 Active 45 DOM
-
2026-06-09days on market $220,000 Active 42 DOM
-
2026-06-08days on market $220,000 Active 41 DOM
-
2026-06-07days on market $220,000 Active 40 DOM
-
2026-06-07days on market $220,000 Active 39 DOM
-
2026-06-04days on market $220,000 Active 36 DOM
-
2026-06-02days on market $220,000 Active 35 DOM
-
2026-06-01days on market $220,000 Active 34 DOM
-
2026-05-31days on market $220,000 Active 33 DOM
-
2026-05-31days on market $220,000 Active 32 DOM
-
2026-04-28$220,000 Active 1153-char remark
-
2026-04-01historical
-
2026-02-05price $240,000
-
2025-06-18$250,000 Active
ⓘ Source: listings_history table (triggers on properties + properties_extension) + one-shot
backfill from property_details.listing_events for pre-trigger history.
Tax reassessment forecast CA · Resets to sale price
- Current annual tax
- $819 · $68/mo
- Projected year-2 tax
- $1,672 · $139/mo
- Expected delta
- +$853/yr (+$71/mo · 104.1%)
ⓘ Screening estimate from a state-policy table — verify with the county assessor before closing.
Climate risk First Street
- Flood 1/10 Low FEMA zone D · 0% chance over 30 yrs
- Wildfire 2/10 Low
- Heat 9/10 Extreme 7 d/yr ≥116°F today · 18 d/yr by 30 yrs out
- Wind 1/10 Low
- Air quality 2/10 Low 1 unhealthy d/yr today · 1 by 30 yrs out
Nearby sold comps map
Loading sold comps map…
Walkable amenities ~0.75 mi
Loading nearby amenities…
Taxation est. · year 1
- Rental income
- $19,333
- − Mortgage interest
- −$12,323
- − Property taxes
- −$819
- − Insurance
- −$1,100
- − Repairs & maintenance
- −$1,547
- − Management
- −$1,547
- − Depreciation
- −$6,400
- Taxable loss
- −$4,402
- Est. tax savings @ 24.0%
- +$1,057
- After-tax cash flow
- $567/yr
For passive investors: Depreciation is non-cash, so a rental often shows a tax loss while cash-flowing — sheltering income. Rental losses are passive: they offset passive income freely, and up to $25,000/yr can offset ordinary (W-2) income if you actively participate and your MAGI is under $100k (phasing out to $0 by $150k); unused losses carry forward. On sale, claimed depreciation is recaptured at up to 25%, and gains may owe capital-gains tax (a 1031 exchange can defer both). Figures are a year-1 estimate at your 24.0% rate — not tax advice; consult a CPA.
Schools (NCES district)
- District
- Palo Verde Unified
- NCES district ID
- 0629640
- Math proficiency
- 20% ▲ 3.00%
- Reading proficiency
- 34% ▲ 5.00%
- Median HH income
- $40,808
- Composite
- 25.77/100
- National rank
- #12796
- State rank
- #1133 of 1400 in CA
Livability — Blythe
- Score
- 74/100
- State rank
- #143
- US rank
- #4910
Category grades
Schools grade is shown separately in the Schools card above.
Census & demographics
- Census place
- Blythe, CA
- Population (ZIP)
- 21,101
Population outlook (Riverside County) Hauer SSP2
- Today (2025)
- 2,664,475 people
- By 2030
- 2,802,692 · +5.2%
- By 2040
- 3,050,904 · +14.5%
- By 2050
- 3,256,783 · +22.2%
- By 2075
- 3,655,058 · +37.2%
- By 2100
- 3,766,594 · +41.4%
Race, ethnicity, and origin ACS 2023
- Neighborhood character
- Diverse neighborhood (Simpson 0.58)
- Race & ethnicity
- Hispanic / Latino 59% White 26% Two or more races 13% Black 10% Asian 2% Native American 2%
- Hispanic origin (detail)
- Mexican 54%
- Common ancestry
- Lithuanian 1% Romanian 1% Iranian 1%
- Foreign-born
- 18% · Canada
- Languages at home
- 55% English-only · Spanish 42% Other Indo-European 1% Tagalog/Filipino 0%
Political lean MEDSL · Riverside
- 2024 margin
- Toss-up / Even · D 48.0% · R 49.3% · Other 2.6%
- 2008→2024 swing
- -3.6pp toward R · 2008: 2.3pp · 2024: -1.3pp
- All cycles
- 2024: R+1.3 2020: D+8.0 2016: D+4.3 2012: R+0.4 2008: D+2.3
Not yet ingested
- Civics
- —
Market trends
- HPI YoY
- ▼ -40.53%
- Current HPI
- 215.4794
- Rent YoY
- —
- Metro
- —
- State GDP YoY
- ▲ 3.21%
- F500 in state
- 116
Industry mix (Fortune 500 HQ in CA)
| Industry | F500 HQs | Revenue |
|---|---|---|
| Technology | 27 | $1,492B |
|
||
| Financial Services | 3 | $174B |
|
||
| Retail | 3 | $44B |
|
||
| Insurance | 3 | $26B |
|
||
| Media / Entertainment | 2 | $115B |
|
||
| Pharmaceuticals / Biotech | 2 | $62B |
|
||
Price history
-12.0% since first listed4 events — show timeline
- 2026-04-28 Listed $220,000 CRMLS
- 2026-04-01 Listing Removed — CRMLS
- 2026-02-05 Price Changed $240,000 CRMLS
- 2025-06-18 Listed $250,000 CRMLS
Property tax history
+1.9%/yrLatest (2025): $819 · -0.7% YoY. Source: county tax records.
Cash-flow waterfall
monthlySold comps — $/sqft
last 12 mo · ≤1 miLoading sold comps…