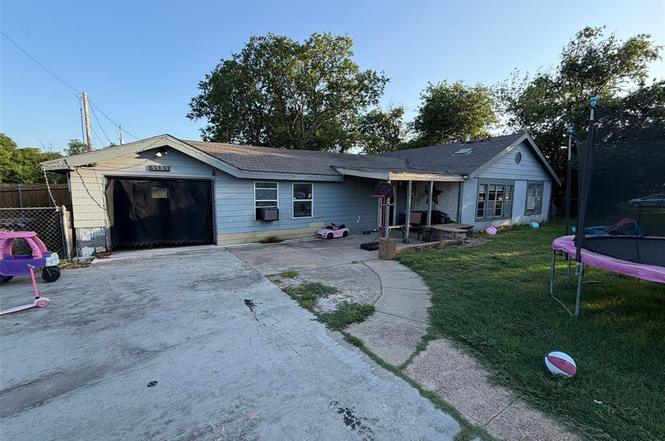
5505 Urbanview St · Sansom Park, TX
Flood risk 1/10 · Minimal
- FEMA flood zone
- X (unshaded)
- Chance of flooding over 30 yrs
- 0.0%
- Est. flood insurance / yr
- $507 – $1,088
Fire risk 4/10 · Minor
- Est. fire insurance / yr
- $1,222 – $2,270
Heat risk 7/10 · Major
- Hot days now (above 109°F)
- 7 days/yr
- Hot days in 30 yrs
- 23 days/yr
Wind risk 4/10 · Minor
- Chance of severe wind over 30 yrs
- 24.0%
Air-quality risk 3/10 · Minor
- Unhealthy air days now
- 3 days/yr
- Unhealthy air days in 30 yrs
- 4 days/yr
Risk factors via First Street. Map © Google.
Why this score? — see what drove the C+ grade
The composite is a weighted blend of 9 inputs, each scored 0–100. Each bar is that input's sub-score; the figure is the points it added to the 100-point composite (weight × sub-score).
- Cash flow +26.3/30.0
- 1% rule +9.5/10.0
- DSCR +8.9/10.0
- ARV discount +7.5/15.0
- Livability +3.5/5.0
- Rent growth +3.0/5.0
- Condition / age +2.5/5.0
- Schools +2.2/10.0
- Appreciation +0.0/10.0
$99,000
🖨 Deal sheet 📄 Offer letter ✓ Due diligence
Listing remarks
Investor Special - Great opportunity to bring this property back to life! Perfect for investors, flippers, or landlords looking for their next project. Property is being sold AS-IS.
Key facts
- 0.51 acre lot
- Garage
- Built 1940
Property features AI
Finance
- Financial info: Treat as clear loan type; No second mortgage indicated
- HOA & community: No homeowners association
Exterior
- Parking: Driveway; Garage; Covered parking (1 covered space); Attached garage (1 garage space)
- Utilities: City water; City sewer; Not in a municipal utility district
- Home design: Single-family residence; Residential property; One story
- Construction: Built in 1940
- Exterior features: Approximately 0.505-acre lot (.5 to < 1 acre); Subdivision: Sansom Park Add; GPS directions available
Interior
- Kitchen: Other appliances
- Bedrooms: Three bedrooms (all on the main level, including a primary bedroom on the main level)
- Bathrooms: One full bathroom; One half bathroom
- Interior features: Five total rooms; One living area; One dining area; One-level layout; Other interior features
- Laundry & utility: No specific laundry/utility details provided
Neighborhood map
What this means for you Summary
Snapshot
- This is a 2-bed/1.0-bath single-family listed at $99k.
Deal economics
- At list price, monthly cash flow is $256 ($3k/yr) — positive.
- The deal already cash-flows at list — no discount required.
- Meets the 1% rule at list price ($1k rent vs $99k).
Location & tenants
- Location reads 69/100 on livability (#403 in TX) — a middle-class / working-renter tenant base. Strengths: cost of living A+, housing A+, health & safety A+; Watch: employment C-, crime D, amenities F.
- Castleberry ISD (suburban): math 21% / reading 32% proficiency, ranked #701 of 826 in TX (top 85%) — low school quality limits family demand, transient renter base, plan for 1-2y turnover; 72% free/reduced lunch — lower-income household profile, screen leases tightly.
- Zoned schools: Castleberry El (math 17% / reading 26%, grade F, #3,470 of 4,322 statewide, top 81%, 747 students, 88% FRL) — zoned schools average 88% FRL vs 72% district-wide (15 pts higher); higher-poverty schools than district average — tighter screening recommended.
- Market conditions: Rents rising (+1.9%/yr); 153 active listings in the ZIP; 22 comparable units currently listed for rent nearby; rentals lingering (median 44d on market — plan ~5-8 weeks vacancy on turnover, expect pricing pressure); 50% of comp listings sitting > 30 days — soft ceiling on asking rent; 18,938 units permitted in Tarrant County in 2024 (8,336 in 5+ unit buildings).
Forward outlook
- Local home prices are declining (-3.0%/yr); year-one equity from $684 of loan paydown is wiped out by about $3k of value loss. Plan a longer hold.
- Tarrant County population projected at +41% by 2050 — long-run rental-demand tailwind backs the buy-and-hold thesis.
Negotiation context
- Only 3 days on market — expect competitive offers; lowballing is unlikely to land.
- 2 sale attempts with the ask held roughly flat each time — persistent listings suggest the price (not the market) is what's stuck; bring a comps-based counter.
Risks & watch-outs
- Watch-outs: property tax is 3.8% of price; built in 1940 — expect roof / HVAC / electrical / plumbing capex.
- Climate carrying-cost: extreme-heat days projected 7→23/yr by 2055 (HVAC capex compounding) — expect insurance premiums to compound above CPI over the hold.
Questions for the listing agent
- Built in 1940 — when were the roof, HVAC, electrical panel, plumbing, and water heater last replaced?
- Property tax is high relative to price — has the assessment been appealed recently, and will the sale trigger a re-assessment?
- Is there a deadline driving the sale (1031 exchange, divorce, estate, relocation)? That informs how much negotiation room exists.
- Schools are F-rated, which usually means shorter tenancies and higher turnover. Who's the typical renter profile here, and what's been the actual vacancy rate?
- Crime grade is D in this area — have there been break-ins, vandalism, or insurance claims at this property in the last 3 years? What carrier currently insures it and at what premium?
- What's the average days-on-market for RENTAL listings here right now (not sales)? A rising rental-DOM trend means longer vacancies and softer asking-rent achievability than the comps imply.
- What's the recent tenant-quality profile in this submarket — average credit score on applications, eviction rate, late-payment / NSF rate, and stable-employment percentage? A property-management company in the area should have these aggregated.
- How much new for-sale + rental construction is in the pipeline within 1–3 miles? Heavy new supply typically softens prices + rents 12–24 months out; constrained supply supports both.
Investment metrics
- 1% rule
- 1.45% ✓
- Cap rate
- 9.40%
- Cash-on-cash
- 11.10%
- DSCR
- 1.49
- GRM
- 5.8
CMA / ARV
- ARV (on-the-fly)
- $233,320
- Comps found
- 12
Show comp detail 12 sales within ~0.75 mi
| Address | Dist | Beds/Ba | Sqft | Sold | Price | $/sf | Match |
|---|---|---|---|---|---|---|---|
| 5615 Landino St | 0.17mi | 2/1.0 | 1,160 (-6%) | 5mo | $175,000 | $151 | 79 |
| 2614 Biway St | 0.08mi | 3/1.5 (+1) | 1,182 (-4%) | 14mo | $289,000 | $245 | 72 |
| 5813 Terrace Trl | 0.34mi | 2/1.0 | 1,158 (-6%) | 8mo | $180,000 | $155 | 67 |
| 5615 Calloway St | 0.32mi | 3/2.0 (+1) | 1,184 (-4%) | 6mo | $237,000 | $200 | 65 |
| 5209 Crowley St | 0.40mi | 3/1.0 (+1) | 1,199 (-2%) | 10mo | $175,000 | $146 | 64 |
| 4812 Flagstone Dr | 0.66mi | 3/1.0 (+1) | 1,224 (-0%) | 3mo | $190,000 | $155 | 62 |
| 5512 Crowley St | 0.37mi | 3/2.0 (+1) | 1,312 (+7%) | 1mo | $269,000 | $205 | 61 |
| 2404 Skyline Dr | 0.33mi | 3/2.0 (+1) | 1,352 (+10%) | 2mo | $269,000 | $199 | 57 |
| 2421 Arrow Ln | 0.54mi | 2/2.0 | 1,104 (-10%) | 4mo | $250,000 | $226 | 51 |
| 5712 Calloway St | 0.40mi | 3/2.0 (+1) | 1,386 (+13%) | 2mo | $217,000 | $157 | 49 |
| 2121 Andover St | 0.61mi | 3/2.0 (+1) | 1,304 (+6%) | 6mo | $239,900 | $184 | 47 |
| 2100 Castleberry Cut Off Rd | 0.71mi | 2/2.0 | 1,183 (-4%) | 13mo | $225,000 | $190 | 46 |
Match score weights: distance 35% · size 25% · config 20% · recency 20%. Top-matched comps best support the ARV.
Projected returns pro-forma
-3.0% appreciation · 1.88% rent growth · sell at horizon
- IRR
- -1.1%
- Equity multiple
- 0.96×
- Total profit
- $-1,167
- Equity at exit
- $14,761
- IRR
- 7.2%
- Equity multiple
- 1.51×
- Total profit
- $14,176
- Equity at exit
- $8,560
Cash invested: $27,720 (down + closing). Projections, not guarantees.
Landlord ↔ Tenant lean methodology
- Overall (STATE)
- 87 Strongly Landlord-Friendly
- State Texas
- 87 Strongly Landlord-Friendly · R+5
- County
- — inherits STATE
- City
- — inherits STATE
ZIP-level market 76114
- Home prices YoY
- -24.3%
- Rents YoY
- 1.9%
- Active inventory
- 153
- Price-to-rent
- 5.8×
Monthly cashflow live
- Estimated rent
- $1,432 high interval (Pro) →
- Mortgage (P&I)
- −$519
- Tax from tax record
- −$314 /mo · $3,769/yr
- Insurance
- −$41
- HOA
- −$0
- Vacancy / Maint / Mgmt
- −$301
- Net cashflow
- $256
Break-even live
UW: 25.0% down · 7.5% · 30yr · 1.5% tax · 5.0% vac · 8.0% maint · 8.0% mgmt
Financing live
Cash to close
- Down payment
- $24,750
- Closing costs
- $2,970
- Reserves months
- —
- Total cash needed
- —
Loan-product check · same deal, 3 products live
Conventional
25% down · 7.5% · 30yr
- Down + closing
- —
- Monthly P&I
- —
- Monthly cashflow
- —
- DSCR
- —
- Eligible?
- —
Personal DTI + credit; lowest rate.
DSCR
20% down · 8.5% · 30yr
- Down + closing
- —
- Monthly P&I
- —
- Monthly cashflow
- —
- DSCR
- —
- Eligible?
- —
No personal income docs; deal must DSCR.
Hard money
10% down · 12.0% · 12mo
- Down + closing
- —
- Monthly P&I
- —
- Monthly cashflow
- —
- DSCR
- —
- Eligible?
- —
Short-term bridge; refi at stabilization.
Rent comps 22 comps
| Address | Beds | Baths | Sqft | Rent | $/sqft | DOM | Units | Dist |
|---|---|---|---|---|---|---|---|---|
| 5217 Calloway St Fort Worth, TX | 3.0 | 2.0 | 964 | $1,375 | $1.43 | 43d | 1 | 0.33mi |
| 5217 Calloway St Unit B Fort Worth, TX | 3.0 | 2.0 | 964 | $1,275 | $1.32 | 43d | 1 | 0.33mi |
| 5217 Calloway St Unit B Fort Worth, TX | 3.0 | 2.0 | 964 | $1,275 | $1.32 | 24d | 1 | 0.33mi |
| 5205 Calloway St Fort Worth, TX | 2.0 | 1.0 | 872 | $1,495 | $1.71 | 43d | 1 | 0.35mi |
| 2762 Beverly Hills Dr Fort Worth, TX | 2.0 | 1.0 | 720 | $1,600 | $2.22 | 24d | 1 | 0.40mi |
| 5201 Azle Ave Unit 01 Fort Worth, TX | 2.0 | 2.0 | 868 | $1,250 | $1.44 | 43d | 1 | 0.59mi |
| 5833 Cowden St Fort Worth, TX | 1.0 | 1.0 | 700 | $1,200 | $1.71 | 43d | 1 | 0.61mi |
| 3000 Comanche Ave Unit B Fort Worth, TX | 3.0 | 2.0 | 1200 | $1,450 | $1.21 | 43d | 1 | 0.61mi |
| 5600 Azle Ave Fort Worth, TX | 1.0–2.0 | 1.0–2.0 | 935 | $1,362 | $1.46 | 20d | 7 | 0.70mi |
| 3665 Marine Creek Pkwy Fort Worth, TX | 1.0–2.0 | 1.0–2.0 | 896 | $1,770 | $1.98 | 1d | 36 | 0.81mi |
| 5712 Azle Ave Unit 5745 Fort Worth, TX | 3.0 | 2.0 | 1246 | $1,453 | $1.17 | 43d | 1 | 0.81mi |
| 5712 Azle Ave Unit 2121 Fort Worth, TX | 2.0 | 2.0 | 963 | $1,229 | $1.28 | 2d | 1 | 0.81mi |
| 5712 Azle Ave Unit 3121 Fort Worth, TX | 3.0 | 2.0 | 1246 | $1,410 | $1.13 | 2d | 1 | 0.81mi |
| 5712 Azle Ave Unit 5769 Fort Worth, TX | 2.0 | 2.0 | 963 | $1,262 | $1.31 | 43d | 1 | 0.81mi |
| 1916 Roberts Cut Off Rd Fort Worth, TX | 1.0 | 1.0 | 700 | $895 | $1.28 | 43d | 1 | 0.87mi |
| 5000 Montrose Dr Fort Worth, TX | 3.0 | 2.0 | 1230 | $1,875 | $1.52 | 43d | 1 | 0.96mi |
| 6303 Shady Oaks Manor Dr Fort Worth, TX | 3.0 | 1.0–2.0 | 931 | $1,347 | $1.45 | 2d | 44 | 1.13mi |
| 2701 NW 18th St #2 Fort Worth, TX | 3.0 | 1.5 | 800 | $1,345 | $1.68 | 7d | 1 | 1.18mi |
| 1501 Greenbrier Dr Fort Worth, TX | 3.0 | 2.0 | 1332 | $1,900 | $1.43 | 2d | 1 | 1.28mi |
| 2600 NW 21st St Fort Worth, TX | 2.0 | 1.0 | 1449 | $1,275 | $0.88 | 24d | 1 | 1.36mi |
| 6555 Shady Oaks Manor Dr Fort Worth, TX | 1.0–2.0 | 1.0–2.0 | 689 | $1,401 | $2.03 | 3d | 18 | 1.43mi |
| 2327 Wagner Ave Fort Worth, TX | 2.0 | 1.0 | 725 | $1,050 | $1.45 | 43d | 1 | 1.49mi |
Listing history 4 events
-
2026-06-18days on market $99,000 Active 3 DOM
-
2026-06-17days on market $99,000 Active 2 DOM
-
2026-06-15remarks 181-char remark
-
2026-06-15$99,000 Active 1 DOM
ⓘ Source: listings_history table (triggers on properties + properties_extension) + one-shot
backfill from property_details.listing_events for pre-trigger history.
Tax reassessment forecast TX · Resets to sale price
- Current annual tax
- $3,769 · $314/mo
- Projected year-2 tax
- $3,769 · $314/mo
- Expected delta
- $0/yr ($0/mo · -0.0%)
ⓘ Screening estimate from a state-policy table — verify with the county assessor before closing.
Climate risk First Street
- Flood 1/10 Low FEMA zone X (unshaded) · 0% chance over 30 yrs
- Wildfire 4/10 Moderate
- Heat 7/10 Severe 7 d/yr ≥109°F today · 23 d/yr by 30 yrs out
- Wind 4/10 Moderate 24% chance of damaging wind over 30 yrs
- Air quality 3/10 Moderate 3 unhealthy d/yr today · 4 by 30 yrs out
Nearby sold comps map
Loading sold comps map…
Walkable amenities ~0.75 mi
Loading nearby amenities…
Taxation est. · year 1
- Rental income
- $17,179
- − Mortgage interest
- −$5,546
- − Property taxes
- −$3,769
- − Insurance
- −$495
- − Repairs & maintenance
- −$1,374
- − Management
- −$1,374
- − Depreciation
- −$2,880
- Taxable income
- $1,741
- Est. tax owed @ 24.0%
- −$418
- After-tax cash flow
- $2,659/yr
For passive investors: Depreciation is non-cash, so a rental often shows a tax loss while cash-flowing — sheltering income. Rental losses are passive: they offset passive income freely, and up to $25,000/yr can offset ordinary (W-2) income if you actively participate and your MAGI is under $100k (phasing out to $0 by $150k); unused losses carry forward. On sale, claimed depreciation is recaptured at up to 25%, and gains may owe capital-gains tax (a 1031 exchange can defer both). Figures are a year-1 estimate at your 24.0% rate — not tax advice; consult a CPA.
Schools (NCES district)
- District
- Castleberry ISD
- NCES district ID
- 4813170
- Math proficiency
- 21% ▼ -17.00%
- Reading proficiency
- 32% ▼ -5.00%
- Median HH income
- $39,060
- Composite
- 22.22/100
- National rank
- #8152
- State rank
- #701 of 826 in TX
Livability — Sansom Park
- Score
- 69/100
- State rank
- #403
- US rank
- #8368
Category grades
Schools grade is shown separately in the Schools card above.
Census & demographics
- Census place
- Sansom Park, TX
- County
- Tarrant County · 2,033,669 people
- Metro
- Dallas-Fort Worth-Arlington, TX
- Population (ZIP)
- 27,357
- Household income
- $62,073
- Rent vs Own
- Severe rent burden
- 1095.0
Population outlook (Tarrant County) Hauer SSP2
- Today (2025)
- 2,380,417 people
- By 2030
- 2,578,900 · +8.3%
- By 2040
- 2,974,995 · +25.0%
- By 2050
- 3,350,489 · +40.8%
- By 2075
- 4,216,909 · +77.2%
- By 2100
- 4,741,527 · +99.2%
Race, ethnicity, and origin ACS 2023
- Neighborhood character
- Majority Hispanic (61%)
- Race & ethnicity
- Hispanic / Latino 61% White 35% Two or more races 20% Native American 3% Black 2%
- Hispanic origin (detail)
- Mexican 56%
- Common ancestry
- Slovak 2% Italian 1% Serbian 1%
- Foreign-born
- 17% · Canada
- Languages at home
- 54% English-only · Spanish 45%
Political lean MEDSL · Tarrant
- 2024 margin
- Lean R (+5.1) · D 46.7% · R 51.9% · Other 1.4%
- 2008→2024 swing
- +6.6pp toward D · 2008: -11.7pp · 2024: -5.1pp
- All cycles
- 2024: R+5.1 2020: D+0.2 2016: R+8.7 2012: R+15.7 2008: R+11.7
Not yet ingested
- Civics
- —
Market trends
- HPI YoY
- ▼ -117.88%
- Current HPI
- 366.5263
- Rent YoY
- ▲ 1.88%
- Metro
- Dallas-Fort Worth-Arlington, TX
- State GDP YoY
- ▲ 3.95%
- F500 in state
- 110
Industry mix (Fortune 500 HQ in TX)
| Industry | F500 HQs | Revenue |
|---|---|---|
| Energy | 16 | $1,198B |
|
||
| Technology | 5 | $198B |
|
||
| Engineering / Construction | 4 | $72B |
|
||
| Energy Services | 3 | $60B |
|
||
| Utilities | 3 | $41B |
|
||
| Healthcare | 2 | $330B |
|
||
Price history
-23.3% since first listed7 events — show timeline
- 2026-06-15 Listed $99,000 NTREIS
- 2025-12-04 Listing Removed — NTREIS
- 2025-08-11 Price Changed $119,000 NTREIS
- 2025-08-05 Listed $129,000 NTREIS
- 2025-07-22 Sold (Public Records) — Public Records
- 2015-08-12 Sold (Public Records) — Public Records
- 1990-11-03 Sold (Public Records) — Public Records
Property tax history
+7.3%/yrLatest (2025): $3,769 · -16.3% YoY. Source: county tax records.
Cash-flow waterfall
monthlySold comps — $/sqft
last 12 mo · ≤1 miLoading sold comps…