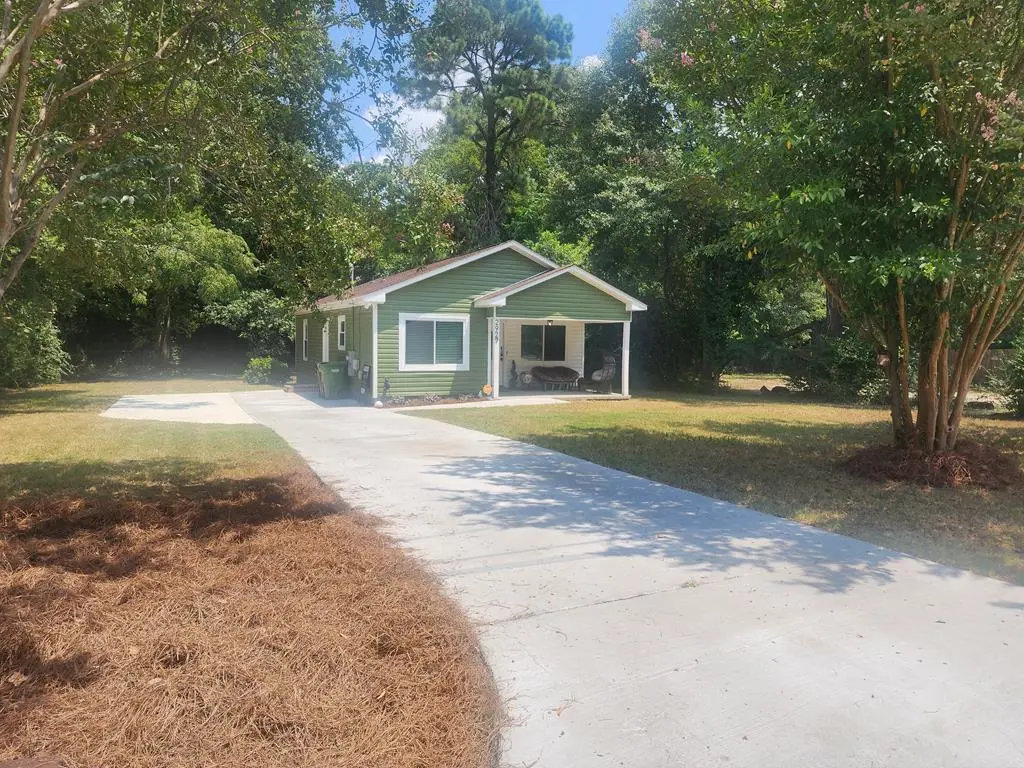
2927 Clover Ln · Columbus, GA
Flood risk 1/10 · Minimal
- FEMA flood zone
- X (unshaded)
- Chance of flooding over 30 yrs
- 0.0%
- Est. flood insurance / yr
- $507 – $1,088
Fire risk 3/10 · Minor
- Est. fire insurance / yr
- $963 – $1,789
Heat risk 7/10 · Major
- Hot days now (above 107°F)
- 7 days/yr
- Hot days in 30 yrs
- 18 days/yr
Wind risk 6/10 · Moderate
- Chance of severe wind over 30 yrs
- 69.0%
Air-quality risk 4/10 · Minor
- Unhealthy air days now
- 4 days/yr
- Unhealthy air days in 30 yrs
- 5 days/yr
Risk factors via First Street. Map © Google.
Why this score? — see what drove the C- grade
The composite is a weighted blend of 9 inputs, each scored 0–100. Each bar is that input's sub-score; the figure is the points it added to the 100-point composite (weight × sub-score).
- Cash flow +21.4/30.0
- ARV discount +7.5/15.0
- DSCR +6.8/10.0
- 1% rule +4.5/10.0
- Livability +3.2/5.0
- Rent growth +3.0/5.0
- Condition / age +2.5/5.0
- Schools +2.2/10.0
- Appreciation +0.0/10.0
$110,000
🖨 Deal sheet (PDF) 📄 Offer letter ✓ Due diligence
Listing remarks
Welcome Home to this cozy renovated 3-bedroom, 1.5-bathroom home, offering modern amenities and chic finishes. Walls are painted to accentuate the beautiful floors. The kitchen features updated appliances, ideal for daily dining and hosting. Enjoy the privacy of the backyard and the convenience of a storage room for outdoors gathering. Situated close to shopping centers and restaurants and just 15 minutes away from Fort Benning. Don't miss the opportunity to make this dream home yours!
Key facts
- Updated appliances
- Storage room
- Close to restaurants
Tags
Property features AI
Exterior
- Utilities: Public water; Public sewer
- Home design: Single-family residence; Residential property
- Construction: Vinyl siding
- Exterior features: Fenced yard
Interior
- Kitchen: Electric range; Microwave
- Flooring: Carpet
- Bathrooms: 1 full bathroom; 1 half bathroom
- Heating & cooling: Electric heating; Central cooling with ceiling fan(s)
- Interior features: Ceiling fan(s)
Neighborhood map
What this means for you Summary
Snapshot
- This is a 3-bed/1.5-bath single-family listed at $110k.
Deal economics
- At list price, monthly cash flow is $163 ($2k/yr) — positive.
- The deal already cash-flows at list — no discount required.
- To meet the 1% rule (rent ≥ 1% of price), the offer needs to be $105k (4.8% below list).
- Recommended offer: $105k (4.8% below list) — sets the bar for 1% rule.
- Cap rate 8.1% vs local median 4.7% in Columbus — top-decile yield for the area; either an underpriced asset or a hidden risk that comps aren't pricing in. Stress-test before assuming the spread holds.
Location & tenants
- Location reads 64/100 on livability (#254 in GA) — a middle-class / working-renter tenant base. Strengths: cost of living A+, housing A+, health & safety B; Watch: amenities D+, crime F, commute F.
- Muscogee County (urban): math 21% / reading 30% proficiency, ranked #120 of 174 in GA (top 69%) — low school quality limits family demand, transient renter base, plan for 1-2y turnover; 61% free/reduced lunch — lower-income household profile, screen leases tightly.
- Zoned schools: Martin Luther King- Jr. Elementary School (math 8% / reading 8%, grade F, #1,125 of 1,228 statewide, top 93%, 456 students, 96% FRL); Baker Middle School (math 2% / reading 9%, grade F, #461 of 470 statewide, top 98%, 588 students, 97% FRL); Carver High School (math 10% / reading 75%, grade F, #51 of 424 statewide, top 12%, 916 students, 97% FRL) — zoned schools average 97% FRL vs 61% district-wide (36 pts higher); higher-poverty schools than district average — tighter screening recommended.
- Market conditions: Rents rising (+1.8%/yr); 105 active listings in the ZIP; 21 comparable units currently listed for rent nearby; rentals at typical pace (median 23d on market — plan ~3-4 weeks tenant-placement turnaround); lower-income renter base — watch delinquency; 291 units permitted in Muscogee County in 2024 (30 in 5+ unit buildings).
- This rent runs 39% of the median local income ($32k/yr) — at the standard rent-burdened threshold; future hikes will face affordability resistance.
Forward outlook
- Local home prices are declining (-3.0%/yr); year-one equity from $761 of loan paydown is wiped out by about $3k of value loss. Plan a longer hold.
- Muscogee County population projected at +15% by 2050 — modest demand growth; plan on rents tracking national, not racing it.
Negotiation context
- Only 9 days on market — expect competitive offers; lowballing is unlikely to land.
- 5 sale attempts since 3y ago with the ask held roughly flat each time — persistent listings suggest the price (not the market) is what's stuck; bring a comps-based counter.
- Current owner paid $65k; list at $110k implies a 69% gain — meaningful room to come down on a strong offer.
Risks & watch-outs
- Climate carrying-cost: major wind risk, 69% chance of damaging wind over 30y; extreme-heat days projected 7→18/yr by 2055 (HVAC capex compounding) — expect insurance premiums to compound above CPI over the hold.
Questions for the listing agent
- Is there a deadline driving the sale (1031 exchange, divorce, estate, relocation)? That informs how much negotiation room exists.
- Schools are F-rated, which usually means shorter tenancies and higher turnover. Who's the typical renter profile here, and what's been the actual vacancy rate?
- Crime grade is F in this area — have there been break-ins, vandalism, or insurance claims at this property in the last 3 years? What carrier currently insures it and at what premium?
- What's the average days-on-market for RENTAL listings here right now (not sales)? A rising rental-DOM trend means longer vacancies and softer asking-rent achievability than the comps imply.
- What's the recent tenant-quality profile in this submarket — average credit score on applications, eviction rate, late-payment / NSF rate, and stable-employment percentage? A property-management company in the area should have these aggregated.
- How much new for-sale + rental construction is in the pipeline within 1–3 miles? Heavy new supply typically softens prices + rents 12–24 months out; constrained supply supports both.
Investment metrics
- 1% rule
- 0.95% ✗
- Cap rate
- 8.07%
- Cash-on-cash
- 6.36%
- DSCR
- 1.28
- GRM
- 8.7
CMA / ARV
- ARV (median comp)
- $42,492
- List price
- $110,000
- Delta
- 158.87%
- Verdict
- OVERPRICED
- Comps
- 20 within 1.0 mi
Show comp detail 12 sales within ~0.75 mi
| Address | Dist | Beds/Ba | Sqft | Sold | Price | $/sf | Match |
|---|---|---|---|---|---|---|---|
| 400 29th Ave Lot 23 | 0.11mi | 3/2.0 | 1,024 (-2%) | 11mo | $17,000 | $17 | 80 |
| 270 32nd Ave | 0.42mi | 2/1.0 (-1) | 1,053 (+0%) | 3mo | $19,900 | $19 | 70 |
| 2916 Lee St | 0.38mi | 2/1.0 (-1) | 1,021 (-3%) | 2mo | $42,000 | $41 | 70 |
| 2517 Garden Dr | 0.36mi | 2/— (-1) | 1,004 (-4%) | 3mo | $38,000 | $38 | 69 |
| 481 N Harold St | 0.23mi | 2/1.0 (-1) | 960 (-8%) | 2mo | $50,000 | $52 | 67 |
| 427 Bernard Dr | 0.26mi | 2/1.0 (-1) | 981 (-6%) | 9mo | $65,500 | $67 | 63 |
| 345 29th Ave | 0.17mi | 2/1.0 (-1) | 944 (-10%) | 9mo | $39,500 | $42 | 61 |
| 716 Benning Dr | 0.70mi | 2/1.5 (-1) | 1,056 (+1%) | 4mo | $53,300 | $50 | 58 |
| 2713 Dawson St | 0.25mi | 2/1.0 (-1) | 918 (-12%) | 6mo | $22,142 | $24 | 56 |
| 184 30th Ave | 0.53mi | 3/1.0 | 961 (-8%) | 8mo | $105,000 | $109 | 53 |
| 750 Winston Dr | 0.71mi | 3/1.5 | 1,123 (+7%) | 8mo | $64,000 | $57 | 48 |
| 810 Winston Rd | 0.74mi | 2/1.0 (-1) | 1,008 (-4%) | 5mo | $7,500 | $7 | 48 |
Match score weights: distance 35% · size 25% · config 20% · recency 20%. Top-matched comps best support the ARV.
Projected returns pro-forma
-3.0% appreciation · 1.82% rent growth · sell at horizon
- IRR
- -7.8%
- Equity multiple
- 0.72×
- Total profit
- $-8,707
- Equity at exit
- $16,401
- IRR
- 0.3%
- Equity multiple
- 1.02×
- Total profit
- $696
- Equity at exit
- $9,511
Cash invested: $30,800 (down + closing). Projections, not guarantees.
Landlord ↔ Tenant lean methodology
- Overall (STATE)
- 90 Strongly Landlord-Friendly
- State Georgia
- 90 Strongly Landlord-Friendly · R+3
- County
- — inherits STATE
- City
- — inherits STATE
ZIP-level market 31903
- Home prices YoY
- -14.5%
- Rents YoY
- 1.8%
- Active inventory
- 105
- Price-to-rent
- 8.7×
Monthly cashflow live
- Estimated rent
- $1,048 high interval (Pro) →
- Mortgage (P&I)
- −$577
- Tax from tax record
- −$42 /mo · $502/yr
- Insurance
- −$46
- HOA
- −$0
- Vacancy / Maint / Mgmt
- −$220
- Net cashflow
- $163
Break-even live
Sensitivity live
| Price | -10% $225 | -5% $194 | +0% $163 | +5% $132 | +10% $101 |
|---|---|---|---|---|---|
| Rent | -10% $80 | -5% $122 | +0% $163 | +5% $205 | +10% $246 |
| Rate | -1.0pp $219 | -0.5pp $191 | base $163 | +0.5pp $135 | +1.0pp $106 |
UW: 25.0% down · 7.5% · 30yr · 1.5% tax · 5.0% vac · 8.0% maint · 8.0% mgmt
Financing live
Cash to close
- Down payment
- $27,500
- Closing costs
- $3,300
- Reserves months
- —
- Total cash needed
- —
Loan-product check · same deal, 3 products live
Conventional
25% down · 7.5% · 30yr
- Down + closing
- —
- Monthly P&I
- —
- Monthly cashflow
- —
- DSCR
- —
- Eligible?
- —
Personal DTI + credit; lowest rate.
DSCR
20% down · 8.5% · 30yr
- Down + closing
- —
- Monthly P&I
- —
- Monthly cashflow
- —
- DSCR
- —
- Eligible?
- —
No personal income docs; deal must DSCR.
Hard money
10% down · 12.0% · 12mo
- Down + closing
- —
- Monthly P&I
- —
- Monthly cashflow
- —
- DSCR
- —
- Eligible?
- —
Short-term bridge; refi at stabilization.
Rent comps 21 comps
| Address | Beds | Baths | Sqft | Rent | $/sqft | DOM | Units | Dist |
|---|---|---|---|---|---|---|---|---|
| 2630 Garden Dr Columbus, GA | 2.0 | 1.0 | 1008 | $755 | $0.75 | 45d | 1 | 0.24mi |
| 2823 Lee St Columbus, GA | 4.0 | 2.0 | 1328 | $1,500 | $1.13 | 23d | 1 | 0.31mi |
| 2602 Garden Dr Columbus, GA | 3.0 | 2.0 | 1250 | $1,175 | $0.94 | 23d | 1 | 0.31mi |
| 3213 Lee St Unit 3 Columbus, GA | 2.0 | 1.0 | 1100 | $925 | $0.84 | 15d | 1 | 0.39mi |
| 3320 N Lumpkin Rd Columbus, GA | 2.0–3.0 | 2.0 | 1098 | $1,099 | $1.00 | 15d | 8 | 0.67mi |
| 564 Chesterfield Ave Columbus, GA | 3.0 | 2.0 | 1230 | $1,100 | $0.89 | 23d | 1 | 0.79mi |
| 2983 Buena Vista Rd Columbus, GA | 2.0 | 1.0 | 920 | $735 | $0.80 | 45d | 1 | 0.80mi |
| 3390 N Lumpkin Rd Columbus, GA | 2.0–3.0 | 2.0 | 1073 | $1,099 | $1.02 | 15d | 14 | 0.89mi |
| 1048 Brooks Rd Columbus, GA | 2.0 | 1.0 | 942 | $925 | $0.98 | 23d | 1 | 0.98mi |
| 2201 Heard St Columbus, GA | 2.0 | 1.0 | 1005 | $975 | $0.97 | 23d | 1 | 1.04mi |
| 1206 Winston Rd Columbus, GA | 2.0 | 1.0 | 868 | $750 | $0.86 | 45d | 1 | 1.08mi |
| 2728 9th St Columbus, GA | 3.0 | 1.0 | 880 | $865 | $0.98 | 45d | 1 | 1.14mi |
| 2724 9th St Columbus, GA | 2.0 | 1.0 | 900 | $875 | $0.97 | 15d | 1 | 1.14mi |
| 243 Oakley Ct Columbus, GA | 1.0–2.0 | 1.0–2.0 | 1005 | $1,149 | $1.14 | 15d | 6 | 1.17mi |
| 3909 Baker Plaza Dr Columbus, GA | 1.0–2.0 | 1.0–2.0 | 869 | $1,010 | $1.16 | 15d | 1 | 1.20mi |
| 3128 Carver St Columbus, GA | 3.0 | 1.0 | 988 | $1,000 | $1.01 | 45d | 1 | 1.28mi |
| 3128 Carver St Columbus, GA | 3.0 | 1.0 | 988 | $925 | $0.94 | 23d | 1 | 1.28mi |
| 3309 10th St Columbus, GA | 3.0 | 1.0 | 1080 | $950 | $0.88 | 45d | 1 | 1.38mi |
| 9 Montclair Ct Unit B Columbus, GA | 2.0 | 1.5 | 959 | $950 | $0.99 | 45d | 1 | 1.45mi |
| 909 Farr Rd Columbus, GA | 1.0–4.0 | 1.0–1.5 | 1200 | $777 | $0.65 | 23d | 1 | 1.48mi |
| 1414 Foye Ave Columbus, GA | 2.0 | 1.0 | 1021 | $895 | $0.88 | 15d | 1 | 1.50mi |
Listing history 18 events
-
2026-05-12$110,000 Active 498-char remark
-
2025-03-07historical
-
2025-01-16status Back On Market
-
2024-12-31historical
-
2024-10-17price $129,000
-
2024-10-17price $129,000
-
2024-09-27price $135,000
-
2024-09-27price $135,000
-
2024-08-18$149,000 New
-
2023-06-21soldstatus $65,000
-
2023-06-20soldstatus $65,000 Closed
-
2023-03-27status Pending
-
2023-03-27status Under Contract
-
2023-03-26historical
-
2023-03-04price $64,999
-
2023-02-06price $69,999
-
2023-01-11$64,999 Active
-
2023-01-11$79,999 New
ⓘ Source: listings_history table (triggers on properties + properties_extension) + one-shot
backfill from property_details.listing_events for pre-trigger history.
Tax reassessment forecast GA · Resets to sale price
- Current annual tax
- $502 · $42/mo
- Projected year-2 tax
- $1,012 · $84/mo
- Expected delta
- +$510/yr (+$43/mo · 101.7%)
ⓘ Screening estimate from a state-policy table — verify with the county assessor before closing.
Climate risk First Street
- Flood 1/10 Low FEMA zone X (unshaded) · 0% chance over 30 yrs
- Wildfire 3/10 Moderate
- Heat 7/10 Severe 7 d/yr ≥107°F today · 18 d/yr by 30 yrs out
- Wind 6/10 Major 69% chance of damaging wind over 30 yrs
- Air quality 4/10 Moderate 4 unhealthy d/yr today · 5 by 30 yrs out
Nearby sold comps map
Loading sold comps map…
Walkable amenities ~0.75 mi
Loading nearby amenities…
Taxation est. · year 1
- Rental income
- $12,572
- − Mortgage interest
- −$6,162
- − Property taxes
- −$502
- − Insurance
- −$550
- − Repairs & maintenance
- −$1,006
- − Management
- −$1,006
- − Depreciation
- −$3,200
- Taxable income
- $147
- Est. tax owed @ 24.0%
- −$35
- After-tax cash flow
- $1,922/yr
For passive investors: Depreciation is non-cash, so a rental often shows a tax loss while cash-flowing — sheltering income. Rental losses are passive: they offset passive income freely, and up to $25,000/yr can offset ordinary (W-2) income if you actively participate and your MAGI is under $100k (phasing out to $0 by $150k); unused losses carry forward. On sale, claimed depreciation is recaptured at up to 25%, and gains may owe capital-gains tax (a 1031 exchange can defer both). Figures are a year-1 estimate at your 24.0% rate — not tax advice; consult a CPA.
Schools (NCES district)
- District
- Muscogee County
- NCES district ID
- 1303870
- Math proficiency
- 21% ▼ -11.00%
- Reading proficiency
- 30% ▼ -7.00%
- Median HH income
- $41,176
- Composite
- 21.6/100
- National rank
- #8297
- State rank
- #120 of 174 in GA
Livability — Columbus
- Score
- 64/100
- State rank
- #254
- US rank
- #14102
Category grades
Schools grade is shown separately in the Schools card above.
Census & demographics
- Census place
- Columbus, GA
- County
- Muscogee County · 180,764 people
- City population
- 180,764
- Metro
- Columbus, GA-AL
- Population (ZIP)
- 20,644
- Household income
- $32,401
- Rent vs Own
- Severe rent burden
- 1878.0
Population outlook (Muscogee County) Hauer SSP2
- Today (2025)
- 216,729 people
- By 2030
- 224,504 · +3.6%
- By 2040
- 238,318 · +10.0%
- By 2050
- 249,027 · +14.9%
- By 2075
- 264,862 · +22.2%
- By 2100
- 254,786 · +17.6%
Race, ethnicity, and origin ACS 2023
- Neighborhood character
- Predominantly Black (77%)
- Race & ethnicity
- Black 77% Hispanic / Latino 11% White 9% Two or more races 3% Asian 1%
- Hispanic origin (detail)
- Mexican 6% Puerto Rican 2%
- Foreign-born
- 6% · Canada
- Languages at home
- 88% English-only · Spanish 10% Other Indo-European 1%
Political lean MEDSL · Muscogee
- 2024 margin
- Strong D (+23.4) · D 61.4% · R 38.0%
- 2008→2024 swing
- +3.7pp toward D · 2008: 19.7pp · 2024: 23.4pp
- All cycles
- 2024: D+23.4 2020: D+24.0 2016: D+18.6 2012: D+21.3 2008: D+19.7
Not yet ingested
- Civics
- —
Market trends
- HPI YoY
- ▼ -22.30%
- Current HPI
- 131.4761
- Rent YoY
- ▲ 1.82%
- Metro
- Columbus, GA-AL
- State GDP YoY
- ▲ 2.66%
- F500 in state
- 28
Industry mix (Fortune 500 HQ in GA)
| Industry | F500 HQs | Revenue |
|---|---|---|
| Paper / Packaging | 2 | $29B |
|
||
| Retail | 1 | $160B |
|
||
| Transportation / Logistics | 1 | $91B |
|
||
| Airlines | 1 | $62B |
|
||
| Consumer Goods | 1 | $47B |
|
||
| Utilities | 1 | $25B |
|
||
Price history
+69.2% since first listed19 events — show timeline
- 2026-05-21 Pending — CBOR
- 2026-05-12 Listed $110,000 CBOR
- 2025-03-07 Listing Removed — GAMLS
- 2025-01-16 Relisted — GAMLS
- 2024-12-31 Listing Removed — GAMLS
- 2024-10-17 Price Changed $129,000 GAMLS
- 2024-10-17 Price Changed $129,000 CBOR
- 2024-09-27 Price Changed $135,000 CBOR
- 2024-09-27 Price Changed $135,000 GAMLS
- 2024-08-18 Listed $149,000 GAMLS
- 2023-06-21 Sold (Public Records) $65,000 Public Records
- 2023-06-20 Sold (MLS) $65,000 CBOR
- 2023-03-27 Pending — CBOR
- 2023-03-27 Pending — GAMLS
- 2023-03-26 Listing Removed — GAMLS
- 2023-03-04 Price Changed $64,999 GAMLS
- 2023-02-06 Price Changed $69,999 GAMLS
- 2023-01-11 Listed $79,999 GAMLS
- 2023-01-11 Listed $64,999 CBOR
Property tax history
+5.4%/yrLatest (2025): $502 · +0.2% YoY. Source: county tax records.
Cash-flow waterfall
monthlySold comps — $/sqft
last 12 mo · ≤1 miLoading sold comps…