 Duplex
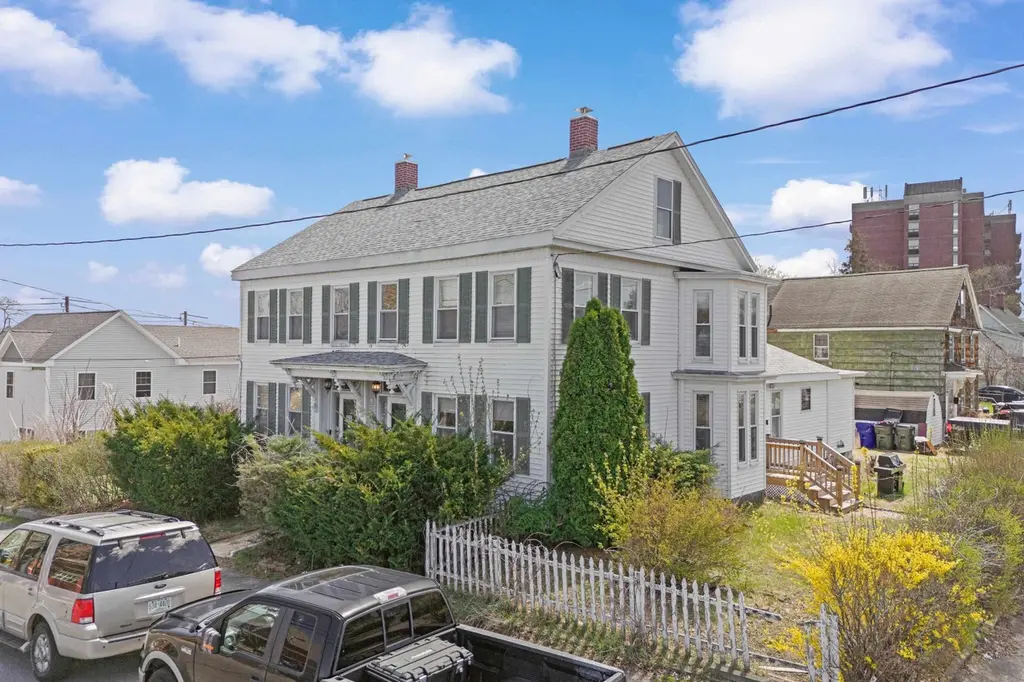
140 Douglas St · Manchester, NH
Flood risk 1/10 · Minimal
- FEMA flood zone
- X (unshaded)
- Chance of flooding over 30 yrs
- 0.0%
- Est. flood insurance / yr
- $507 – $1,088
Fire risk 1/10 · Minimal
- Est. fire insurance / yr
- $507 – $941
Heat risk 4/10 · Minor
- Hot days now (above 94°F)
- 7 days/yr
- Hot days in 30 yrs
- 16 days/yr
Wind risk 5/10 · Moderate
- Chance of severe wind over 30 yrs
- 25.0%
Air-quality risk 2/10 · Minimal
- Unhealthy air days now
- 1 days/yr
- Unhealthy air days in 30 yrs
- 2 days/yr
Risk factors via First Street. Map © Google.
Why this score? — see what drove the C+ grade
The composite is a weighted blend of 9 inputs, each scored 0–100. Each bar is that input's sub-score; the figure is the points it added to the 100-point composite (weight × sub-score).
- Cash flow +22.3/30.0
- ARV discount +15.0/15.0
- DSCR +7.1/10.0
- 1% rule +5.9/10.0
- Livability +4.2/5.0
- Rent growth +3.2/5.0
- Condition / age +2.5/5.0
- Schools +1.9/10.0
- Appreciation +0.0/10.0
$429,900
🖨 Deal sheet 📄 Offer letter ✓ Due diligence
Multi-family units
County records classify this as Multi-Family (2-4 Unit). Listing-text estimate: 2 units. confirmed
Listing remarks
Great Duplex with large 3 bedrooms units, separate laundry, newer roof, great parking, patio, covered porch, and plenty of attic space for storage. Showings to take place at the Open houses on May 2nd. and May 3rd. from 11:00 a. m. to 1:00 p. m. . The offer deadline is May 4th. at 5:00 p. m. . The Seller reserves the right to accept an offer at any time.
Key facts
- 8,276 sq ft lot
- Built 1920
- Listed 3 days
Property features AI
Finance
- Other: Total of 2 rental units; Both units are 3-bedroom units; Total finished area and overall area not listed in this output per instructions
Exterior
- Parking: Driveway parking (gravel)
- Utilities: Public water; Public sewer; Circuit breaker electrical service; Cable internet available; Trash service: municipal; Other utilities vary
- Home design: Duplex; Existing property; Built in 1920
- Construction: Vinyl siding; Shingle roof; Unfinished basement (foundation details not provided)
- Exterior features: Gravel driveway; Landscaped lot
Interior
- Kitchen: No specific kitchen appliance details provided
- Bedrooms: Unit 1 has 3 bedrooms; Unit 2 has 3 bedrooms
- Bathrooms: Two full bathrooms total (one in each unit)
- Heating & cooling: Hot air heating; Hot water heating; No central cooling
- Interior features: Unfinished basement with interior access; 6 rooms in Unit 1, 5 rooms in Unit 2
- Laundry & utility: No specific laundry appliances provided
Neighborhood map
What this means for you Summary
Snapshot
- This is a 2 × 3-bed/1.0-bath units multifamily listed at $430k.
Deal economics
- At list price, monthly cash flow is $709 ($9k/yr) — positive. Per door: $355/mo.
- The deal already cash-flows at list — no discount required.
- Meets the 1% rule at list price ($5k rent vs $430k).
- Cap rate 8.3% vs local median 3.1% in Manchester — top-decile yield for the area; either an underpriced asset or a hidden risk that comps aren't pricing in. Stress-test before assuming the spread holds.
Location & tenants
- Location reads 83/100 on livability (#10 in NH, #879 nationally) — a professional / high-income tenant draw. Strengths: amenities A+, commute A+, housing A+.
- Manchester School District (urban): math 14% / reading 27% proficiency, ranked #96 of 98 in NH (top 98%) — low school quality limits family demand, transient renter base, plan for 1-2y turnover.
- Market conditions: Rents rising (+3.0%/yr); 71 active listings in the ZIP; 981 units permitted in Hillsborough County in 2024 (381 in 5+ unit buildings).
- At $4,705/mo this rent would consume 76% of the median local household income ($74k/yr) (locally 1368% of renters already pay >50% of income on rent) — very limited rent-growth headroom before tenants either downsize or default.
Forward outlook
- Local home prices are declining (-3.0%/yr); year-one equity from $3k of loan paydown is wiped out by about $13k of value loss. Plan a longer hold.
- Hillsborough County population projected to shrink 8% by 2050 — rents likely to lag national; underwrite the cash flow, not the appreciation.
Negotiation context
- Only 3 days on market — expect competitive offers; lowballing is unlikely to land.
Risks & watch-outs
- Watch-outs: built in 1920 — expect roof / HVAC / electrical / plumbing capex.
- Climate carrying-cost: moderate wind risk, 25% chance of damaging wind over 30y — expect insurance premiums to compound above CPI over the hold.
Questions for the listing agent
- Can we see the unit-by-unit rent roll, current vacancy, and any below-market leases? What's the average tenancy length?
- What capital expenditures (roof, boiler, parking lot, exteriors) have been made in the last 5 years, and what's planned in the next 2?
- Built in 1920 — when were the roof, HVAC, electrical panel, plumbing, and water heater last replaced?
- Is there a deadline driving the sale (1031 exchange, divorce, estate, relocation)? That informs how much negotiation room exists.
- What's the average days-on-market for RENTAL listings here right now (not sales)? A rising rental-DOM trend means longer vacancies and softer asking-rent achievability than the comps imply.
- What's the recent tenant-quality profile in this submarket — average credit score on applications, eviction rate, late-payment / NSF rate, and stable-employment percentage? A property-management company in the area should have these aggregated.
- How much new apartment / multifamily construction is in the pipeline within 1–3 miles? Heavy new supply (>2% of stock underway) typically softens rents 12–24 months out; light construction supports rent growth.
Investment metrics
- 1% rule
- 1.09% ✓
- Cap rate
- 8.27%
- Cash-on-cash
- 7.07%
- DSCR
- 1.31
- GRM
- 7.6
CMA / ARV
- ARV (median comp)
- $548,083
- List price
- $429,900
- Delta
- -21.56%
- Verdict
- UNDERPRICED
- Comps
- 20 within 1.0 mi
Show comp detail 9 sales within ~0.75 mi
| Address | Dist | Beds/Ba | Sqft | Sold | Price | $/sf | Match |
|---|---|---|---|---|---|---|---|
| 162 Blaine St | 0.29mi | 7/3.0 (+1) | 2,772 (-5%) | 6mo | $605,000 | $218 | 63 |
| 16 Hevey St | 0.26mi | 6/3.0 | 3,150 (+8%) | 10mo | $625,000 | $198 | 62 |
| 89 4Th St | 0.22mi | 6/3.0 | 2,591 (-11%) | 9mo | $593,500 | $229 | 59 |
| 434 Hevey St | 0.66mi | 6/2.0 | 3,067 (+5%) | 10mo | $495,000 | $161 | 53 |
| 296 Bartlett St | 0.54mi | 6/3.0 | 2,736 (-6%) | 11mo | $599,000 | $219 | 51 |
| 231 Milford St | 0.61mi | 6/4.0 | 3,178 (+9%) | 1mo | $950,000 | $299 | 48 |
| 25 Parker St | 0.14mi | 6/3.0 | 2,496 (-15%) | 21mo | $540,000 | $216 | 48 |
| 310 Putnam St | 0.63mi | 6/4.0 | 3,036 (+4%) | 11mo | $720,000 | $237 | 47 |
| 157 Cumberland St | 0.72mi | 5/2.0 (-1) | 3,024 (+3%) | 11mo | $540,000 | $179 | 46 |
Match score weights: distance 35% · size 25% · config 20% · recency 20%. Top-matched comps best support the ARV.
Projected returns pro-forma
-3.0% appreciation · 2.96% rent growth · sell at horizon
- IRR
- -5.5%
- Equity multiple
- 0.80×
- Total profit
- $-24,588
- Equity at exit
- $64,099
- IRR
- 4.1%
- Equity multiple
- 1.30×
- Total profit
- $36,358
- Equity at exit
- $37,170
Cash invested: $120,372 (down + closing). Projections, not guarantees.
Landlord ↔ Tenant lean methodology
- Overall (STATE)
- 56 Moderately Landlord-Leaning
- State New Hampshire
- 56 Moderately Landlord-Leaning · D+1
- County
- — inherits STATE
- City
- — inherits STATE
ZIP-level market 03102
- Home prices YoY
- -16.2%
- Rents YoY
- 3.0%
- Active inventory
- 71
- Price-to-rent
- 15.2×
Monthly cashflow live
- Estimated rent
- $4,705 high interval (Pro) →
- Mortgage (P&I)
- −$2,254
- Tax from tax record
- −$574 /mo · $6,890/yr
- Insurance
- −$179
- HOA
- −$0
- Vacancy / Maint / Mgmt
- −$988
- Net cashflow
- $709
Break-even live
2-unit breakdown (identical units grouped — click to expand)
| Units | Beds | Baths | Est. rent |
|---|---|---|---|
| 2× units | 3 | 1 | $4,706 |
| #1 | 3 | 1 | $2,353 |
| #2 | 3 | 1 | $2,353 |
| Total (2 units) | $4,705 | ||
UW: 25.0% down · 7.5% · 30yr · 1.5% tax · 5.0% vac · 8.0% maint · 8.0% mgmt
Financing live
Cash to close
- Down payment
- $107,475
- Closing costs
- $12,897
- Reserves months
- —
- Total cash needed
- —
Loan-product check · same deal, 3 products live
Conventional
25% down · 7.5% · 30yr
- Down + closing
- —
- Monthly P&I
- —
- Monthly cashflow
- —
- DSCR
- —
- Eligible?
- —
Personal DTI + credit; lowest rate.
DSCR
20% down · 8.5% · 30yr
- Down + closing
- —
- Monthly P&I
- —
- Monthly cashflow
- —
- DSCR
- —
- Eligible?
- —
No personal income docs; deal must DSCR.
Hard money
10% down · 12.0% · 12mo
- Down + closing
- —
- Monthly P&I
- —
- Monthly cashflow
- —
- DSCR
- —
- Eligible?
- —
Short-term bridge; refi at stabilization.
Listing history 4 events
-
2026-05-06price $429,900 356-char remark
-
2026-05-06status Pending 356-char remark
-
2026-05-02$400,000 Active 356-char remark
-
2026-04-28historical $400,000 356-char remark
ⓘ Source: listings_history table (triggers on properties + properties_extension) + one-shot
backfill from property_details.listing_events for pre-trigger history.
Tax reassessment forecast NH · Partial reset (capped growth)
- Current annual tax
- $6,890 · $574/mo
- Projected year-2 tax
- $8,131 · $678/mo
- Expected delta
- +$1,241/yr (+$103/mo · 18.0%)
ⓘ Screening estimate from a state-policy table — verify with the county assessor before closing.
Climate risk First Street
- Flood 1/10 Low FEMA zone X (unshaded) · 0% chance over 30 yrs
- Wildfire 1/10 Low
- Heat 4/10 Moderate 7 d/yr ≥94°F today · 16 d/yr by 30 yrs out
- Wind 5/10 Major 25% chance of damaging wind over 30 yrs
- Air quality 2/10 Low 1 unhealthy d/yr today · 2 by 30 yrs out
Nearby sold comps map
Loading sold comps map…
Walkable amenities ~0.75 mi
Loading nearby amenities…
Taxation est. · year 1
- Rental income
- $56,460
- − Mortgage interest
- −$24,081
- − Property taxes
- −$6,890
- − Insurance
- −$2,150
- − Repairs & maintenance
- −$4,517
- − Management
- −$4,517
- − Depreciation
- −$12,506
- Taxable income
- $1,800
- Est. tax owed @ 24.0%
- −$432
- After-tax cash flow
- $8,079/yr
For passive investors: Depreciation is non-cash, so a rental often shows a tax loss while cash-flowing — sheltering income. Rental losses are passive: they offset passive income freely, and up to $25,000/yr can offset ordinary (W-2) income if you actively participate and your MAGI is under $100k (phasing out to $0 by $150k); unused losses carry forward. On sale, claimed depreciation is recaptured at up to 25%, and gains may owe capital-gains tax (a 1031 exchange can defer both). Figures are a year-1 estimate at your 24.0% rate — not tax advice; consult a CPA.
Schools (NCES district)
- District
- Manchester School District
- NCES district ID
- 3304590
- Math proficiency
- 14% ▼ -10.00%
- Reading proficiency
- 27% ▼ -6.00%
- Median HH income
- $54,096
- Composite
- 18.67/100
- National rank
- #8886
- State rank
- #96 of 98 in NH
Livability — Manchester
- Score
- 83/100
- State rank
- #10
- US rank
- #879
Category grades
Schools grade is shown separately in the Schools card above.
Census & demographics
- Census place
- Manchester, NH
- County
- Hillsborough County · 309,362 people
- City population
- 110,172
- Metro
- Manchester-Nashua, NH
- Population (ZIP)
- 33,959
- Household income
- $74,327
- Rent vs Own
- Severe rent burden
- 1368.0
Population outlook (Hillsborough County) Hauer SSP2
- Today (2025)
- 412,771 people
- By 2030
- 410,974 · -0.4%
- By 2040
- 399,959 · -3.1%
- By 2050
- 381,542 · -7.6%
- By 2075
- 339,855 · -17.7%
- By 2100
- 289,270 · -29.9%
Race, ethnicity, and origin ACS 2023
- Neighborhood character
- Predominantly White (75%)
- Race & ethnicity
- White 75% Hispanic / Latino 9% Two or more races 8% Black 6% Asian 5%
- Hispanic origin (detail)
- Mexican 1% Puerto Rican 3% Dominican 2%
- Common ancestry
- Lithuanian 11% Romanian 3% Slovak 3%
- Foreign-born
- 14% · Canada, China, India
- Languages at home
- 81% English-only · Spanish 5% French/Haitian/Cajun 5% Other Indo-European 3%
Political lean MEDSL · Hillsborough
- 2024 margin
- Toss-up / Even · D 50.9% · R 48.0% · Other 1.0%
- 2008→2024 swing
- -0.9pp no change · 2008: 3.8pp · 2024: 2.9pp
- All cycles
- 2024: D+2.9 2020: D+7.7 2016: R+0.2 2012: D+1.7 2008: D+3.8
Not yet ingested
- Civics
- —
Market trends
- HPI YoY
- ▼ -68.62%
- Current HPI
- 355.9606
- Rent YoY
- ▲ 2.96%
- Metro
- Manchester-Nashua, NH
- State GDP YoY
- —
- F500 in state
- 0
Price history
+7.5% since first listed4 events — show timeline
- 2026-05-06 Price Changed $429,900 PrimeMLS
- 2026-05-06 Pending — PrimeMLS
- 2026-05-02 Listed $400,000 PrimeMLS
- 2026-04-28 Coming Soon $400,000 PrimeMLS
Property tax history
+4.0%/yrLatest (2024): $6,890 · +3.8% YoY. Source: county tax records.
Cash-flow waterfall
monthlySold comps — $/sqft
last 12 mo · ≤1 miLoading sold comps…