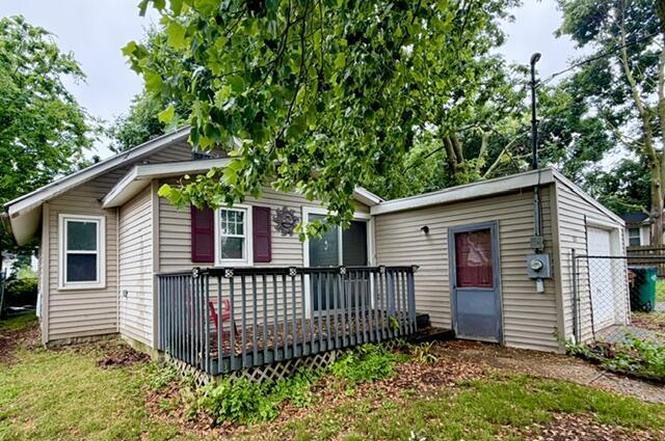
1027 Cooper Ave · Lansing, MI
Flood risk 1/10 · Minimal
- FEMA flood zone
- X (unshaded)
- Chance of flooding over 30 yrs
- 0.0%
- Est. flood insurance / yr
- $507 – $1,088
Fire risk 1/10 · Minimal
- Est. fire insurance / yr
- $784 – $1,456
Heat risk 3/10 · Minor
- Hot days now (above 96°F)
- 7 days/yr
- Hot days in 30 yrs
- 16 days/yr
Wind risk 2/10 · Minimal
- Chance of severe wind over 30 yrs
- —
Air-quality risk 2/10 · Minimal
- Unhealthy air days now
- 1 days/yr
- Unhealthy air days in 30 yrs
- 2 days/yr
Risk factors via First Street. Map © Google.
Why this score? — see what drove the B- grade
The composite is a weighted blend of 9 inputs, each scored 0–100. Each bar is that input's sub-score; the figure is the points it added to the 100-point composite (weight × sub-score).
- Cash flow +29.5/30.0
- DSCR +10.0/10.0
- 1% rule +9.6/10.0
- ARV discount +8.2/15.0
- Livability +4.0/5.0
- Rent growth +3.7/5.0
- Condition / age +2.5/5.0
- Schools +1.9/10.0
- Appreciation +0.0/10.0
$74,900
🖨 Deal sheet (PDF) 📄 Offer letter ✓ Due diligence
Listing remarks MLS
Welcome to 1027 Cooper Ave! Near MSU & Downtown! Cute to the Highest Power! Attached Garage! Fenced yard! Licensed Rental until Oct 2026. Vented for Electric Dryer in Garage & Bedroom. Must See! Taxes are non-homestead.
Key facts
- Attached garage
- Fenced yard
- Licensed rental
Tags
Property features AI
Finance
- Financial info: Current use: Rental
Exterior
- Parking: 1 garage space (not attached); Kitchen-level parking feature listed
- Utilities: Public sewer
- Home design: Ranch-style single-story home; Built in 1923; Property listed as updated/remodeled; Located on a city street in the Elmhurst subdivision
- Construction: Vinyl siding; One level
- Exterior features: Front yard fencing; Porch; Shingle roof; Paved road frontage
Interior
- Kitchen: Electric range; Free-standing refrigerator
- Bedrooms: Primary bedroom (approx. 15.0 x 9.2); Second bedroom (approx. 9.0 x 7.8); 2 bedrooms total
- Flooring: Carpet; Laminate; Vinyl
- Bathrooms: 1 full bathroom
- Heating & cooling: Electric heating; No central cooling
- Interior features: Updated/remodeled interior; Crawl space basement; Total of 4 rooms
- Laundry & utility: Washer on main level; Electric water heater
Neighborhood map
What this means for you Summary
Snapshot
- This is a 2-bed/1.0-bath single-family listed at $75k.
Deal economics
- At list price, monthly cash flow is $267 ($3k/yr) — positive.
- The deal already cash-flows at list — no discount required.
- Meets the 1% rule at list price ($1k rent vs $75k).
- Cap rate 10.6% vs local median 6.0% in Lansing — top-decile yield for the area; either an underpriced asset or a hidden risk that comps aren't pricing in. Stress-test before assuming the spread holds.
Location & tenants
- Location reads 79/100 on livability (#94 in MI, #2,182 nationally) — a middle-class / working-renter tenant base. Strengths: amenities A+, commute A+, cost of living A+; Watch: employment D, crime F.
- Lansing Public School District (urban): math 14% / reading 23% proficiency, ranked #650 of 760 in MI (top 86%) — low school quality limits family demand, transient renter base, plan for 1-2y turnover; 68% free/reduced lunch — lower-income household profile, screen leases tightly.
- Zoned schools: Cavanaugh School (315 students, 89% FRL); Attwood School (193 students, 88% FRL) — zoned schools average 88% FRL vs 68% district-wide (21 pts higher); higher-poverty schools than district average — tighter screening recommended.
- Market conditions: Rents rising fast (+4.7%/yr); 175 active listings in the ZIP; 22 comparable units currently listed for rent nearby; rentals at typical pace (median 23d on market — plan ~3-4 weeks tenant-placement turnaround); 41% of comp listings sitting > 30 days — soft ceiling on asking rent; 350 units permitted in Ingham County in 2024 (186 in 5+ unit buildings).
Forward outlook
- Local home prices are declining (-3.0%/yr); year-one equity from $518 of loan paydown is wiped out by about $2k of value loss. Plan a longer hold.
- Ingham County population projected at +11% by 2050 — modest demand growth; plan on rents tracking national, not racing it.
- At projected returns (-3.0% appreciation + 4.7% rent growth), your $21k cash investment doubles in ~7 years — after that, you're playing with house money.
Negotiation context
- Only 10 days on market — expect competitive offers; lowballing is unlikely to land.
- 11 sale attempts since 16y ago with the ask held roughly flat each time — persistent listings suggest the price (not the market) is what's stuck; bring a comps-based counter.
- Current owner paid $26k; list at $75k implies a 188% gain — meaningful room to come down on a strong offer.
Risks & watch-outs
- Watch-outs: property tax is 2.8% of price; built in 1923 — expect roof / HVAC / electrical / plumbing capex.
Questions for the listing agent
- Built in 1923 — when were the roof, HVAC, electrical panel, plumbing, and water heater last replaced?
- Property tax is high relative to price — has the assessment been appealed recently, and will the sale trigger a re-assessment?
- Is there a deadline driving the sale (1031 exchange, divorce, estate, relocation)? That informs how much negotiation room exists.
- Schools are F-rated, which usually means shorter tenancies and higher turnover. Who's the typical renter profile here, and what's been the actual vacancy rate?
- Crime grade is F in this area — have there been break-ins, vandalism, or insurance claims at this property in the last 3 years? What carrier currently insures it and at what premium?
- What's the average days-on-market for RENTAL listings here right now (not sales)? A rising rental-DOM trend means longer vacancies and softer asking-rent achievability than the comps imply.
- What's the recent tenant-quality profile in this submarket — average credit score on applications, eviction rate, late-payment / NSF rate, and stable-employment percentage? A property-management company in the area should have these aggregated.
- How much new for-sale + rental construction is in the pipeline within 1–3 miles? Heavy new supply typically softens prices + rents 12–24 months out; constrained supply supports both.
Investment metrics
- 1% rule
- 1.46% ✓
- Cap rate
- 10.57%
- Cash-on-cash
- 15.28%
- DSCR
- 1.68
- GRM
- 5.7
CMA / ARV
- ARV (on-the-fly)
- $76,128
- Comps found
- 12
Show comp detail 12 sales within ~0.75 mi
| Address | Dist | Beds/Ba | Sqft | Sold | Price | $/sf | Match |
|---|---|---|---|---|---|---|---|
| 2313 S Rundle Ave | 0.22mi | 2/1.0 | 664 (+6%) | 1mo | $118,500 | $178 | 78 |
| 815 Smith Ave | 0.27mi | 2/1.0 | 664 (+6%) | 2mo | $125,000 | $188 | 74 |
| 2011 S Martin Luther King Jr Blvd | 0.06mi | 2/1.0 | 704 (+13%) | 5mo | $65,000 | $92 | 72 |
| 511 W Mount Hope Ave | 0.39mi | 2/1.0 | 600 (-4%) | 6mo | $70,000 | $117 | 70 |
| 1839 Fletcher St | 0.17mi | 2/2.0 | 682 (+9%) | 4mo | $135,000 | $198 | 69 |
| 2011 Osband Ave | 0.34mi | 2/1.0 | 668 (+7%) | 6mo | $55,000 | $82 | 67 |
| 612 W Mount Hope Ave | 0.32mi | 2/1.0 | 699 (+12%) | 1mo | $51,000 | $73 | 64 |
| 907 Lenore Ave | 0.12mi | 2/1.0 | 715 (+15%) | 7mo | $62,000 | $87 | 64 |
| 1116 Cooper Ave | 0.11mi | 1/1.0 (-1) | 698 (+12%) | 11mo | $85,000 | $122 | 61 |
| 2110 Beal Ave | 0.22mi | 2/1.0 | 700 (+12%) | 11mo | $114,500 | $164 | 60 |
| 2018 Beal Ave | 0.22mi | 2/1.0 | 704 (+13%) | 13mo | $85,000 | $121 | 57 |
| 1208 Victor Ave | 0.36mi | 2/1.0 | 707 (+13%) | 10mo | $115,000 | $163 | 52 |
Match score weights: distance 35% · size 25% · config 20% · recency 20%. Top-matched comps best support the ARV.
Projected returns pro-forma
-3.0% appreciation · 4.71% rent growth · sell at horizon
- IRR
- 8.2%
- Equity multiple
- 1.33×
- Total profit
- $6,859
- Equity at exit
- $11,168
- IRR
- 19.0%
- Equity multiple
- 2.73×
- Total profit
- $36,292
- Equity at exit
- $6,476
Cash invested: $20,972 (down + closing). Projections, not guarantees.
Landlord ↔ Tenant lean methodology
- Overall (STATE)
- 62 Landlord-Friendly
- State Michigan
- 62 Landlord-Friendly · EVEN
- County
- — inherits STATE
- City
- — inherits STATE
ZIP-level market 48910
- Rents YoY
- 4.7%
- Active inventory
- 175
- Price-to-rent
- 5.7×
Monthly cashflow live
- Estimated rent
- $1,095 high interval (Pro) →
- Mortgage (P&I)
- −$393
- Tax from tax record
- −$174 /mo · $2,090/yr
- Insurance
- −$31
- HOA
- −$0
- Vacancy / Maint / Mgmt
- −$230
- Net cashflow
- $267
Break-even live
Sensitivity live
| Price | -10% $310 | -5% $288 | +0% $267 | +5% $246 | +10% $225 |
|---|---|---|---|---|---|
| Rent | -10% $181 | -5% $224 | +0% $267 | +5% $310 | +10% $354 |
| Rate | -1.0pp $305 | -0.5pp $286 | base $267 | +0.5pp $248 | +1.0pp $228 |
UW: 25.0% down · 7.5% · 30yr · 1.5% tax · 5.0% vac · 8.0% maint · 8.0% mgmt
Financing live
Cash to close
- Down payment
- $18,725
- Closing costs
- $2,247
- Reserves months
- —
- Total cash needed
- —
Loan-product check · same deal, 3 products live
Conventional
25% down · 7.5% · 30yr
- Down + closing
- —
- Monthly P&I
- —
- Monthly cashflow
- —
- DSCR
- —
- Eligible?
- —
Personal DTI + credit; lowest rate.
DSCR
20% down · 8.5% · 30yr
- Down + closing
- —
- Monthly P&I
- —
- Monthly cashflow
- —
- DSCR
- —
- Eligible?
- —
No personal income docs; deal must DSCR.
Hard money
10% down · 12.0% · 12mo
- Down + closing
- —
- Monthly P&I
- —
- Monthly cashflow
- —
- DSCR
- —
- Eligible?
- —
Short-term bridge; refi at stabilization.
Rent comps 22 comps
| Address | Beds | Baths | Sqft | Rent | $/sqft | DOM | Units | Dist |
|---|---|---|---|---|---|---|---|---|
| 1828 Davis Ave Lansing, MI | 2.0 | 1.0 | 700 | $1,150 | $1.64 | 45d | 1 | 0.48mi |
| 915 Loa St Lansing, MI | 2.0 | 1.0 | 674 | $999 | $1.48 | 45d | 1 | 0.60mi |
| 3031 S Washington Ave Lansing, MI | 1.0–2.0 | 1.0 | 725 | $1,100 | $1.52 | 45d | 1 | 0.69mi |
| 920 S Washington Ave Lansing, MI | 1.0–2.0 | 1.0–2.0 | 900 | $1,250 | $1.39 | 15d | 1 | 1.16mi |
| 3334 Pleasant Grove Rd Unit 19 Lansing, MI | 2.0 | 1.0 | 700 | $999 | $1.43 | 15d | 1 | 1.18mi |
| 855 S Washington Ave Lansing, MI | 1.0 | 1.0 | 576 | $1,245 | $2.16 | 23d | 3 | 1.25mi |
| 855 S Washington Ave Lansing, MI | 1.0 | 1.0 | 576 | $1,245 | $2.16 | 45d | 9 | 1.25mi |
| 825 S Washington Ave Apt 103 Lansing, MI | 1.0 | 1.0 | 520 | $1,095 | $2.11 | 45d | 1 | 1.27mi |
| 3515 Bergman Ave Lansing, MI | 2.0 | 1.0 | 640 | $1,195 | $1.87 | 23d | 1 | 1.28mi |
| 3533 Bergman Ave Lansing, MI | 2.0 | 1.0 | 500 | $900 | $1.80 | 23d | 1 | 1.29mi |
| 2114 Ferrol St Unit 1 Lansing, MI | 2.0 | 1.0 | 700 | $950 | $1.36 | 23d | 1 | 1.30mi |
| 3529 Bergman Ave Unit Bergman 3533 Lansing, MI | 2.0 | 1.0 | 500 | $900 | $1.80 | 23d | 1 | 1.30mi |
| 515 S Chestnut St Lansing, MI | 1.0 | 1.0 | 646 | $942 | $1.46 | 15d | 8 | 1.31mi |
| 1001 W Cavanaugh Rd Lansing, MI | 1.0–2.0 | 1.0 | 775 | $850 | $1.10 | 15d | 4 | 1.32mi |
| 3606 Pleasant Grove Rd Lansing, MI | 1.0–2.0 | 1.0 | 812 | $1,100 | $1.35 | 45d | 1 | 1.33mi |
| 911 W Cavanaugh Rd Lansing, MI | 1.0–2.0 | 1.0 | 775 | $1,000 | $1.29 | 23d | 1 | 1.35mi |
| 420 S Walnut St Lansing, MI | 1.0 | 1.0 | 525 | $875 | $1.67 | 45d | 1 | 1.39mi |
| 313 E Saint Joseph St Lansing, MI | 2.0 | 1.0 | 475 | $1,150 | $2.42 | 15d | 7 | 1.45mi |
| 335 E Saint Joseph St Unit 6 Lansing, MI | 2.0 | 1.0 | 700 | $949 | $1.36 | 45d | 1 | 1.47mi |
| 1424 S Pennsylvania Ave Lansing, MI | 1.0 | 1.0 | 700 | $915 | $1.31 | 45d | 1 | 1.48mi |
| 1420 S Pennsylvania Ave Lansing, MI | 1.0 | 1.0 | 700 | $750 | $1.07 | 23d | 3 | 1.49mi |
| 3313 W Mt Hope Ave Lansing, MI | 2.0 | 1.0–2.0 | 869 | $1,296 | $1.49 | 15d | 6 | 1.50mi |
Listing history 8 events
-
2026-06-21days on market $74,900 Active 10 DOM
-
2026-06-18days on market $74,900 Active 7 DOM
-
2026-06-17days on market $74,900 Active 6 DOM
-
2026-06-16days on market $74,900 Active 5 DOM
-
2026-06-15days on market $74,900 Active 4 DOM
-
2026-06-14days on market $74,900 Active 2 DOM
-
2026-06-13remarks 223-char remark
-
2026-06-13$74,900 Active 1 DOM
ⓘ Source: listings_history table (triggers on properties + properties_extension) + one-shot
backfill from property_details.listing_events for pre-trigger history.
Tax reassessment forecast MI · Partial reset (capped growth)
- Current annual tax
- $2,090 · $174/mo
- Projected year-2 tax
- $2,090 · $174/mo
- Expected delta
- $0/yr ($0/mo · 0.0%)
ⓘ Screening estimate from a state-policy table — verify with the county assessor before closing.
Climate risk First Street
- Flood 1/10 Low FEMA zone X (unshaded) · 0% chance over 30 yrs
- Wildfire 1/10 Low
- Heat 3/10 Moderate 7 d/yr ≥96°F today · 16 d/yr by 30 yrs out
- Wind 2/10 Low
- Air quality 2/10 Low 1 unhealthy d/yr today · 2 by 30 yrs out
Nearby sold comps map
Loading sold comps map…
Walkable amenities ~0.75 mi
Loading nearby amenities…
Taxation est. · year 1
- Rental income
- $13,143
- − Mortgage interest
- −$4,196
- − Property taxes
- −$2,090
- − Insurance
- −$374
- − Repairs & maintenance
- −$1,051
- − Management
- −$1,051
- − Depreciation
- −$2,179
- Taxable income
- $2,202
- Est. tax owed @ 24.0%
- −$528
- After-tax cash flow
- $2,677/yr
For passive investors: Depreciation is non-cash, so a rental often shows a tax loss while cash-flowing — sheltering income. Rental losses are passive: they offset passive income freely, and up to $25,000/yr can offset ordinary (W-2) income if you actively participate and your MAGI is under $100k (phasing out to $0 by $150k); unused losses carry forward. On sale, claimed depreciation is recaptured at up to 25%, and gains may owe capital-gains tax (a 1031 exchange can defer both). Figures are a year-1 estimate at your 24.0% rate — not tax advice; consult a CPA.
Schools (NCES district)
- District
- Lansing Public School District
- NCES district ID
- 2621150
- Math proficiency
- 14% ▲ 1.00%
- Reading proficiency
- 23% ▲ 3.00%
- Median HH income
- $37,453
- Composite
- 18.76/100
- National rank
- #14002
- State rank
- #650 of 760 in MI
Livability — Lansing
- Score
- 79/100
- State rank
- #94
- US rank
- #2182
Category grades
Schools grade is shown separately in the Schools card above.
Census & demographics
- Census place
- Lansing, MI
- County
- Ingham County · 237,052 people
- City population
- 161,269
- Metro
- Lansing-East Lansing, MI
- Population (ZIP)
- 32,800
- Household income
- $54,712
- Rent vs Own
- Severe rent burden
- 1305.0
Population outlook (Ingham County) Hauer SSP2
- Today (2025)
- 300,362 people
- By 2030
- 307,808 · +2.5%
- By 2040
- 320,492 · +6.7%
- By 2050
- 333,223 · +10.9%
- By 2075
- 373,693 · +24.4%
- By 2100
- 392,021 · +30.5%
Race, ethnicity, and origin ACS 2023
- Neighborhood character
- Diverse neighborhood (Simpson 0.62)
- Race & ethnicity
- White 58% Black 16% Hispanic / Latino 12% Two or more races 12% Asian 4% Native American 1%
- Hispanic origin (detail)
- Mexican 9% Cuban 2%
- Common ancestry
- Romanian 5% Lithuanian 3% Slovak 2%
- Foreign-born
- 9% · Canada, China, Vietnam
- Languages at home
- 87% English-only · Spanish 6% Chinese 1% Other Indo-European 1%
Political lean MEDSL · Ingham
- 2024 margin
- Strong D (+29.7) · D 63.9% · R 34.2% · Other 2.0%
- 2008→2024 swing
- -3.6pp toward R · 2008: 33.3pp · 2024: 29.7pp
- All cycles
- 2024: D+29.7 2020: D+32.2 2016: D+27.6 2012: D+27.9 2008: D+33.3
Not yet ingested
- Civics
- —
Market trends
- HPI YoY
- ▼ -211.82%
- Current HPI
- 196.8087
- Rent YoY
- ▲ 4.71%
- Metro
- Lansing-East Lansing, MI
- State GDP YoY
- ▲ 1.37%
- F500 in state
- 28
Industry mix (Fortune 500 HQ in MI)
| Industry | F500 HQs | Revenue |
|---|---|---|
| Automotive Parts | 3 | $48B |
|
||
| Automotive | 2 | $372B |
|
||
| Chemicals | 1 | $45B |
|
||
| Automotive Retail | 1 | $29B |
|
||
| Healthcare / Medical Devices | 1 | $23B |
|
||
| Automotive Technology | 1 | $20B |
|
||
Price history
+87.7% since first listed20 events — show timeline
- 2026-06-11 Listed $74,900 REALCOMP
- 2026-06-11 Listed $74,900 Greater Lansing AoR
- 2019-10-17 Listing Removed — REALCOMP
- 2019-10-17 Listing Removed — Greater Lansing AoR
- 2019-07-31 Listed $54,900 REALCOMP
- 2019-07-31 Listed $54,900 Greater Lansing AoR
- 2019-05-23 Sold (MLS) $26,000 Greater Lansing AoR
- 2019-05-23 Sold (MLS) $26,000 REALCOMP
- 2019-04-09 Listed $32,900 Greater Lansing AoR
- 2019-04-09 Listed $32,900 REALCOMP
- 2017-10-27 Listing Removed — Greater Lansing AoR
- 2017-10-27 Listing Removed — REALCOMP
- 2017-10-04 Listing Removed — REALCOMP
- 2017-10-04 Listing Removed — Greater Lansing AoR
- 2017-10-04 Listed $32,500 Greater Lansing AoR
- 2017-10-04 Listed $32,500 REALCOMP
- 2017-04-05 Listed $32,500 REALCOMP
- 2017-04-05 Listed $32,500 Greater Lansing AoR
- 2010-06-07 Listing Removed — Greater Lansing AoR
- 2010-04-26 Listed $39,900 Greater Lansing AoR
Property tax history
+4.9%/yrLatest (2025): $2,090 · +3.0% YoY. Source: county tax records.
Cash-flow waterfall
monthlySold comps — $/sqft
last 12 mo · ≤1 miLoading sold comps…