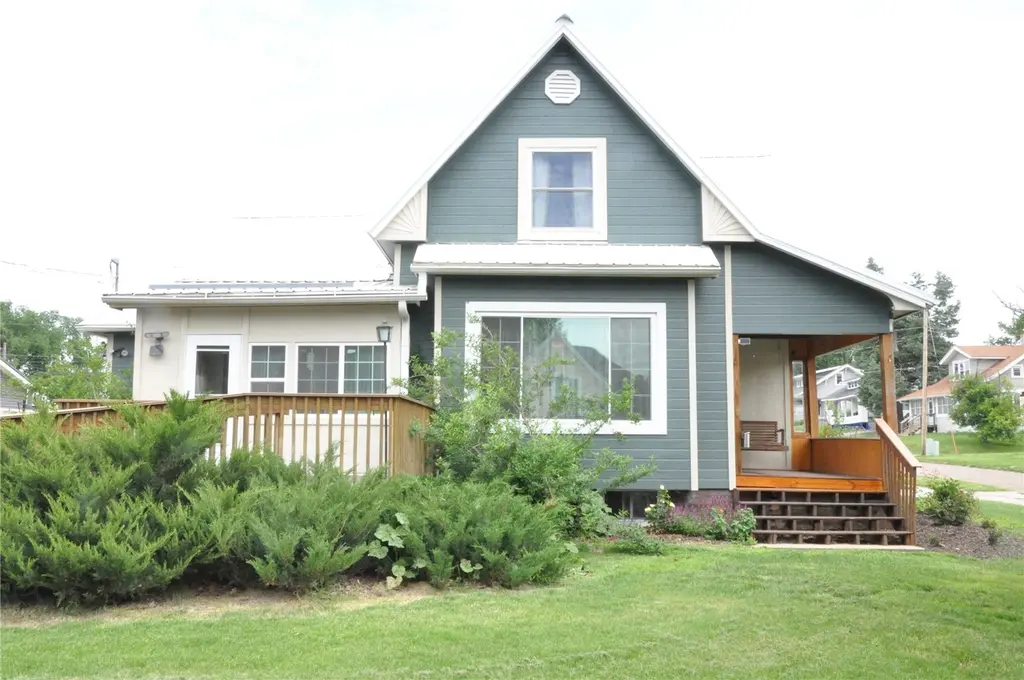
1402 11th Ave · Belle Plaine, IA
Flood risk 1/10 · Minimal
- FEMA flood zone
- X (unshaded)
- Chance of flooding over 30 yrs
- 0.0%
- Est. flood insurance / yr
- $473 – $860
Fire risk 4/10 · Minor
- Est. fire insurance / yr
- $902 – $1,676
Heat risk 3/10 · Minor
- Hot days now (above 103°F)
- 7 days/yr
- Hot days in 30 yrs
- 15 days/yr
Wind risk 2/10 · Minimal
- Chance of severe wind over 30 yrs
- —
Air-quality risk 1/10 · Minimal
- Unhealthy air days now
- 0 days/yr
- Unhealthy air days in 30 yrs
- 0 days/yr
Risk factors via First Street. Map © Google.
Why this score? — see what drove the C- grade
The composite is a weighted blend of 9 inputs, each scored 0–100. Each bar is that input's sub-score; the figure is the points it added to the 100-point composite (weight × sub-score).
- Cash flow +12.2/30.0
- ARV discount +10.6/15.0
- Appreciation +10.0/10.0
- Schools +5.9/10.0
- Livability +3.8/5.0
- DSCR +3.6/10.0
- 1% rule +2.7/10.0
- Rent growth +2.5/5.0
- Condition / age +2.5/5.0
$140,000
🖨 Deal sheet (PDF) 📄 Offer letter ✓ Due diligence
Listing remarks
This home shows pride in ownership throughout. Almost everything is newer throughout in this 3BR 2BA beauty. New luxury planking in LR, DR, & kitchen. New carpet in 1st floor BR. The kitchen has newer oak cupboards, counter tops, steel sink, backsplash, & appliances. New 7k picture window in LR. The main floor BA was updated as well and located by BR and a large closet. 1st floor laundry. Two years ago, the upper level was updated w/ new plank flooring, paint, bath, plumbing & windows. Sharp newer 6 panel doors a & ceiling fans throughout. Newer exterior doors. Other features include 2 sharp sheds, newer gutters, 6” privacy fence, wood siding, steel cellar door, &
Key facts
- New picture window
- New carpet
- Newer appliances
Tags
Property features AI
Exterior
- Parking: No dedicated parking
- Security: Security system
- Utilities: Public water; Public sewer
- Home design: Single-family residence; Residential property
- Construction: Frame construction; Wood siding; Built area above grade: 1,572
- Exterior features: Deck; Patio; Fenced yard; Satellite dish; Accessible entrance
Interior
- Kitchen: Range; Range hood; Dishwasher; Refrigerator; Gas water heater
- Bathrooms: 2 full bathrooms
- Heating & cooling: Natural gas heating; Forced air heating; Central air conditioning
- Interior features: Eat-in kitchen; Full basement; Main-level laundry
- Laundry & utility: Washer; Dryer
Neighborhood map
What this means for you Summary
Snapshot
- This is a 2-bed/2.0-bath single-family listed at $140k.
Deal economics
- At list price, monthly cash flow is $-29 ($-345/yr) — negative.
- To cash-flow at today's rent, offer at most $135k (3.6% below list).
- To meet the 1% rule (rent ≥ 1% of price), the offer needs to be $108k (23.0% below list).
- Recommended offer: $108k (23.0% below list) — sets the bar for 1% rule.
- Cap rate 6.0% vs local median 3.7% in Belle Plaine — top-decile yield for the area; either an underpriced asset or a hidden risk that comps aren't pricing in. Stress-test before assuming the spread holds.
Location & tenants
- Location reads 75/100 on livability (#215 in IA, #3,962 nationally) — a middle-class / working-renter tenant base. Strengths: cost of living A+, housing A+, health & safety A+; Watch: crime C-, amenities F, commute F.
- Belle Plaine Community School District (rural): math 68% / reading 74% proficiency, ranked #144 of 289 in IA (top 50%) — strong family-tenant draw, lease renewals of 3-5y typical.
- Zoned schools: Longfellow Elementary School (math 72% / reading 72%, grade A-, #181 of 616 statewide, top 34%, 286 students, 44% FRL); Belle Plaine Jr/Sr High School (math 62% / reading 77%, grade B, #152 of 336 statewide, top 52%, 193 students, 35% FRL).
- Market conditions: 33 active listings in the ZIP; 34 units permitted in Benton County in 2024 (0 in 5+ unit buildings).
Forward outlook
- In year one you build about $15k of equity ($968 loan paydown + $14k appreciation (10.0% local appreciation)).
- Benton County population projected at -13% by 2050 — secular population decline; favor cash flow + early exit over multi-decade hold.
- At projected returns (10.0% appreciation + 3.0% rent growth), your $39k cash investment doubles in ~3 years — after that, you're playing with house money.
- By year 3, paydown + projected appreciation supports a ~$38k cash-out refi (75% LTV) — recoverable capital for the next deal without selling this one.
Negotiation context
- It's been on market 20 days — a 2% lower offer ($138k) is reasonable based on typical stale-listing flexibility.
- Current owner paid $25k; list at $140k implies a 460% gain — meaningful room to come down on a strong offer.
Risks & watch-outs
- Watch-outs: built in 1865 — expect roof / HVAC / electrical / plumbing capex.
Questions for the listing agent
- What do current leases actually rent for vs. the listed asking? Can we see a recent rent roll and the last 12 months of T-12 income?
- Built in 1865 — when were the roof, HVAC, electrical panel, plumbing, and water heater last replaced?
- Is there a deadline driving the sale (1031 exchange, divorce, estate, relocation)? That informs how much negotiation room exists.
- Schools are B-rated — typically a magnet for longer-tenancy family renters. What's the average tenant stay here, and is there a school-zone premium baked into asking?
- What's the average days-on-market for RENTAL listings here right now (not sales)? A rising rental-DOM trend means longer vacancies and softer asking-rent achievability than the comps imply.
- What's the recent tenant-quality profile in this submarket — average credit score on applications, eviction rate, late-payment / NSF rate, and stable-employment percentage? A property-management company in the area should have these aggregated.
- How much new for-sale + rental construction is in the pipeline within 1–3 miles? Heavy new supply typically softens prices + rents 12–24 months out; constrained supply supports both.
Investment metrics
- 1% rule
- 0.77% ✗
- Cap rate
- 6.05%
- Cash-on-cash
- -0.88%
- DSCR
- 0.96
- GRM
- 10.8
CMA / ARV
- ARV (on-the-fly)
- $150,297
- Comps found
- 12
Show comp detail 12 sales within ~0.75 mi
| Address | Dist | Beds/Ba | Sqft | Sold | Price | $/sf | Match |
|---|---|---|---|---|---|---|---|
| 1609 11th Ave | 0.21mi | 2/2.0 | 1,214 (-4%) | 10mo | $105,000 | $86 | 76 |
| 1311 11th Ave | 0.04mi | 3/1.5 (+1) | 1,232 (-2%) | 19mo | $126,000 | $102 | 71 |
| 1509 9th Ave | 0.19mi | 3/2.0 (+1) | 1,300 (+3%) | 13mo | $270,000 | $208 | 71 |
| 1210 8th St | 0.45mi | 3/2.0 (+1) | 1,248 (-1%) | 5mo | $185,000 | $148 | 68 |
| 1512 7th Ave | 0.37mi | 3/2.0 (+1) | 1,201 (-5%) | 14mo | $87,000 | $72 | 58 |
| 705 10th St | 0.41mi | 3/1.5 (+1) | 1,176 (-7%) | 6mo | $110,000 | $94 | 58 |
| 504 17th St | 0.54mi | 3/1.5 (+1) | 1,363 (+8%) | 5mo | $140,000 | $103 | 50 |
| 904 10th St | 0.29mi | 3/1.5 (+1) | 1,093 (-14%) | 10mo | $130,000 | $119 | 49 |
| 605 9th St | 0.53mi | 2/1.0 | 1,152 (-9%) | 10mo | $151,000 | $131 | 48 |
| 712 19th St | 0.47mi | 3/1.5 (+1) | 1,431 (+13%) | 7mo | $223,000 | $156 | 43 |
| 1307 2nd Ave | 0.73mi | 3/1.0 (+1) | 1,207 (-4%) | 16mo | $98,000 | $81 | 37 |
| 608 6th Ave | 0.72mi | 2/1.0 | 1,108 (-12%) | 15mo | $136,000 | $123 | 30 |
Match score weights: distance 35% · size 25% · config 20% · recency 20%. Top-matched comps best support the ARV.
Projected returns pro-forma
10.0% appreciation · 3.0% rent growth · sell at horizon
- IRR
- 23.6%
- Equity multiple
- 2.90×
- Total profit
- $74,378
- Equity at exit
- $126,123
- IRR
- 21.0%
- Equity multiple
- 6.62×
- Total profit
- $220,397
- Equity at exit
- $271,989
Cash invested: $39,200 (down + closing). Projections, not guarantees.
Landlord ↔ Tenant lean methodology
- Overall (STATE)
- 83 Strongly Landlord-Friendly
- State Iowa
- 83 Strongly Landlord-Friendly · R+6
- County
- — inherits STATE
- City
- — inherits STATE
ZIP-level market 52208
- Home prices YoY
- 5.4%
- Active inventory
- 33
- Price-to-rent
- 10.8×
Monthly cashflow live
- Estimated rent
- $1,078 medium interval (Pro) →
- Mortgage (P&I)
- −$734
- Tax from tax record
- −$88 /mo · $1,054/yr
- Insurance
- −$58
- HOA
- −$0
- Vacancy / Maint / Mgmt
- −$226
- Net cashflow
- $-29
Break-even live
Sensitivity live
| Price | -10% $50 | -5% $11 | +0% $-29 | +5% $-68 | +10% $-108 |
|---|---|---|---|---|---|
| Rent | -10% $-114 | -5% $-71 | +0% $-29 | +5% $14 | +10% $56 |
| Rate | -1.0pp $42 | -0.5pp $7 | base $-29 | +0.5pp $-65 | +1.0pp $-102 |
UW: 25.0% down · 7.5% · 30yr · 1.5% tax · 5.0% vac · 8.0% maint · 8.0% mgmt
Financing live
Cash to close
- Down payment
- $35,000
- Closing costs
- $4,200
- Reserves months
- —
- Total cash needed
- —
Loan-product check · same deal, 3 products live
Conventional
25% down · 7.5% · 30yr
- Down + closing
- —
- Monthly P&I
- —
- Monthly cashflow
- —
- DSCR
- —
- Eligible?
- —
Personal DTI + credit; lowest rate.
DSCR
20% down · 8.5% · 30yr
- Down + closing
- —
- Monthly P&I
- —
- Monthly cashflow
- —
- DSCR
- —
- Eligible?
- —
No personal income docs; deal must DSCR.
Hard money
10% down · 12.0% · 12mo
- Down + closing
- —
- Monthly P&I
- —
- Monthly cashflow
- —
- DSCR
- —
- Eligible?
- —
Short-term bridge; refi at stabilization.
Listing history 15 events
-
2026-06-21days on market $140,000 Active 20 DOM
-
2026-06-21days on market $140,000 Active 19 DOM
-
2026-06-18days on market $140,000 Active 17 DOM
-
2026-06-17days on market $140,000 Active 16 DOM
-
2026-06-16days on market $140,000 Active 15 DOM
-
2026-06-15days on market $140,000 Active 14 DOM
-
2026-06-13days on market $140,000 Active 12 DOM
-
2026-06-12days on market $140,000 Active 11 DOM
-
2026-06-09days on market $140,000 Active 8 DOM
-
2026-06-08days on market $140,000 Active 7 DOM
-
2026-06-07days on market $140,000 Active 6 DOM
-
2026-06-07days on market $140,000 Active 5 DOM
-
2026-06-04days on market $140,000 Active 2 DOM
-
2026-06-02remarks 677-char remark
-
2026-06-02$140,000 Active 1 DOM
ⓘ Source: listings_history table (triggers on properties + properties_extension) + one-shot
backfill from property_details.listing_events for pre-trigger history.
Tax reassessment forecast IA · Partial reset (capped growth)
- Current annual tax
- $1,054 · $88/mo
- Projected year-2 tax
- $1,626 · $136/mo
- Expected delta
- +$572/yr (+$48/mo · 54.3%)
ⓘ Screening estimate from a state-policy table — verify with the county assessor before closing.
Climate risk First Street
- Flood 1/10 Low FEMA zone X (unshaded) · 0% chance over 30 yrs
- Wildfire 4/10 Moderate
- Heat 3/10 Moderate 7 d/yr ≥103°F today · 15 d/yr by 30 yrs out
- Wind 2/10 Low
- Air quality 1/10 Low 0 unhealthy d/yr today · 0 by 30 yrs out
Nearby sold comps map
Loading sold comps map…
Walkable amenities ~0.75 mi
Loading nearby amenities…
Taxation est. · year 1
- Rental income
- $12,935
- − Mortgage interest
- −$7,842
- − Property taxes
- −$1,054
- − Insurance
- −$700
- − Repairs & maintenance
- −$1,035
- − Management
- −$1,035
- − Depreciation
- −$4,073
- Taxable loss
- −$2,803
- Est. tax savings @ 24.0%
- +$673
- After-tax cash flow
- $327/yr
For passive investors: Depreciation is non-cash, so a rental often shows a tax loss while cash-flowing — sheltering income. Rental losses are passive: they offset passive income freely, and up to $25,000/yr can offset ordinary (W-2) income if you actively participate and your MAGI is under $100k (phasing out to $0 by $150k); unused losses carry forward. On sale, claimed depreciation is recaptured at up to 25%, and gains may owe capital-gains tax (a 1031 exchange can defer both). Figures are a year-1 estimate at your 24.0% rate — not tax advice; consult a CPA.
Schools (NCES district)
- District
- Belle Plaine Community School District
- NCES district ID
- 1904620
- Math proficiency
- 68% ▼ -5.00%
- Reading proficiency
- 74% ▬ 0.00%
- Median HH income
- $42,054
- Composite
- 59.42/100
- National rank
- #927
- State rank
- #144 of 289 in IA
Livability — Belle Plaine
- Score
- 75/100
- State rank
- #215
- US rank
- #3962
Category grades
Schools grade is shown separately in the Schools card above.
Census & demographics
- Census place
- Belle Plaine, IA
- Population (ZIP)
- 2,921
Population outlook (Benton County) Hauer SSP2
- Today (2025)
- 25,078 people
- By 2030
- 24,606 · -1.9%
- By 2040
- 23,425 · -6.6%
- By 2050
- 21,891 · -12.7%
- By 2075
- 19,482 · -22.3%
- By 2100
- 17,139 · -31.7%
Race, ethnicity, and origin ACS 2023
- Neighborhood character
- Predominantly White (94%)
- Race & ethnicity
- White 94% Hispanic / Latino 3% Two or more races 3%
- Common ancestry
- Slovak 3% Portuguese 3% Lithuanian 3%
- Foreign-born
- 1% · Canada
- Languages at home
- 98% English-only · Spanish 1%
Political lean MEDSL · Benton
- 2024 margin
- Solid R (+33.2) · D 32.8% · R 66.0% · Other 1.3%
- 2008→2024 swing
- -37.7pp toward R · 2008: 4.5pp · 2024: -33.2pp
- All cycles
- 2024: R+33.2 2020: R+27.5 2016: R+26.0 2012: R+0.6 2008: D+4.5
Not yet ingested
- Civics
- —
Market trends
- HPI YoY
- ▲ 12.07%
- Current HPI
- 237.1468
- Rent YoY
- —
- Metro
- —
- State GDP YoY
- ▲ 2.48%
- F500 in state
- 4
Industry mix (Fortune 500 HQ in IA)
| Industry | F500 HQs | Revenue |
|---|---|---|
| Financial Services | 1 | $16B |
|
||
| Retail / Convenience | 1 | $15B |
|
||
Price history
+833.3% since first listed5 events — show timeline
- 2026-06-01 Listed $140,000 CRAAR, CDRMLS
- 2018-01-10 Sold (Public Records) $25,000 Public Records
- 2016-09-29 Sold (Public Records) $25,000 Public Records
- 2008-12-17 Sold (Public Records) $15,000 Public Records
- 1985-08-31 Sold (Public Records) $15,000 Public Records
Property tax history
+1.5%/yrLatest (2025): $1,054 · -4.9% YoY. Source: county tax records.
Cash-flow waterfall
monthlySold comps — $/sqft
last 12 mo · ≤1 miLoading sold comps…